How to read these slides?
 Overview
Click on the menu bar items to navigate to chapters
Click here for PDF version
Journal Club: Time Curves
Julian Rakuschek
23.01.2025
Motivation
Temporal Patterns

Article Revision
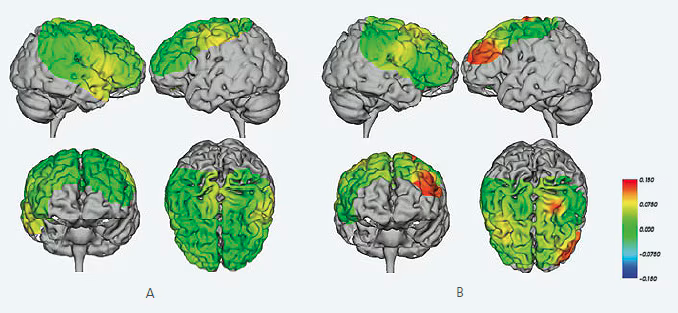
Brain Activity
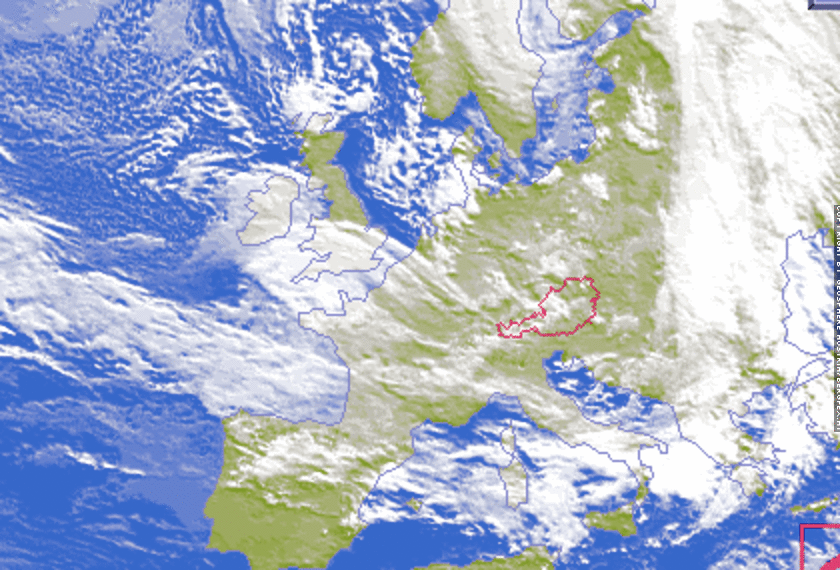
Climate
Domain specific visualizations exist
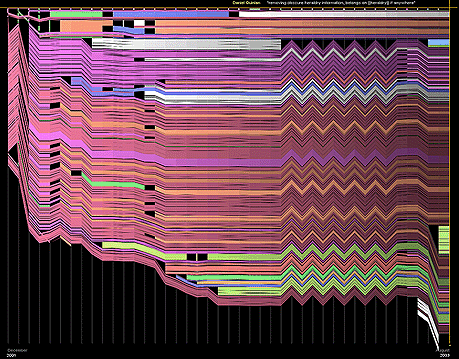
Revisions of the "Chocolate" Wikipedia article
The Problem: They are not easy to adapt for other domains!
The goal: Development of dataset agnostic visualization method.
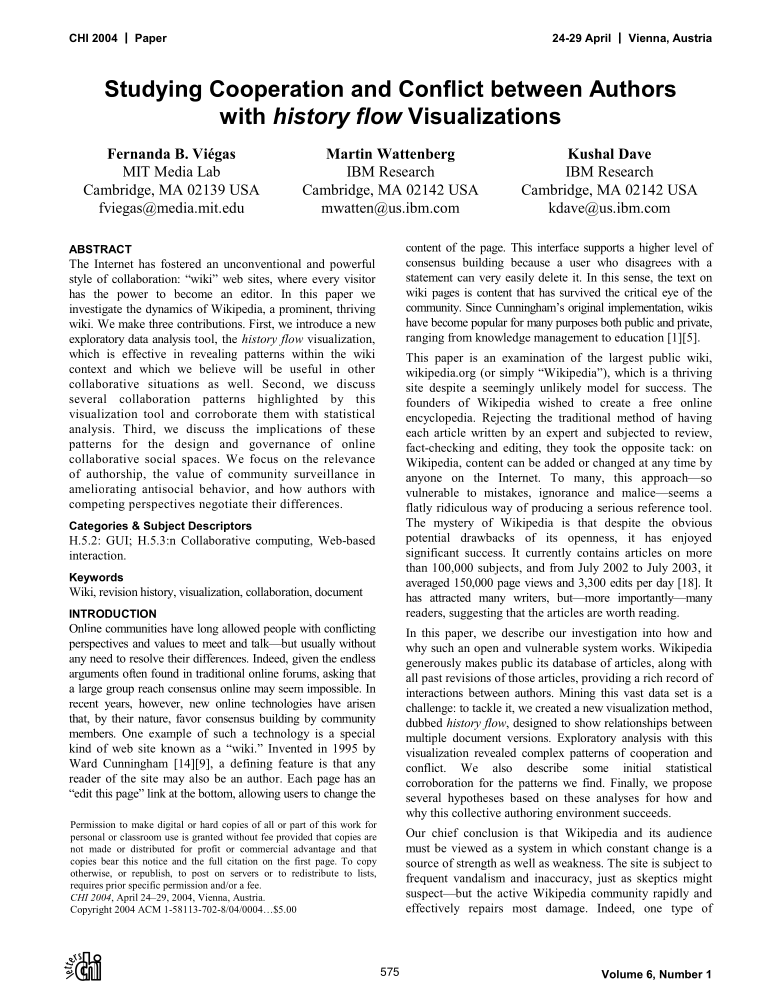
The Paper
2016 TVCG Paper with 247 citations (Google Scholar)
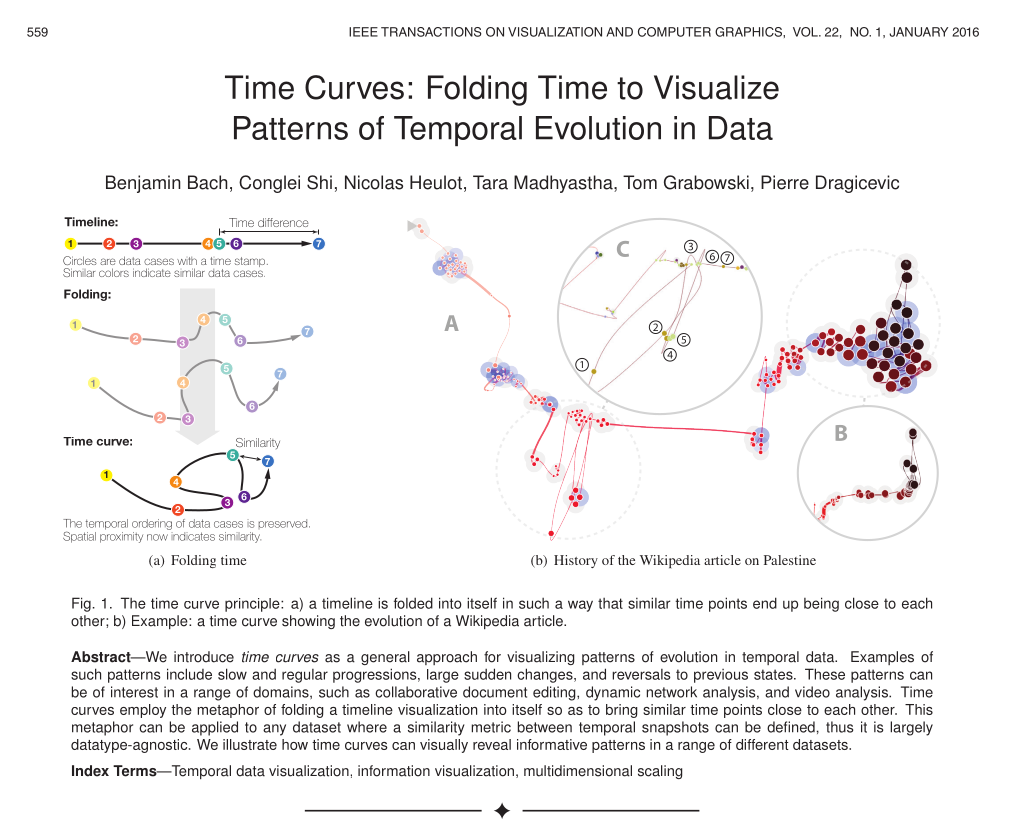
Time Curves
What do we need?
First: Snapshots of your dataset at different time points
Second: Similarity Measure
Example

Snapshots of Wikipedia articles
Similarity measure: edit distance
Arranging Points by Similarity
Multidimensional Scaling
\[ \text{Stress}_D (x_1, x_2, \ldots, x_N) = \sqrt{\sum_{i \neq j = 1, \ldots, N} (d_{ij} - \|x_i - x_j\|)^2} \]$x_i \ldots$ data points in projected space
$d_{ij} \ldots$ similarity between data points in high dimensional space
$\|x_i - x_j\| \ldots$ distance between projected points
Goal: Minimise Stress
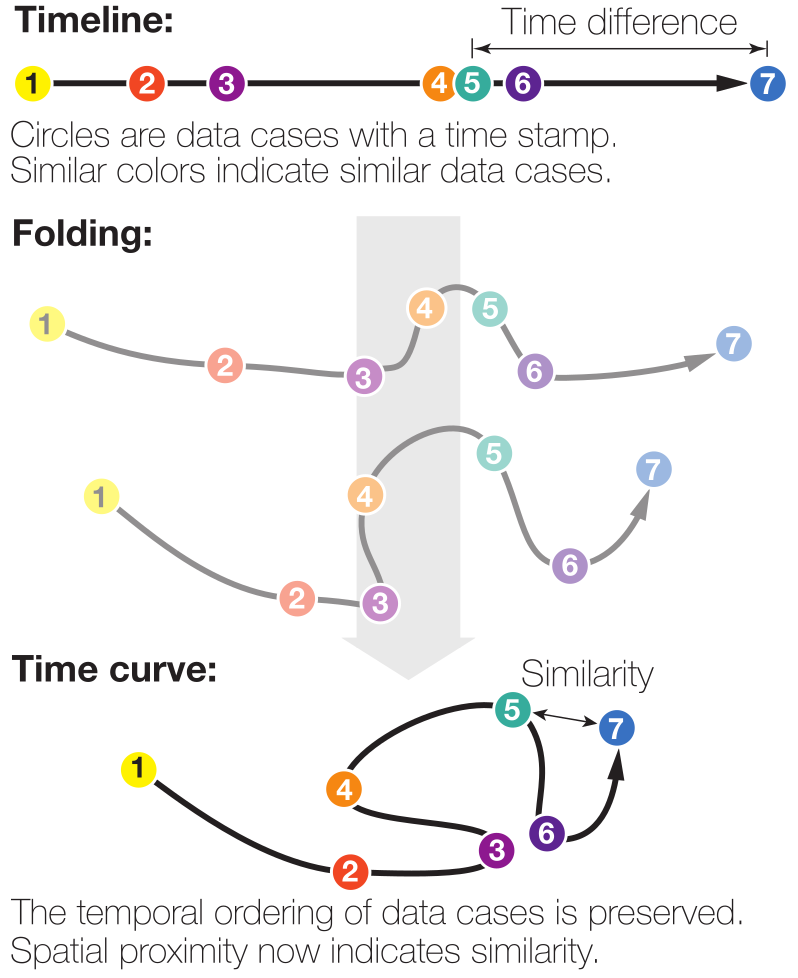
First Step

Apply MDS to the dataset
Second Step
Connect the points in their temporal ordering
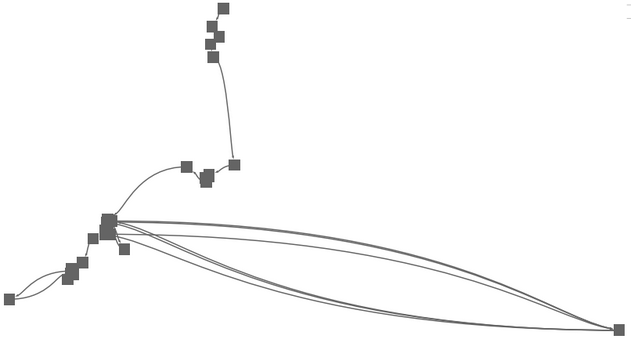
Third Step
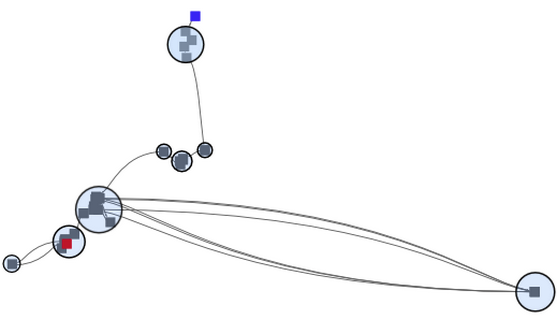
Remove overlaps and color the points
Like Folding a Timeline
Important choices
- Similarity metric
- Dimensionality reduction method, e.g. MDS
- Curve drawing algorithm, e.g. Catmull-Rom
- Extras:
- Remove overlap
- Coloring
- Node size
Applications
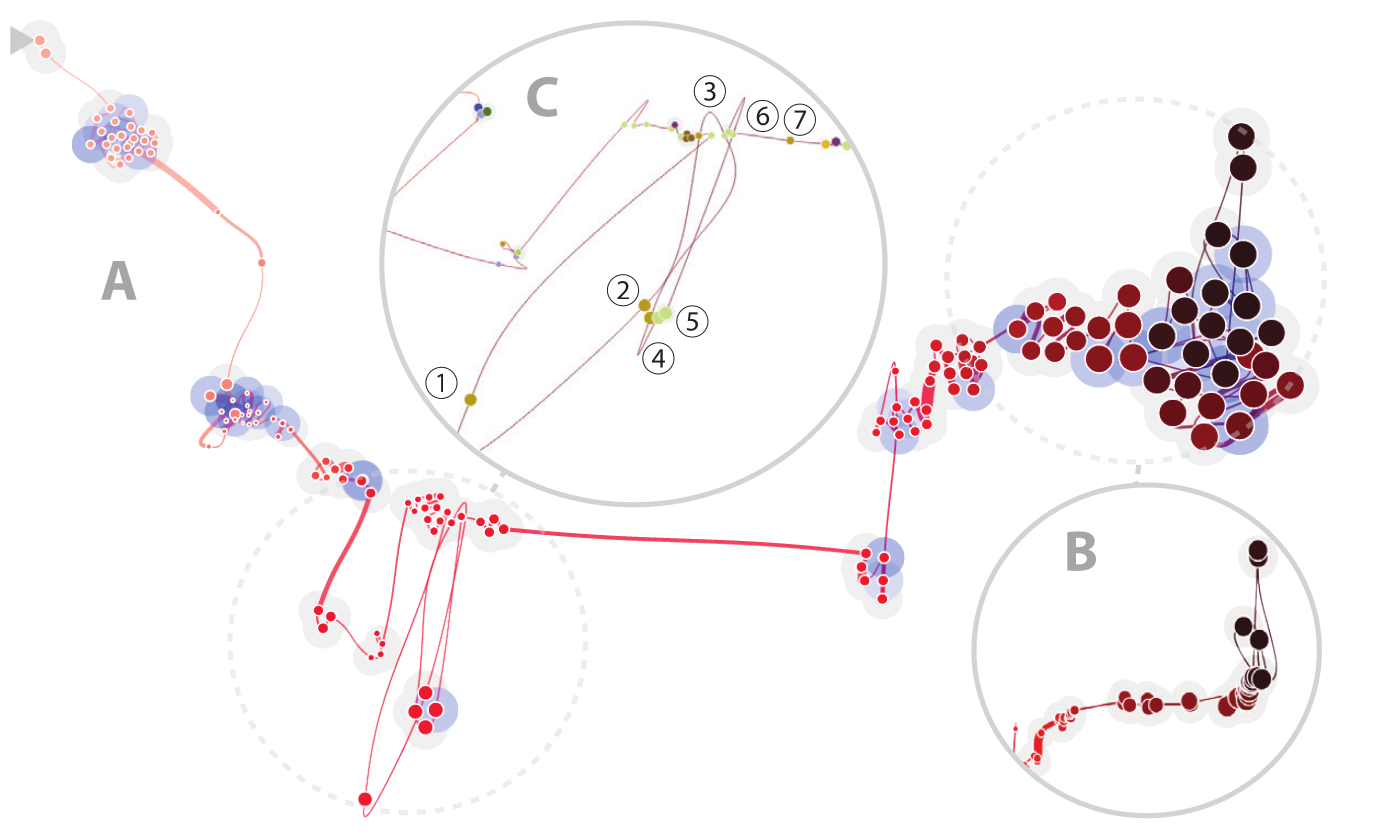
Document Histories
The Wikipedia chocolate page edit war
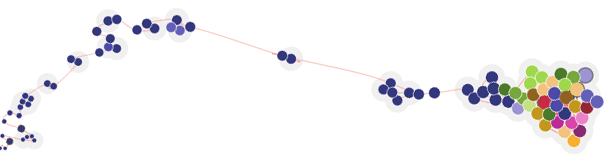
Document Histories
Alternative coloring highlights user groups
Document Histories
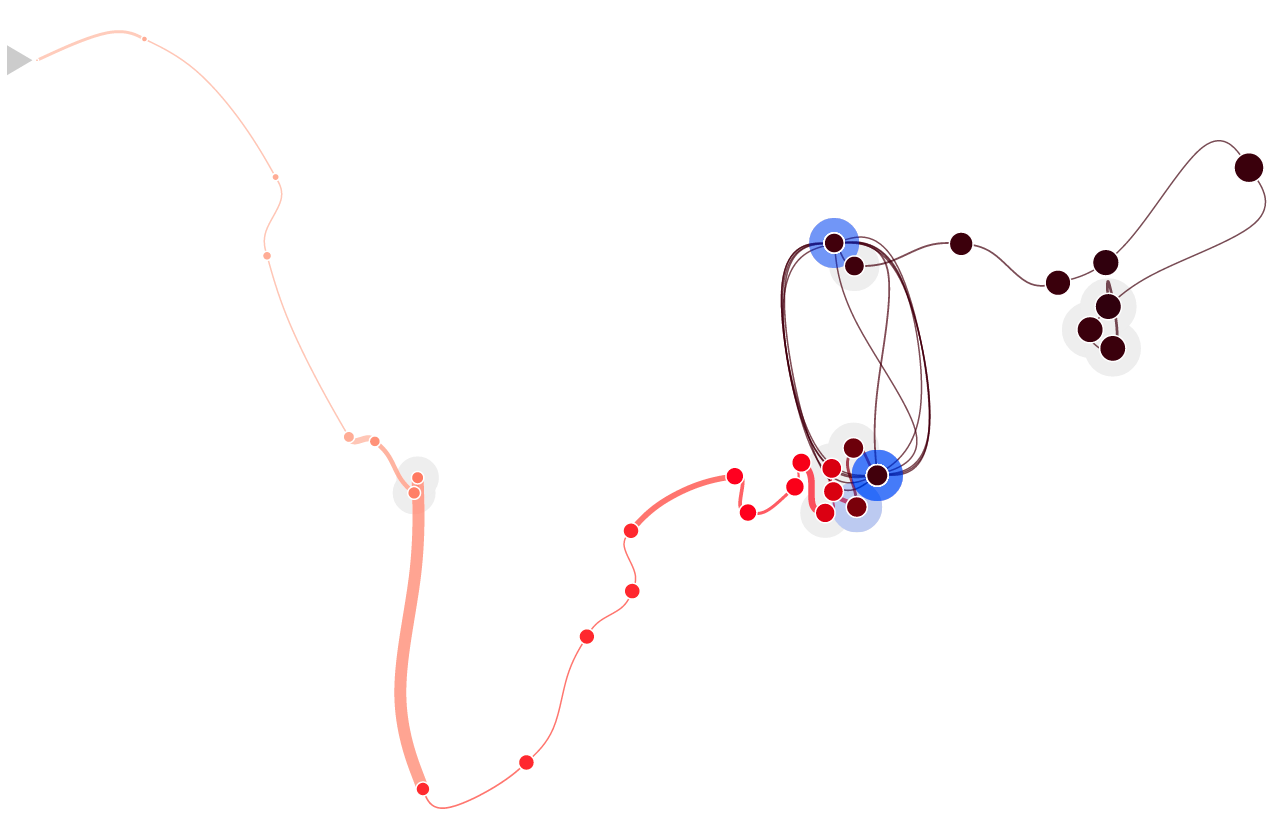
Palestine Wikipedia Page (Caution: 2016)
Document Histories
Vandalism
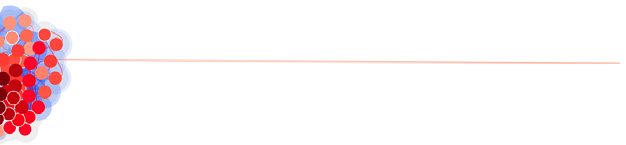
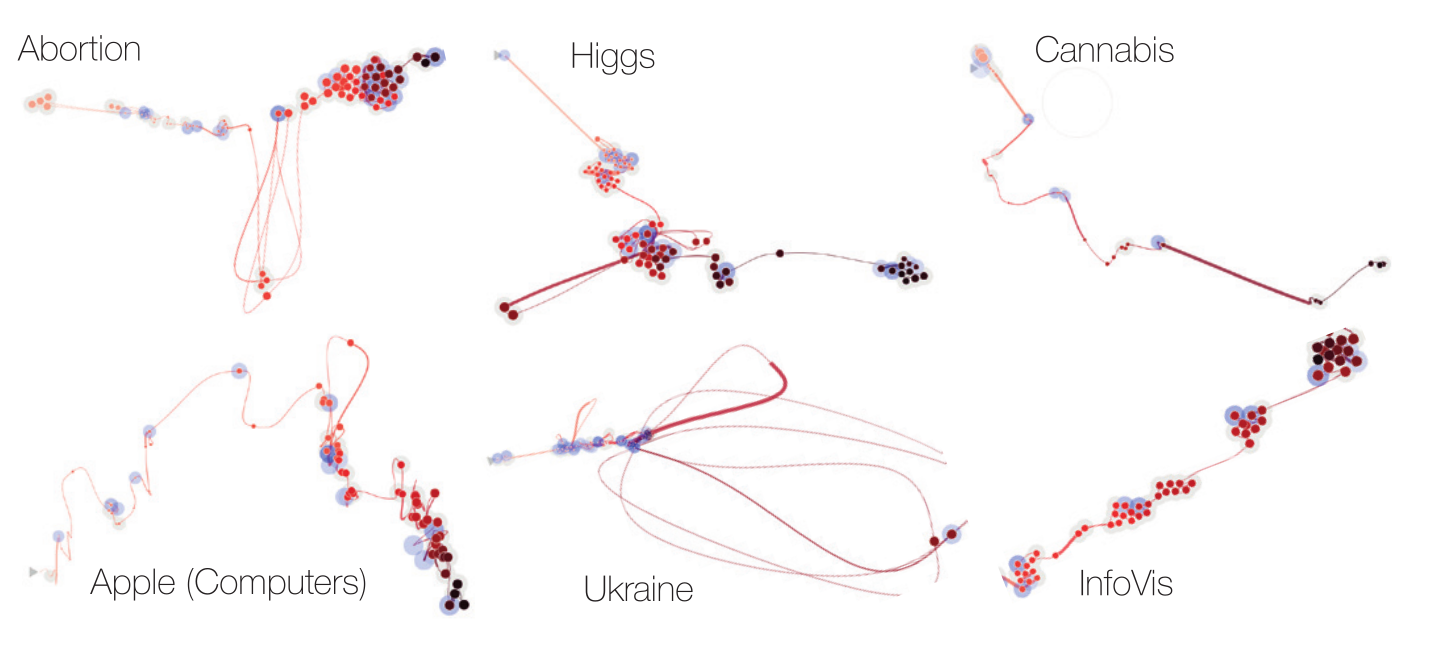
Document Histories
Time Curves as fingerprints
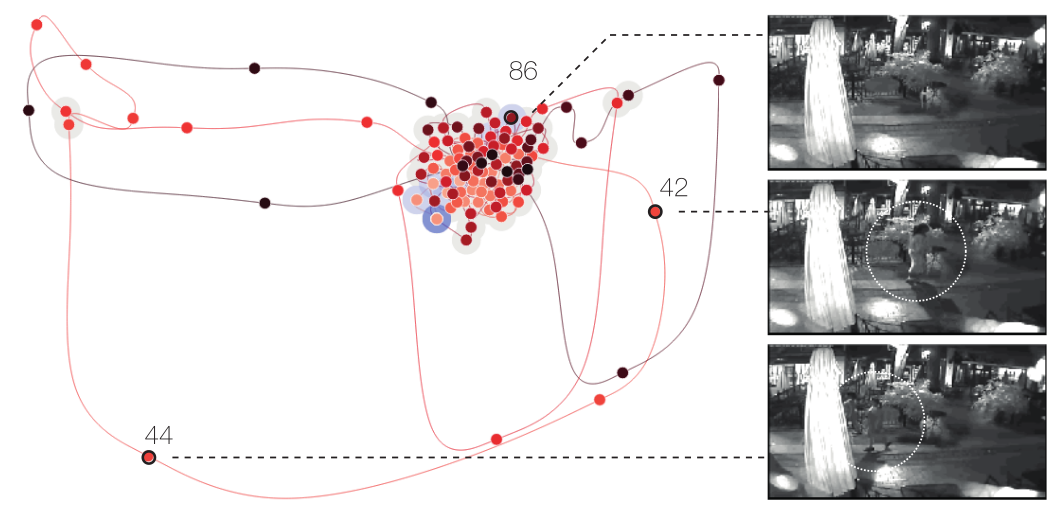
Video Time Curves
Surveillance
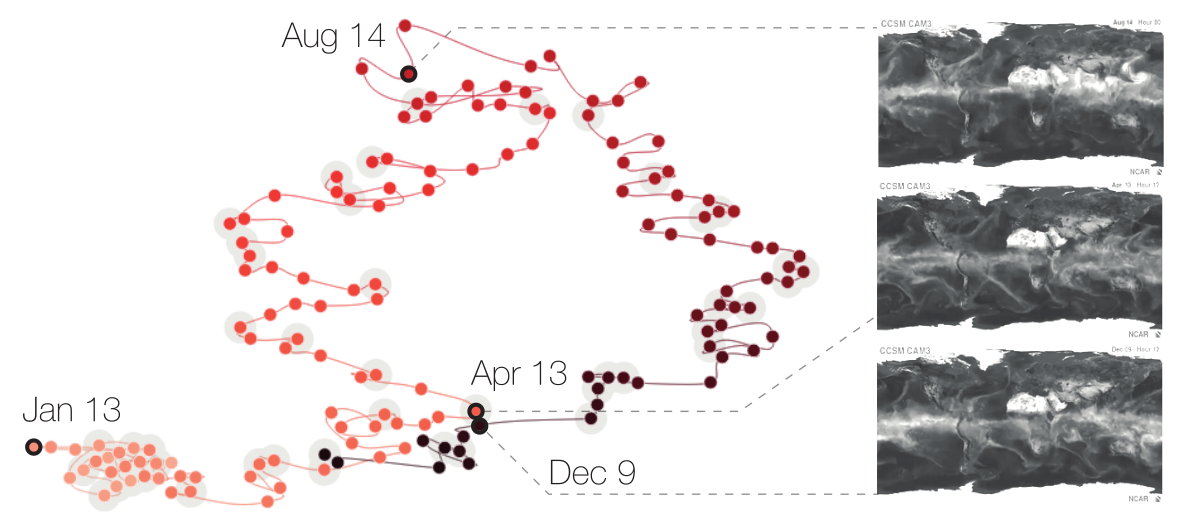
Video Time Curves
Precipitation
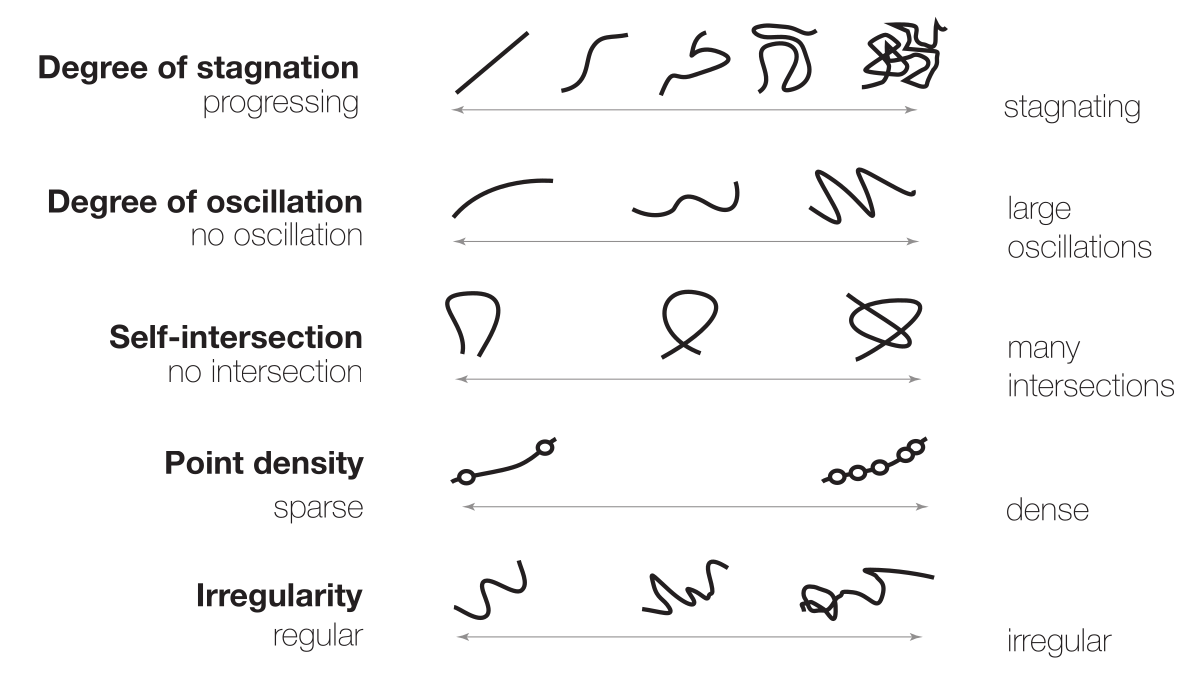
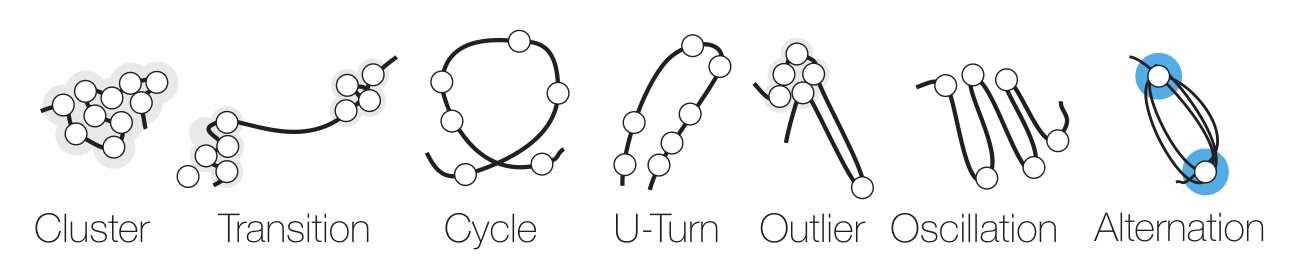
Taxonomy of patterns and characteristics
Limitations
Limitations
- Quantitative aspect of time is lost.
- High dependence on distance metric.
- MDS expensive to compute.
- Curve might not be legible due to high complexity.
- Not resistant to noise.
Why did I choose this paper?
Because it might be relevant for your projects!
- PRESENT
- Hereditary
- A+CHIS
- OpenReassembly: Possible Puzzle Wars?
Can you think of possible use cases?
Could you show an "edit war" in some datasets provided in your projects?