How to read these slides?
 Overview
Click on the menu bar items to navigate to chapters
Click here for PDF version
The PRESENT Project
PhD Talk
Julian Rakuschek
28.01.2025
Agenda
Project PRESENT
PREdictions for Science, Engineering N' Technology
Funded by
FFG Austria
Coordinated by
Fraunhofer Austria
Forecasts and analyses of time series
Research in the field of visual analytics
Goal: A toolbox for tasks in the analysis of time series in three application areas (buildings, health, production)

How does it work?
Industry delivers data and problems
We develop prototypes
Sometimes something useful comes out
A beautiful synergy

The Consortium - Industry Meets Science
Scientific Consortium

Use Case: Production

Use Case: Health

Use Case: Buildings

Ethics and Integration
Our Approach

Design Triangle Approach
S. Miksch et al. "A matter of time: Applying a data-users-tasks design triangle to visual analytics of time-oriented data" Comput. Graph. 38 (2014): 286-290
Our Time Series Sources

Medical

Production

Facility
Time Series Tasks
Forecasting
Anomaly Detection
Drift Detection
Classification
Segmentation

Vibration Analysis
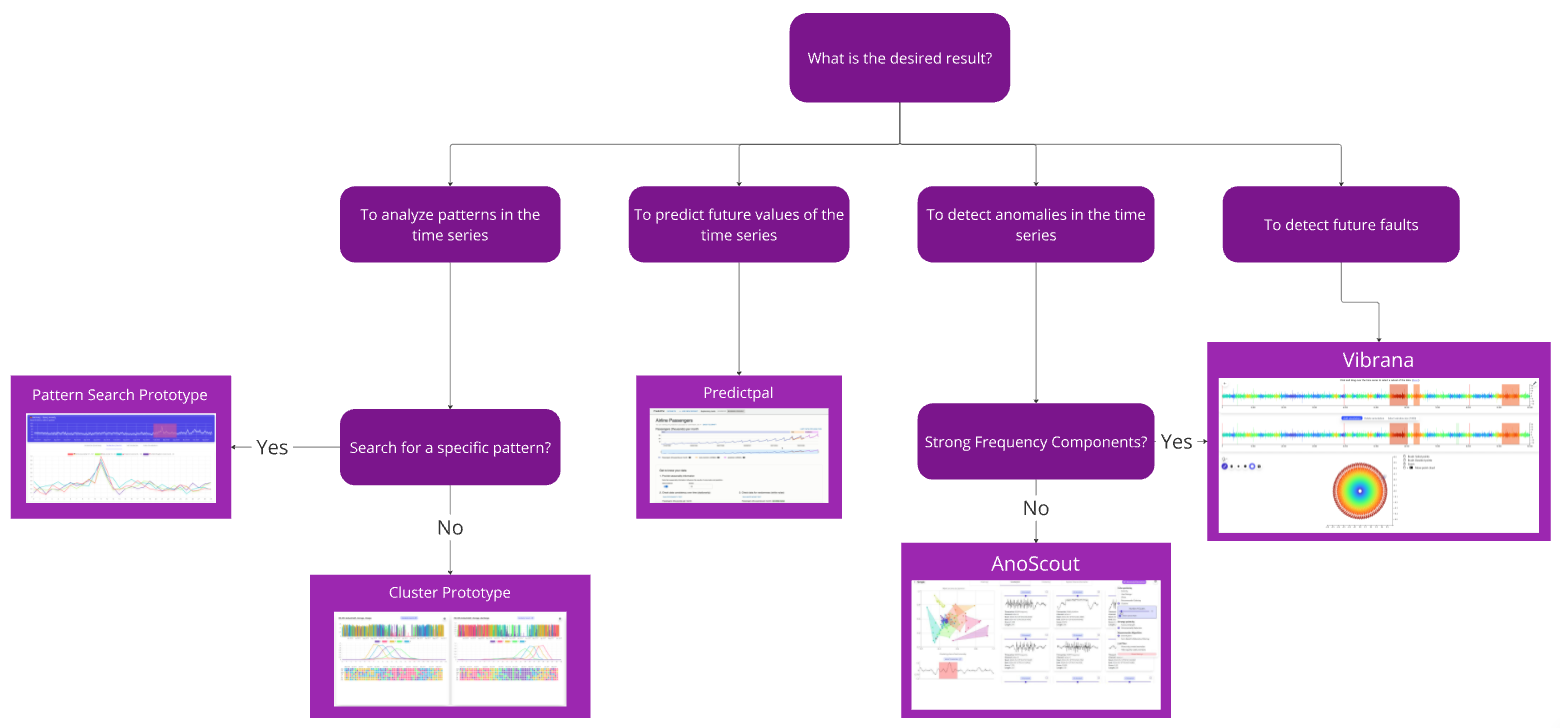
Goal: A Tool-Driven Decision Tree
Summary - What do we do?
-
Our Data Domains
- Production
- Building Management
- Healthcare
-
Our Research Targets
- Statistical and AI-based Methods
- Interactive Data Visualization
-
Results
- Decision Tree for Method Selection
- Toolbox for Visualizations
- Happy industry partners :)
Vibrana
Analysing Vibrations with Style
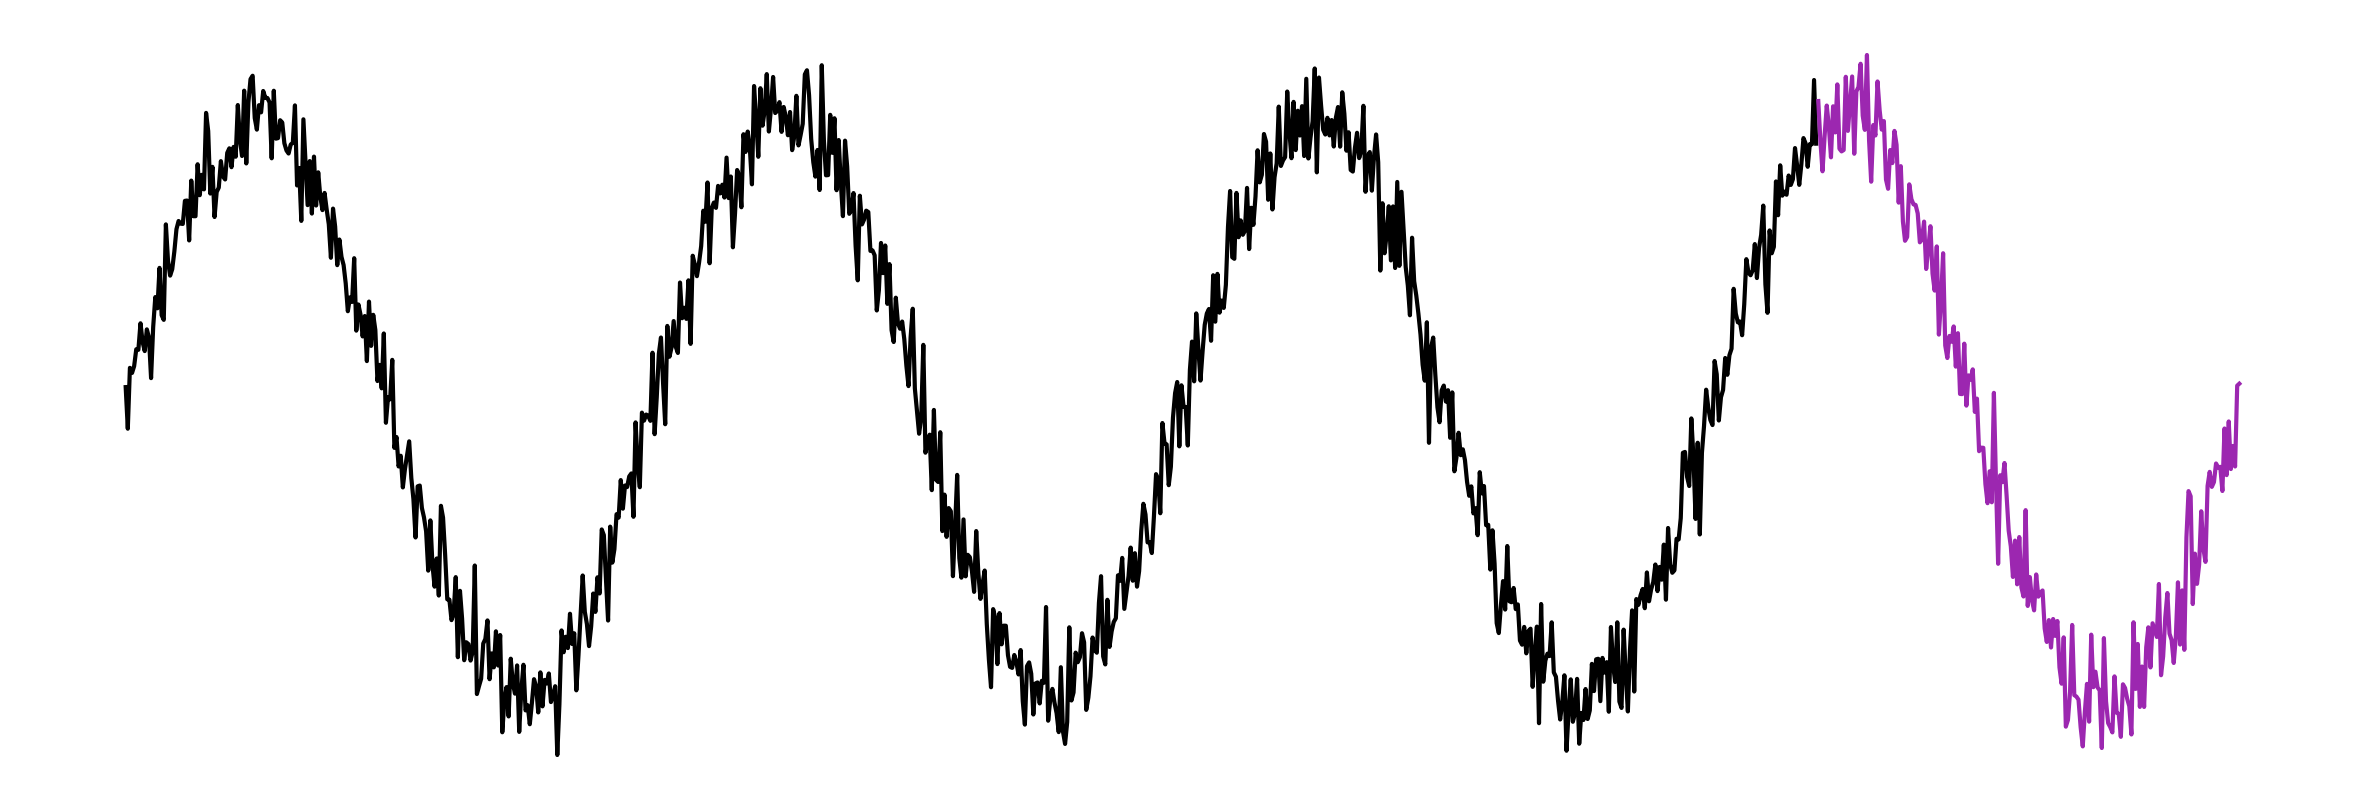
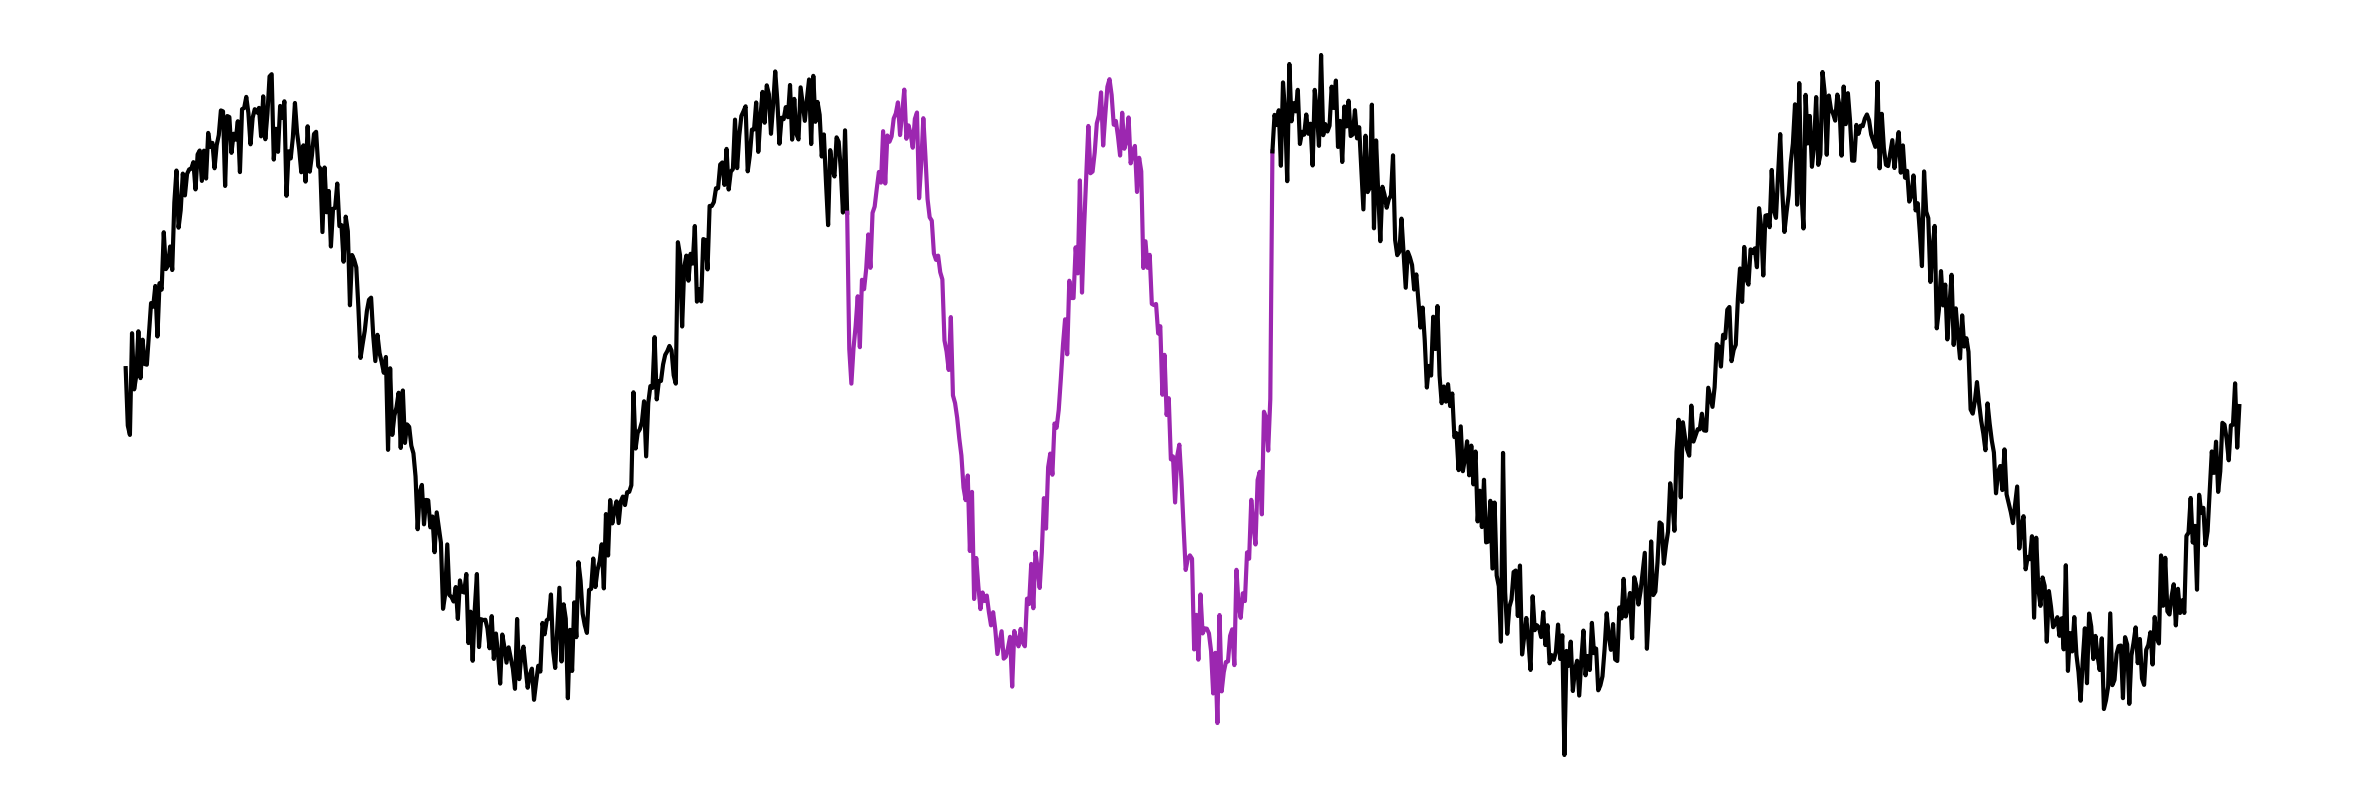
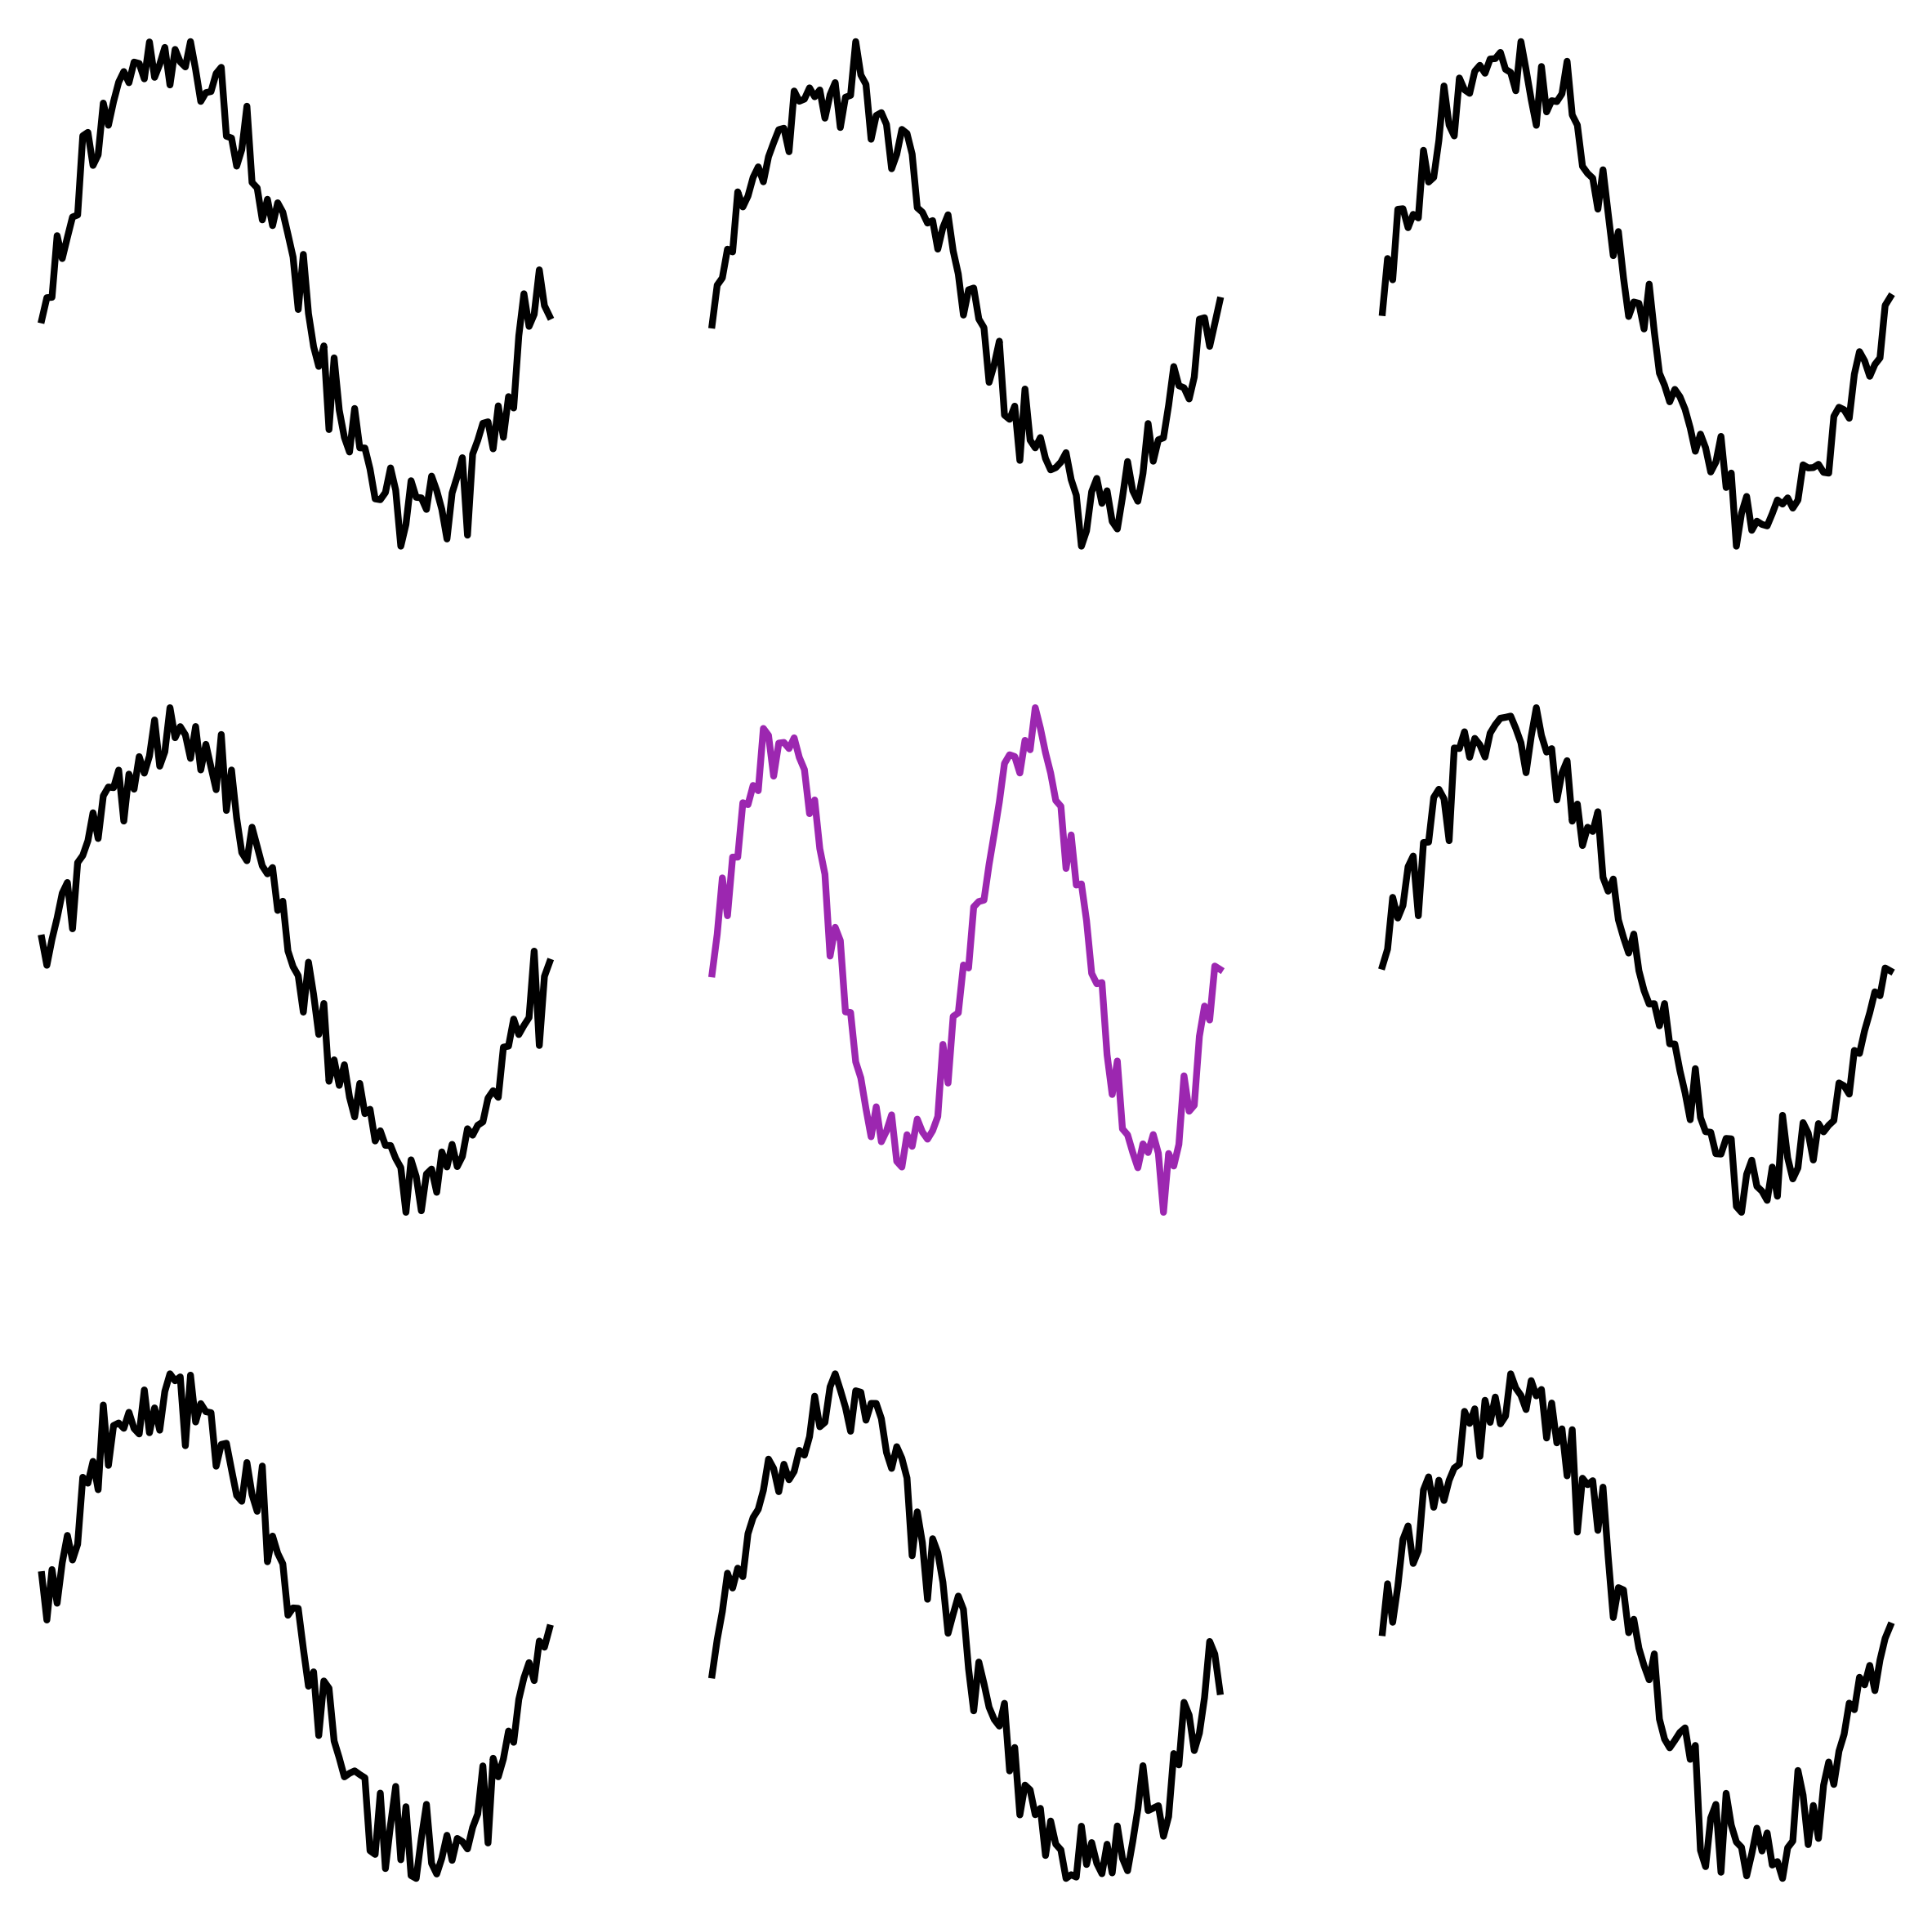
The Problem with Vibrations
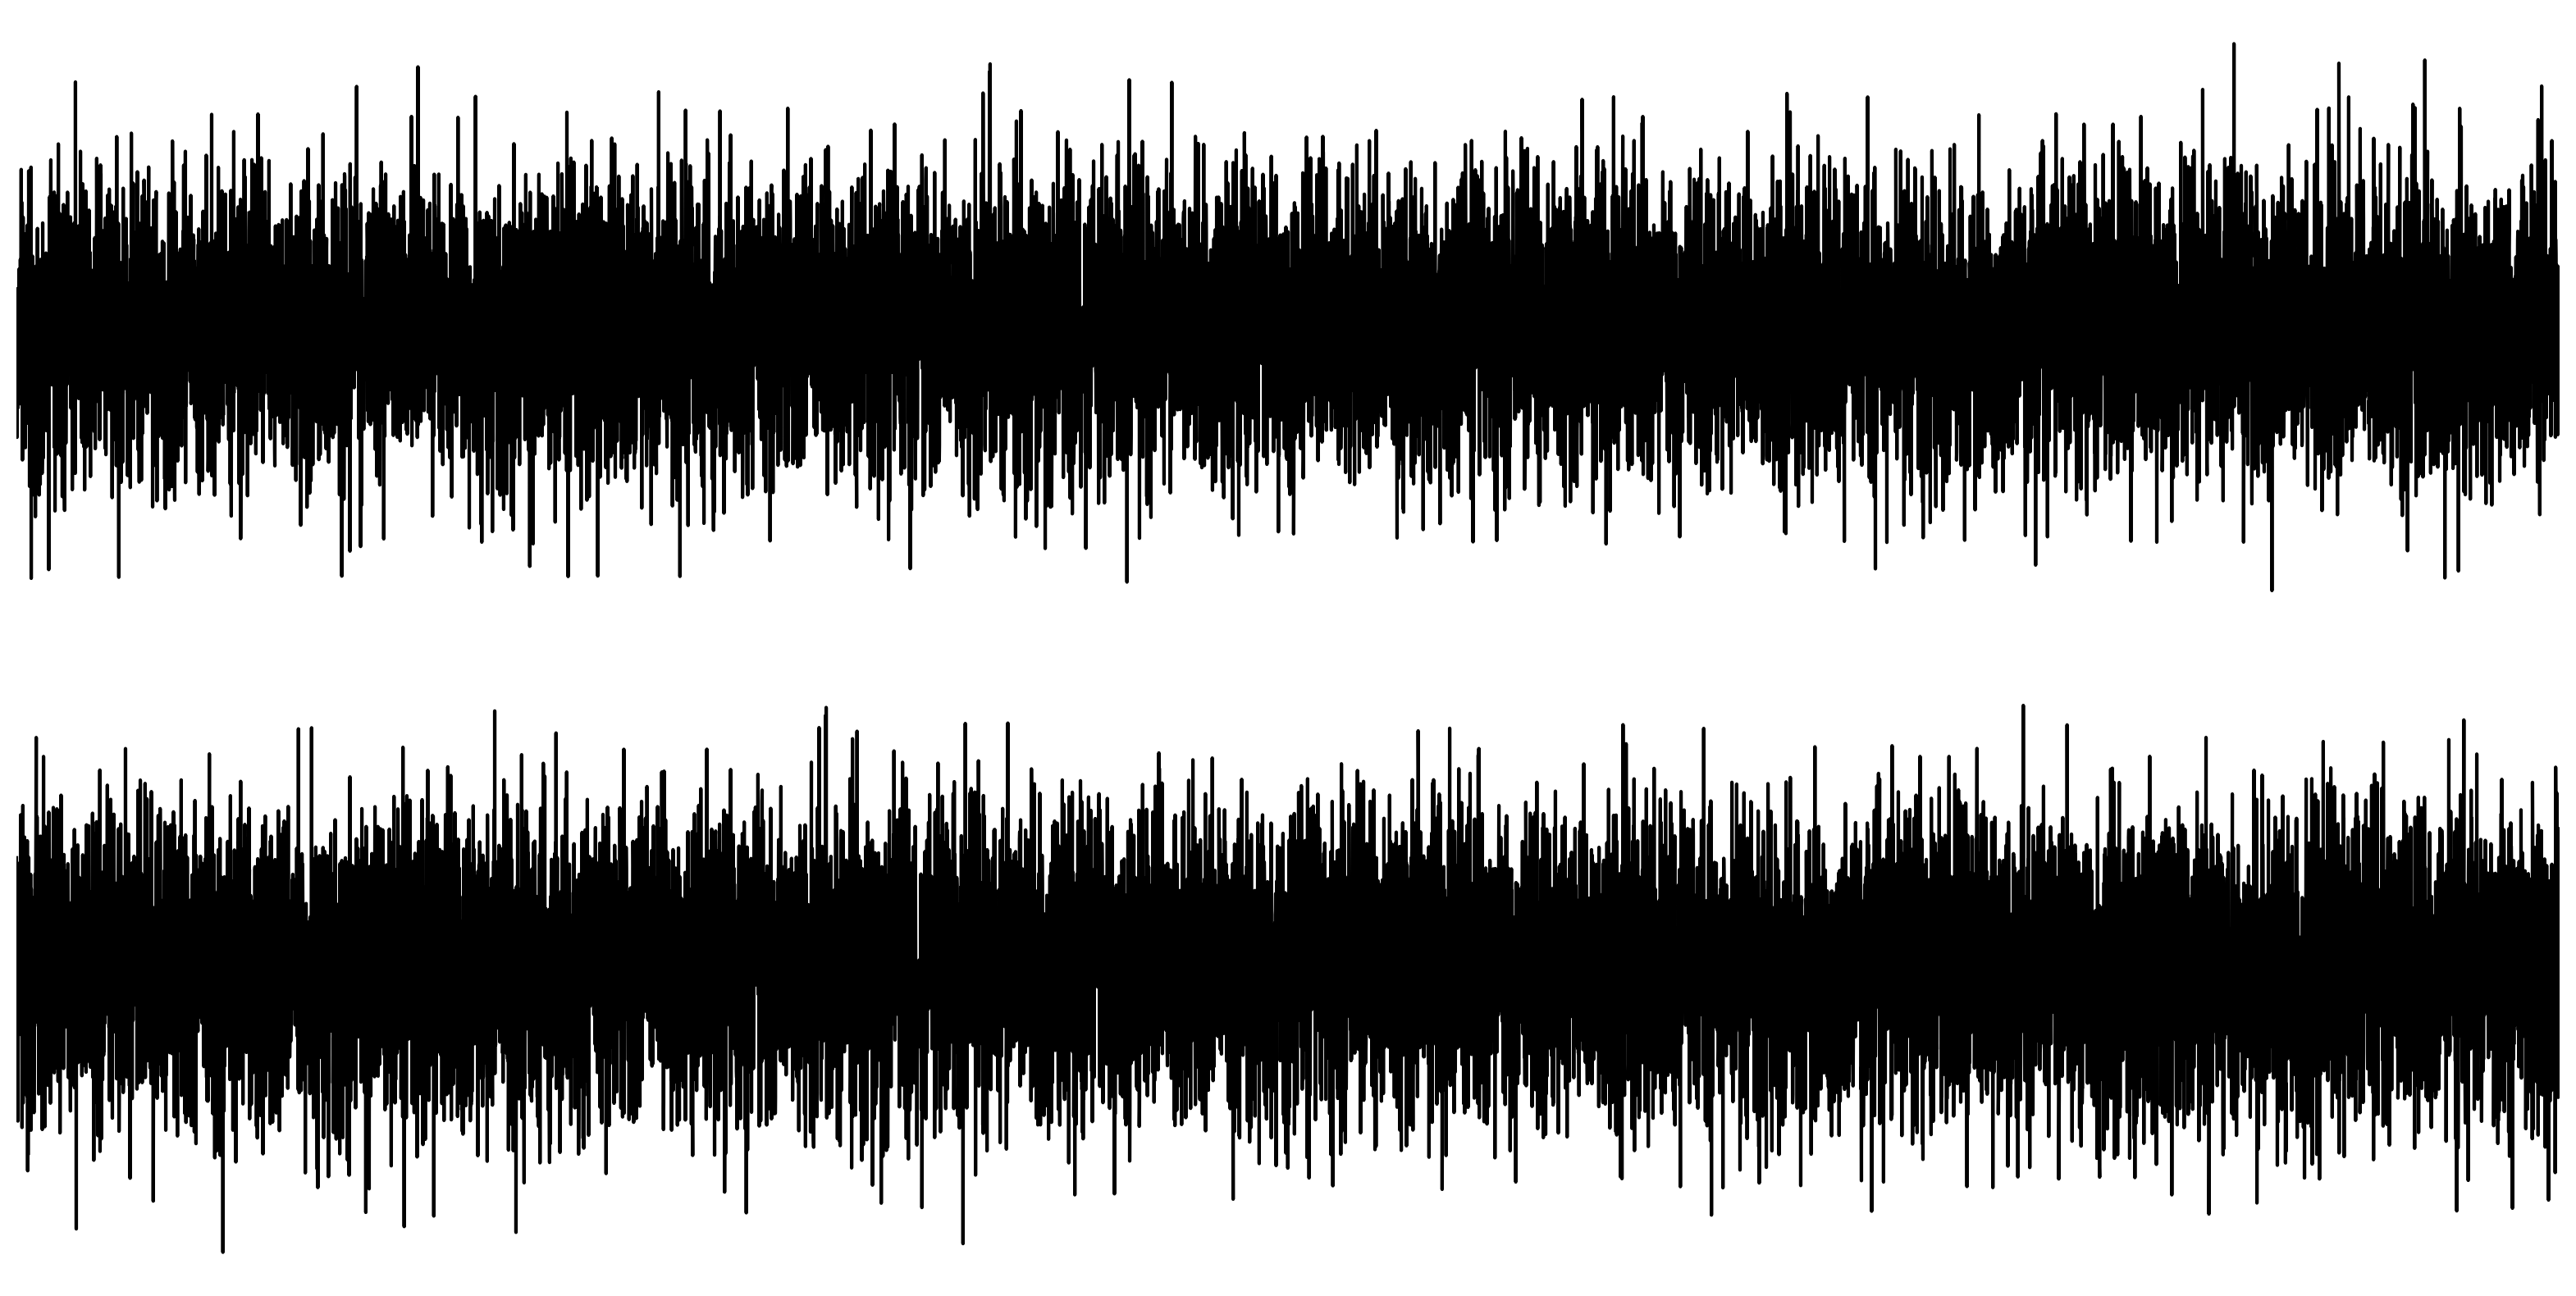
Can you tell the difference?
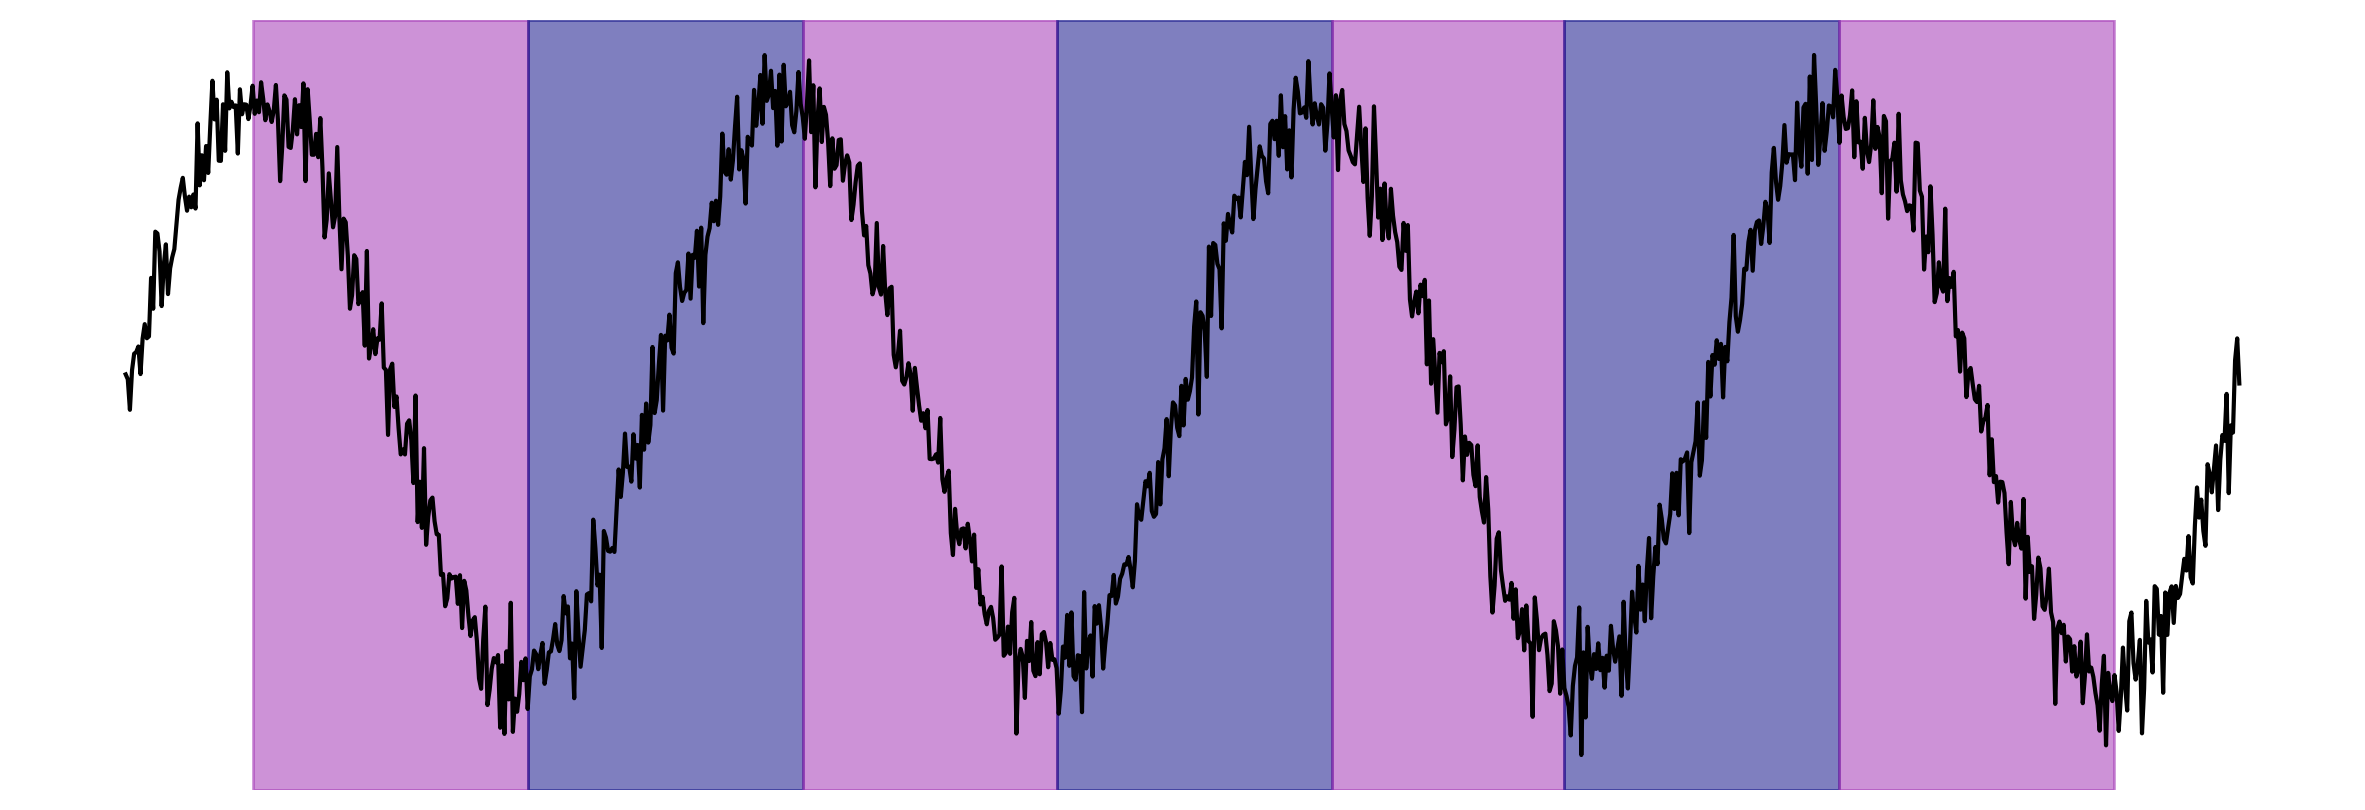
A hidden signal
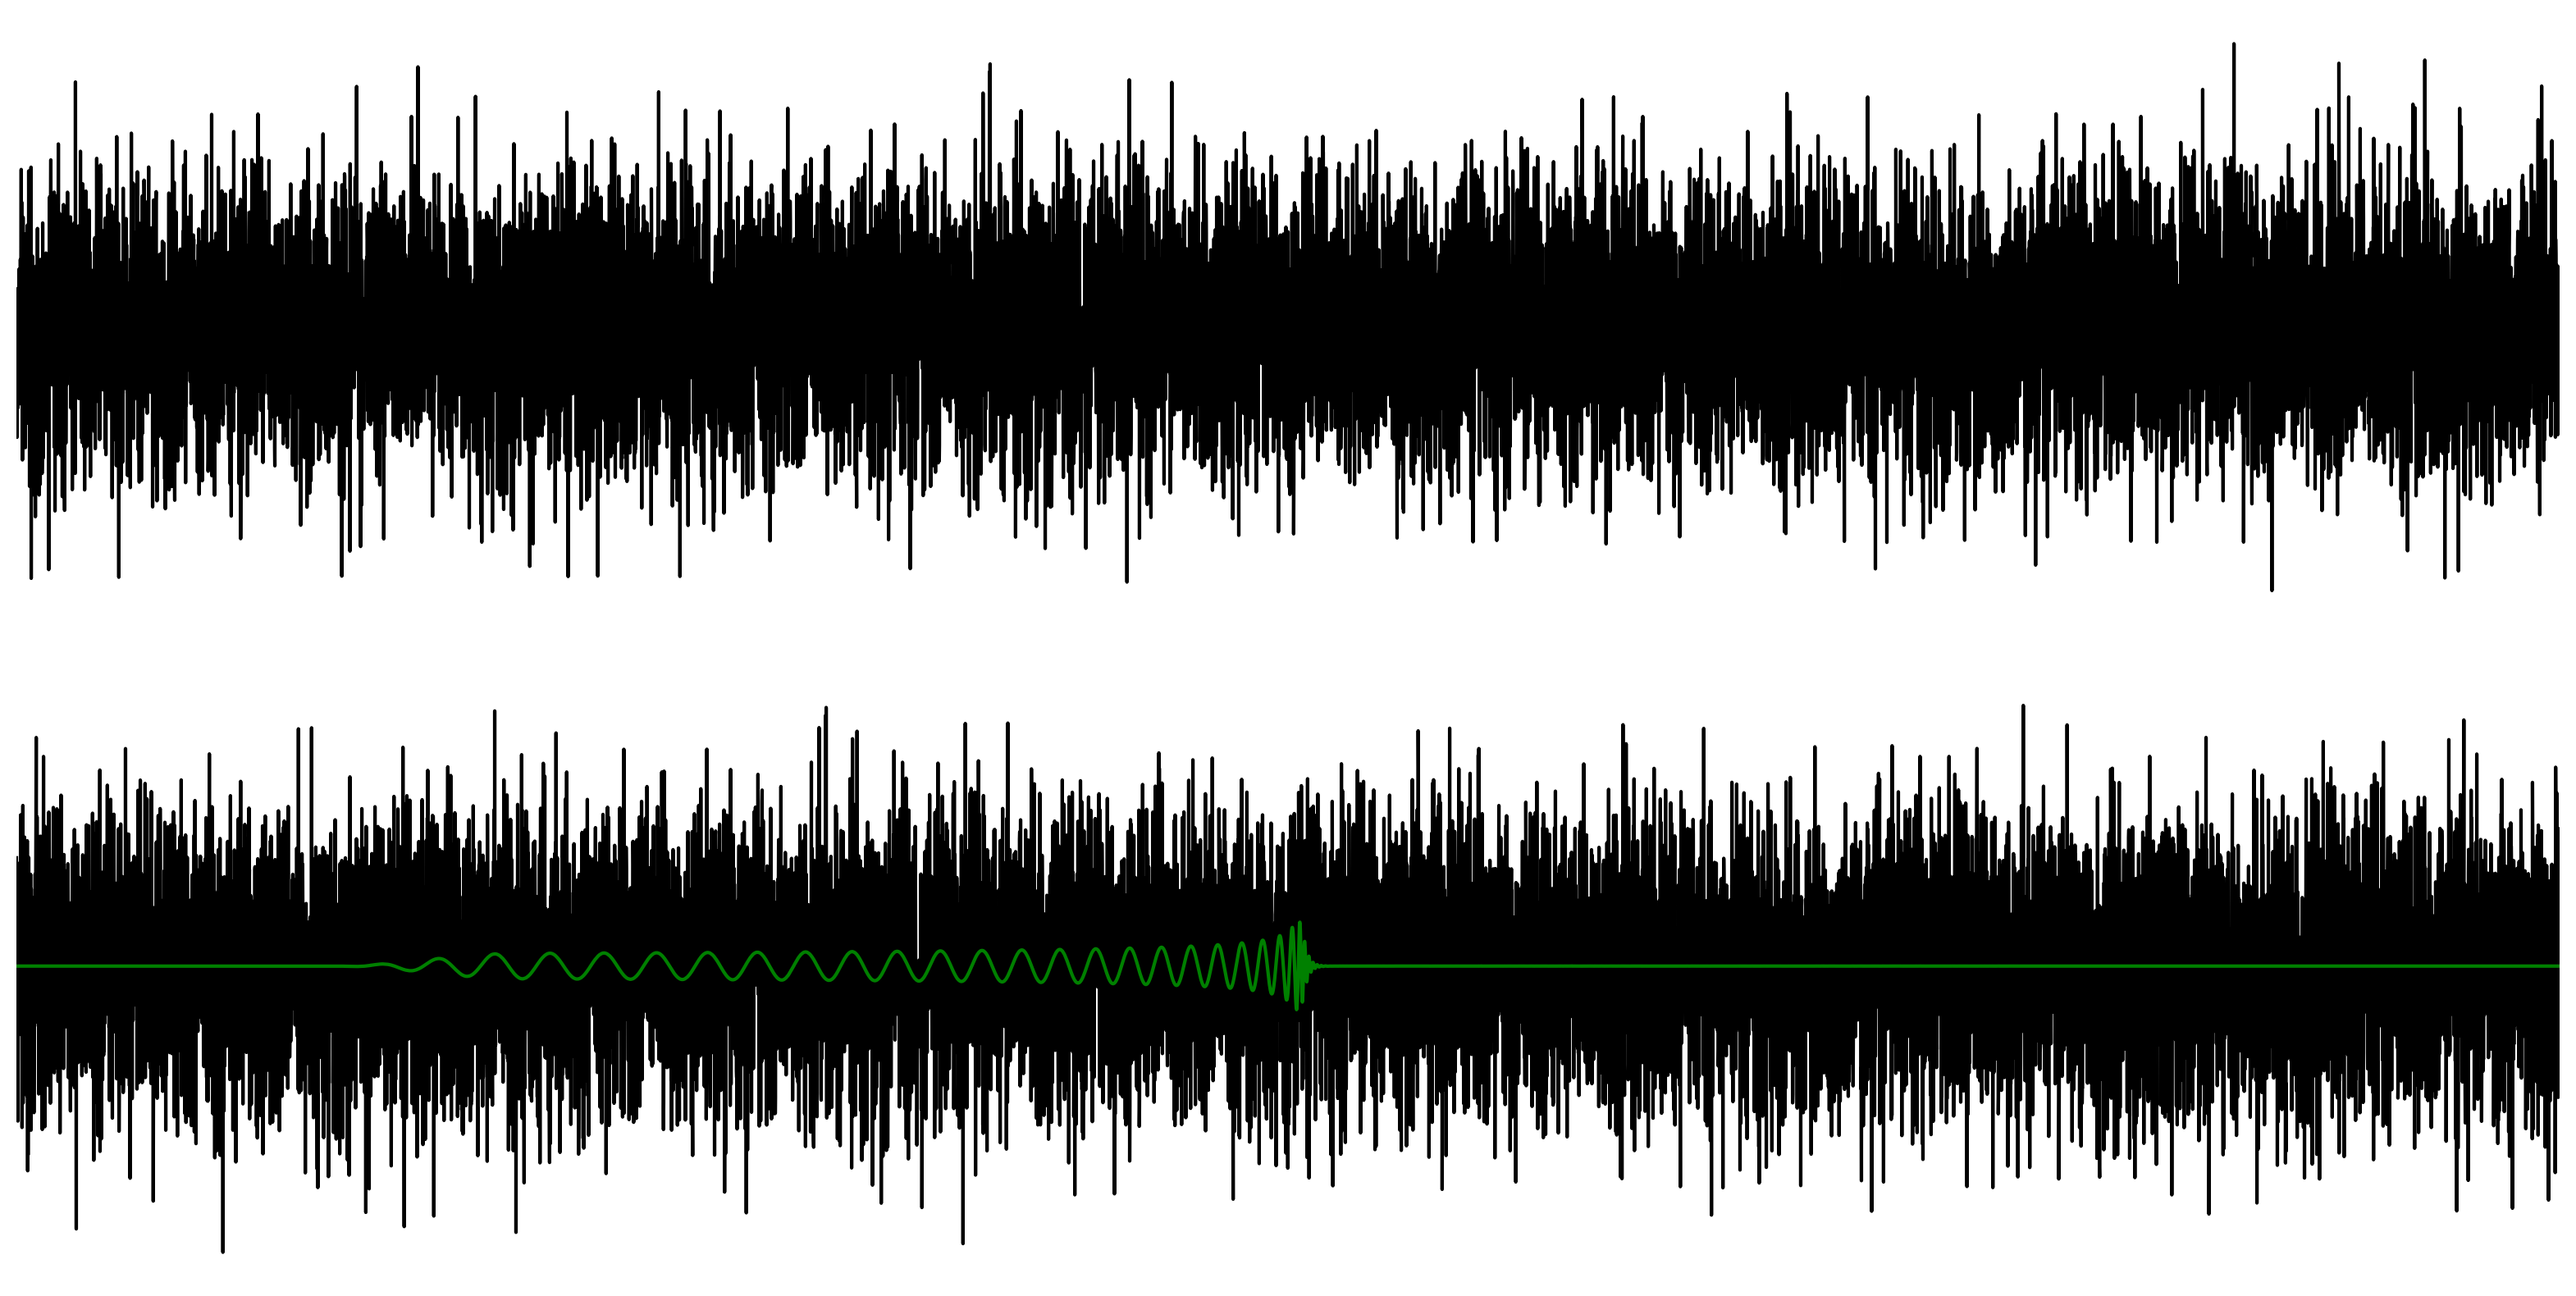
You cannot see the hidden signal with a line chart.
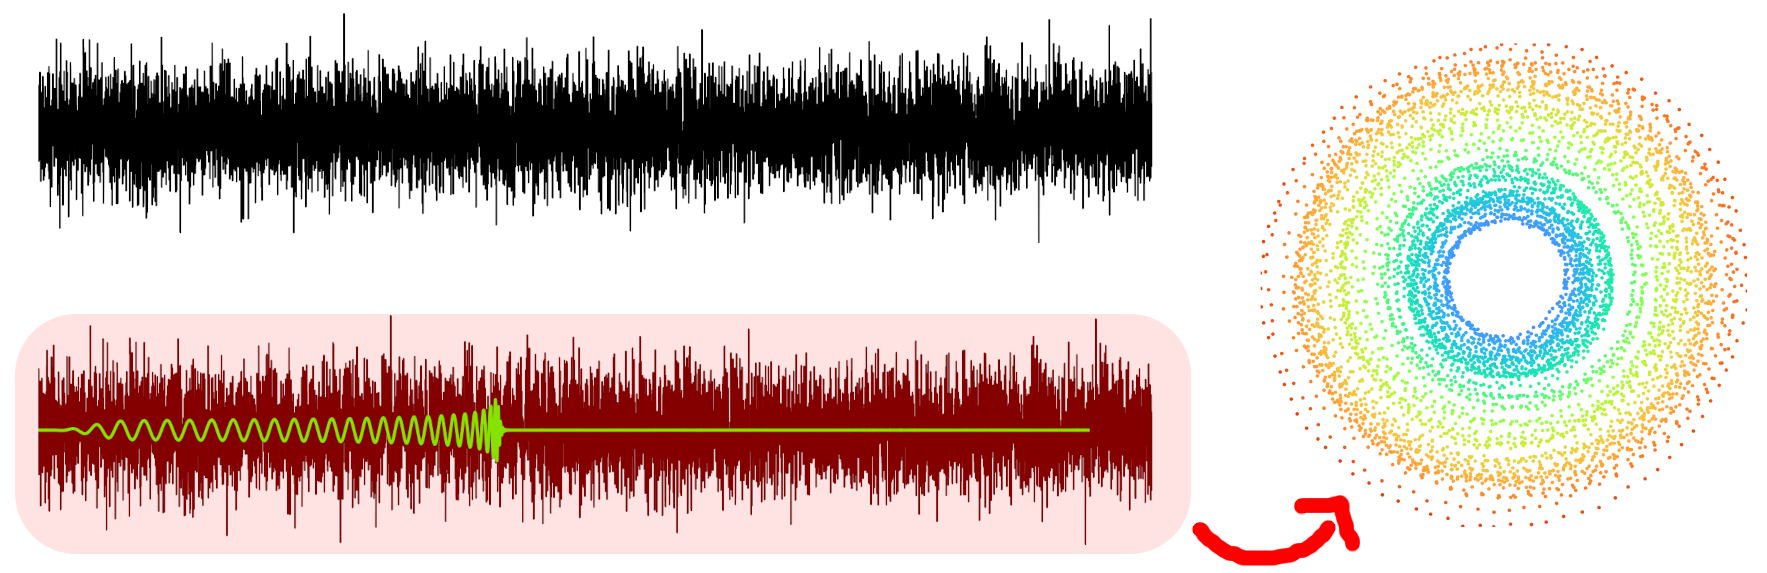
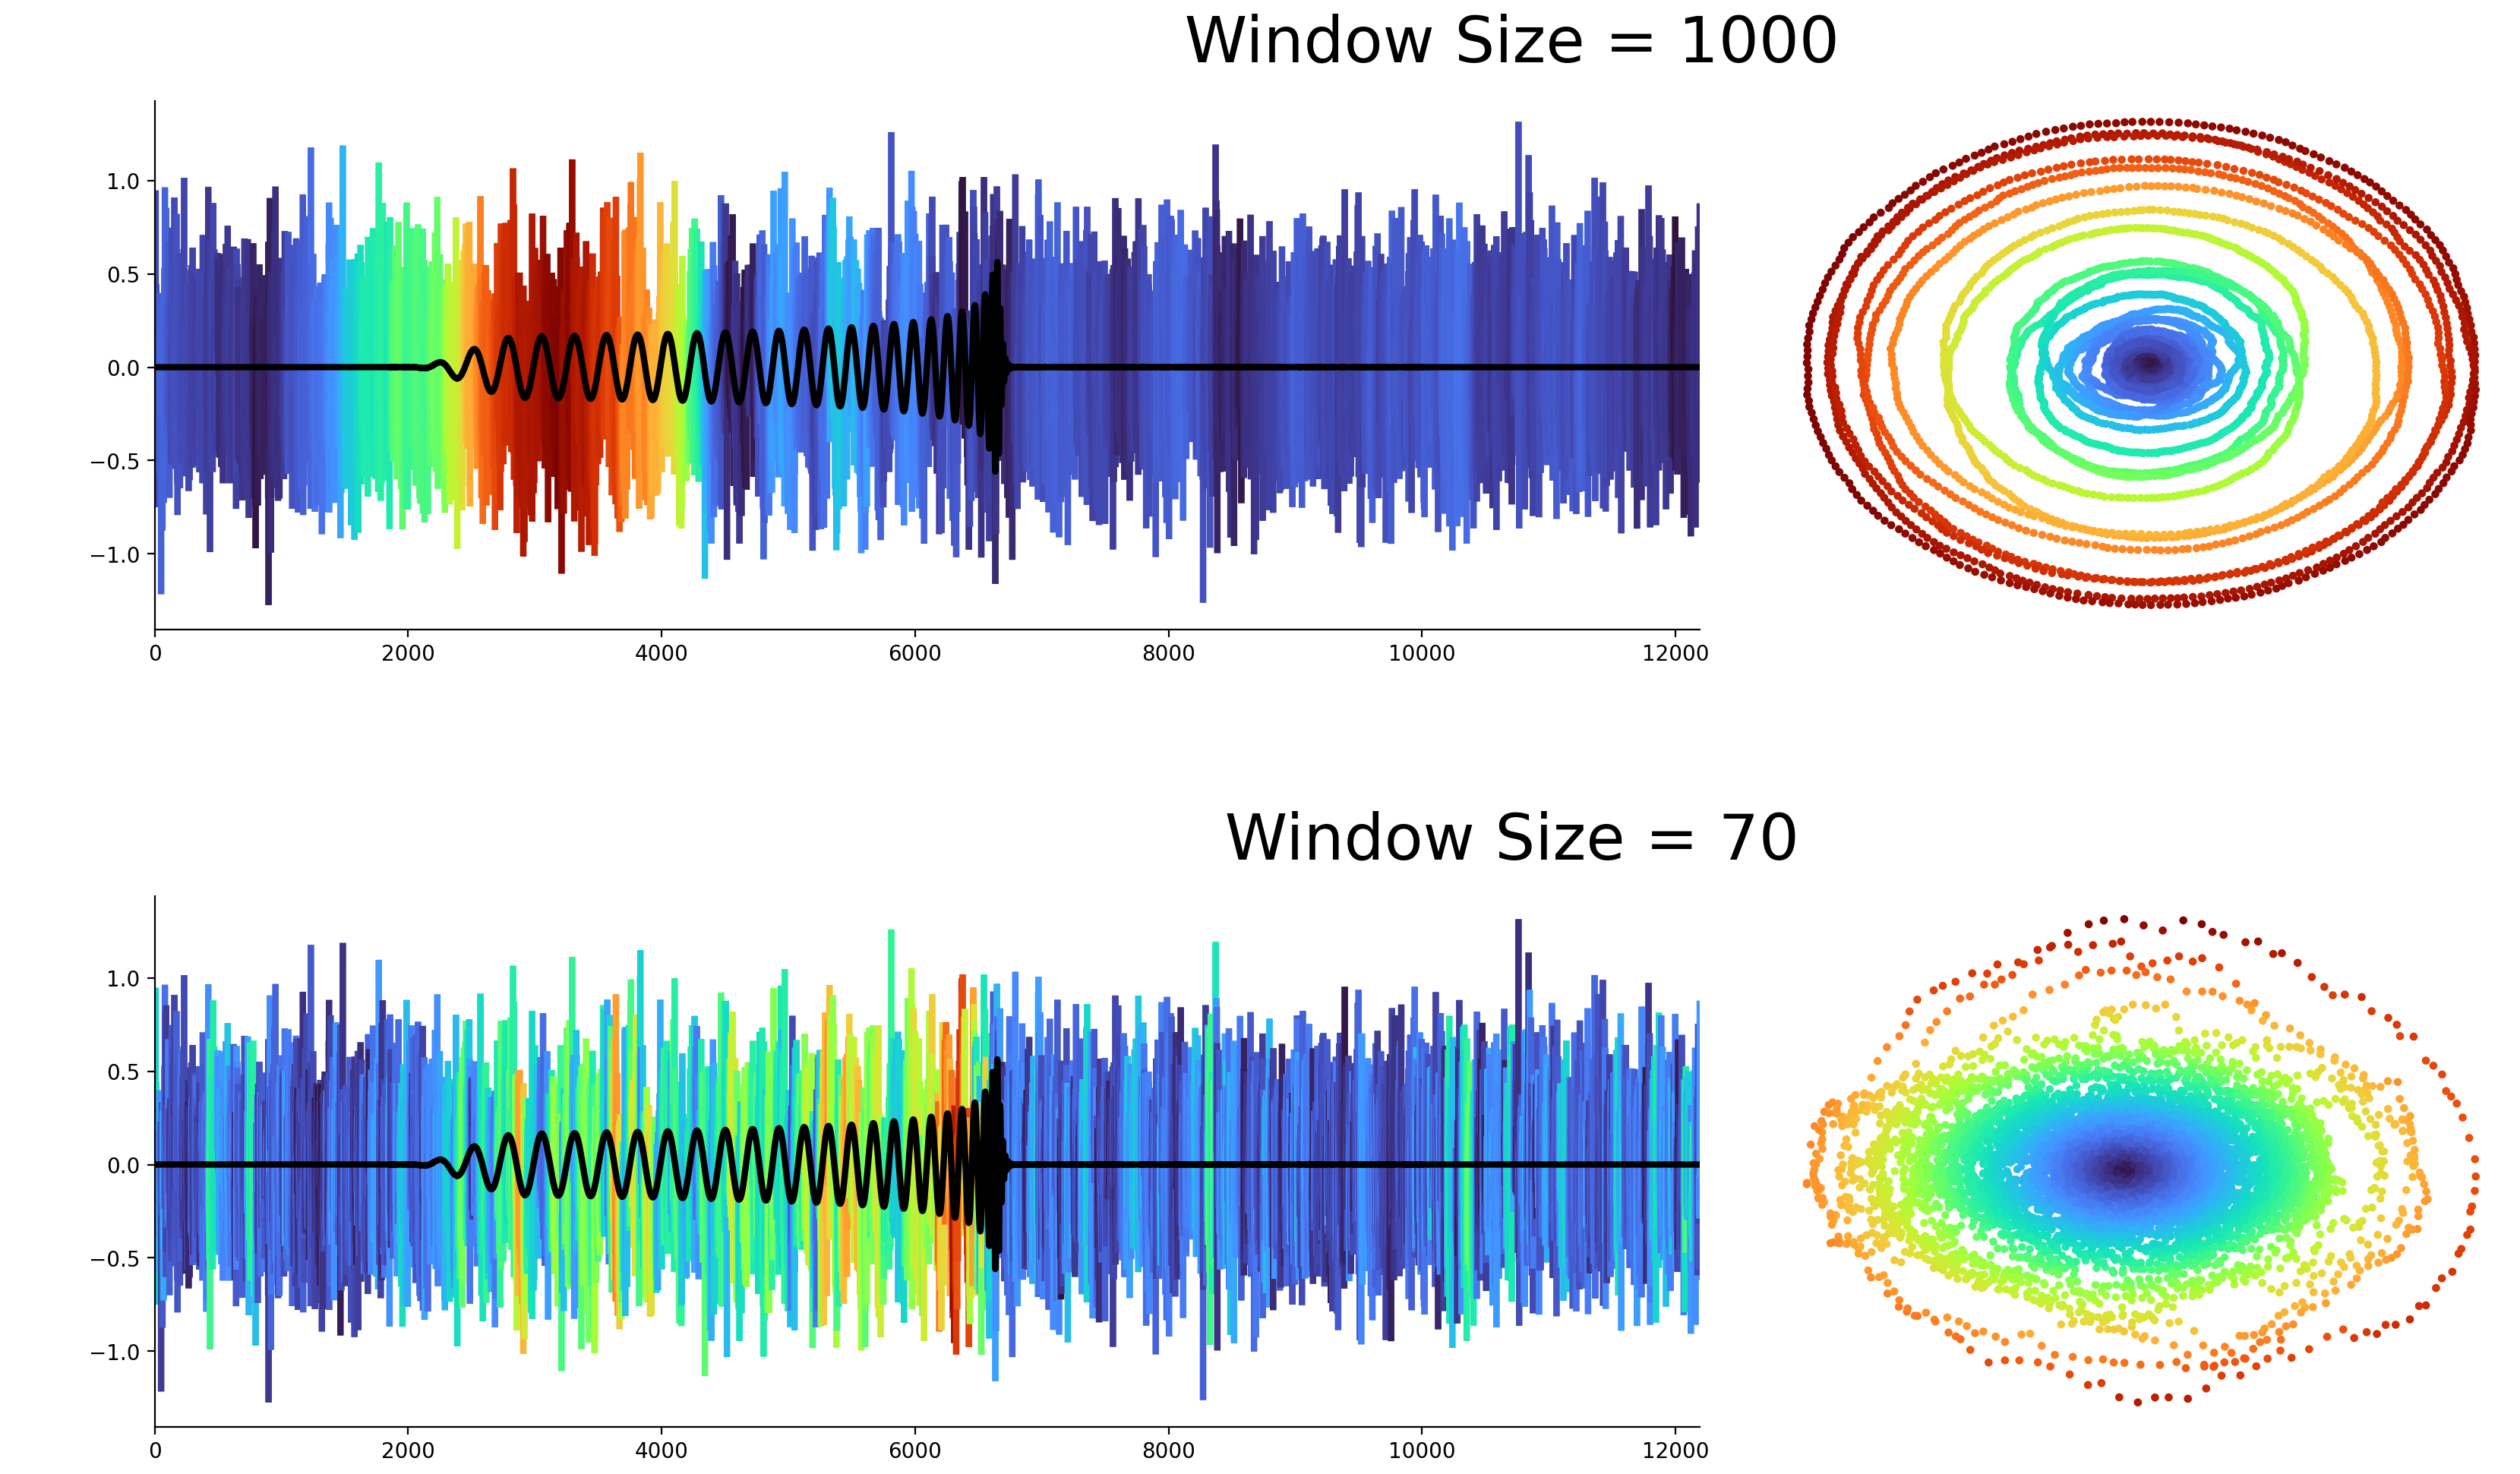
The Idea: Vibration $\rightarrow$ Point Cloud
The Time Delay Embedding
Only two lines of code!
windows = sliding_window_view(values, window_shape=window_size)
projected = PCA(n_components=2).fit_transform(windows)
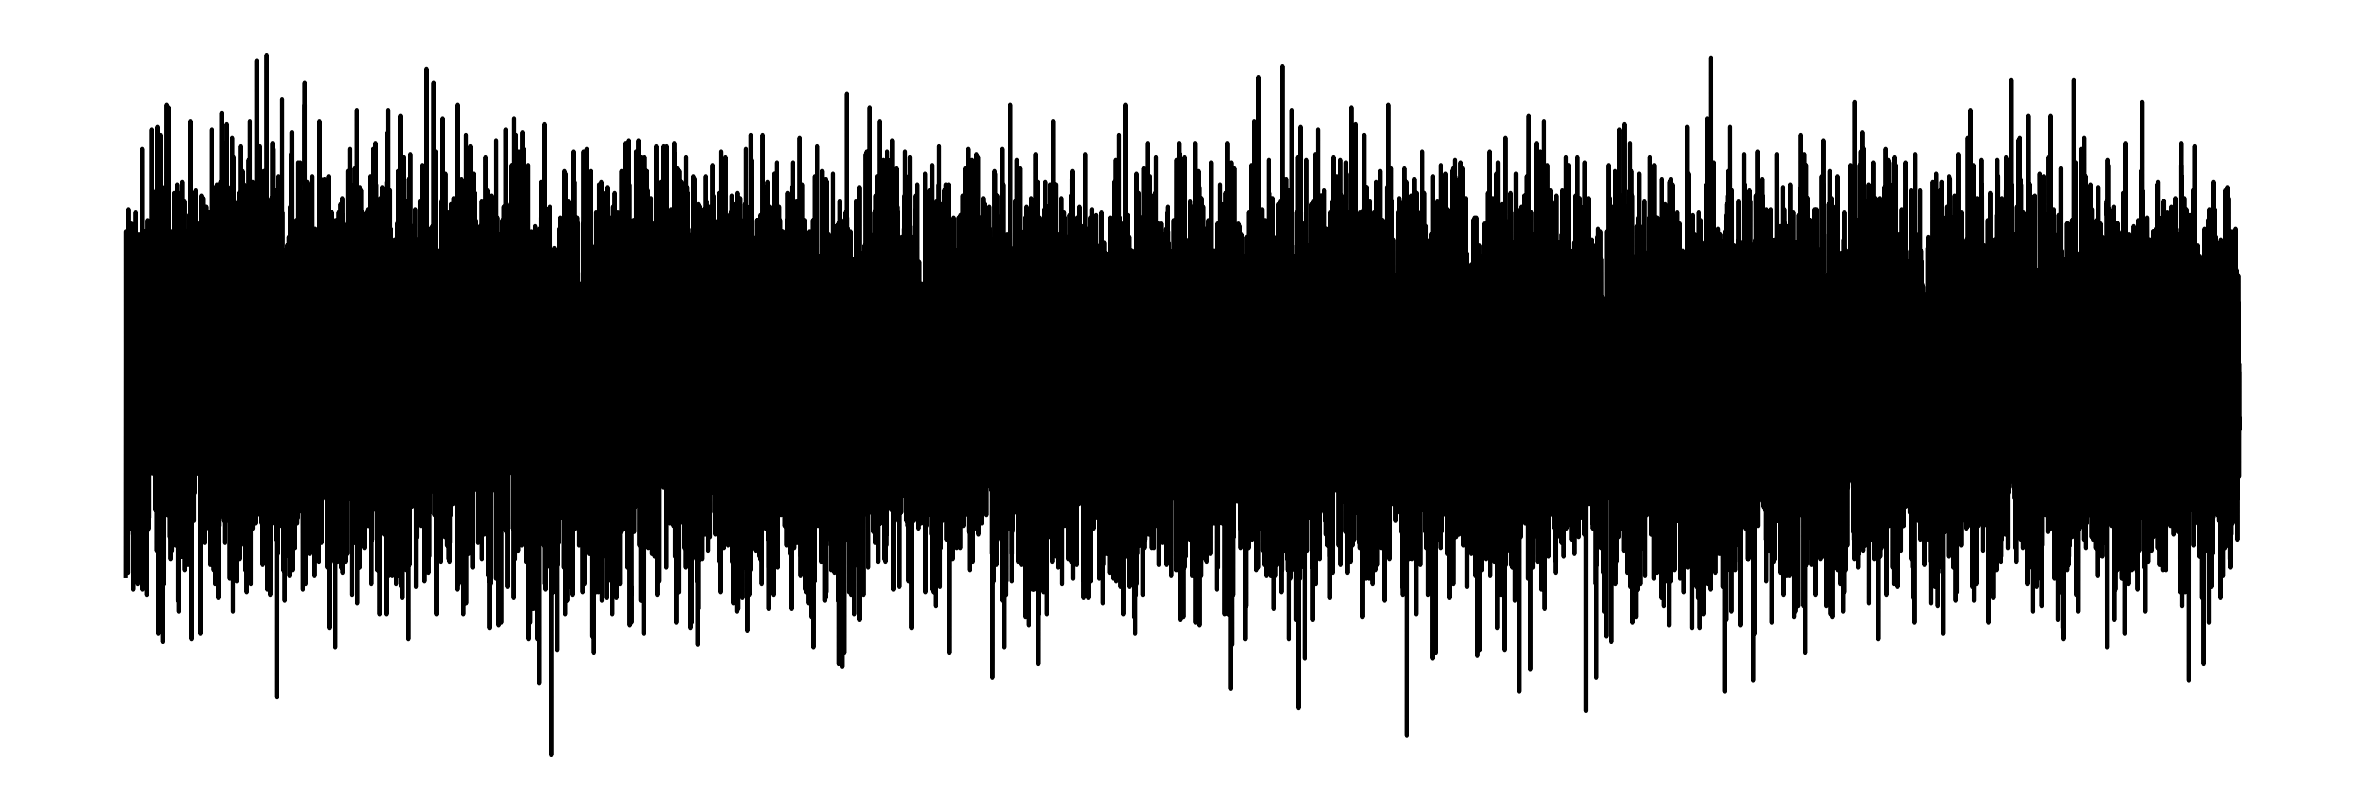
Noise is not exciting ...
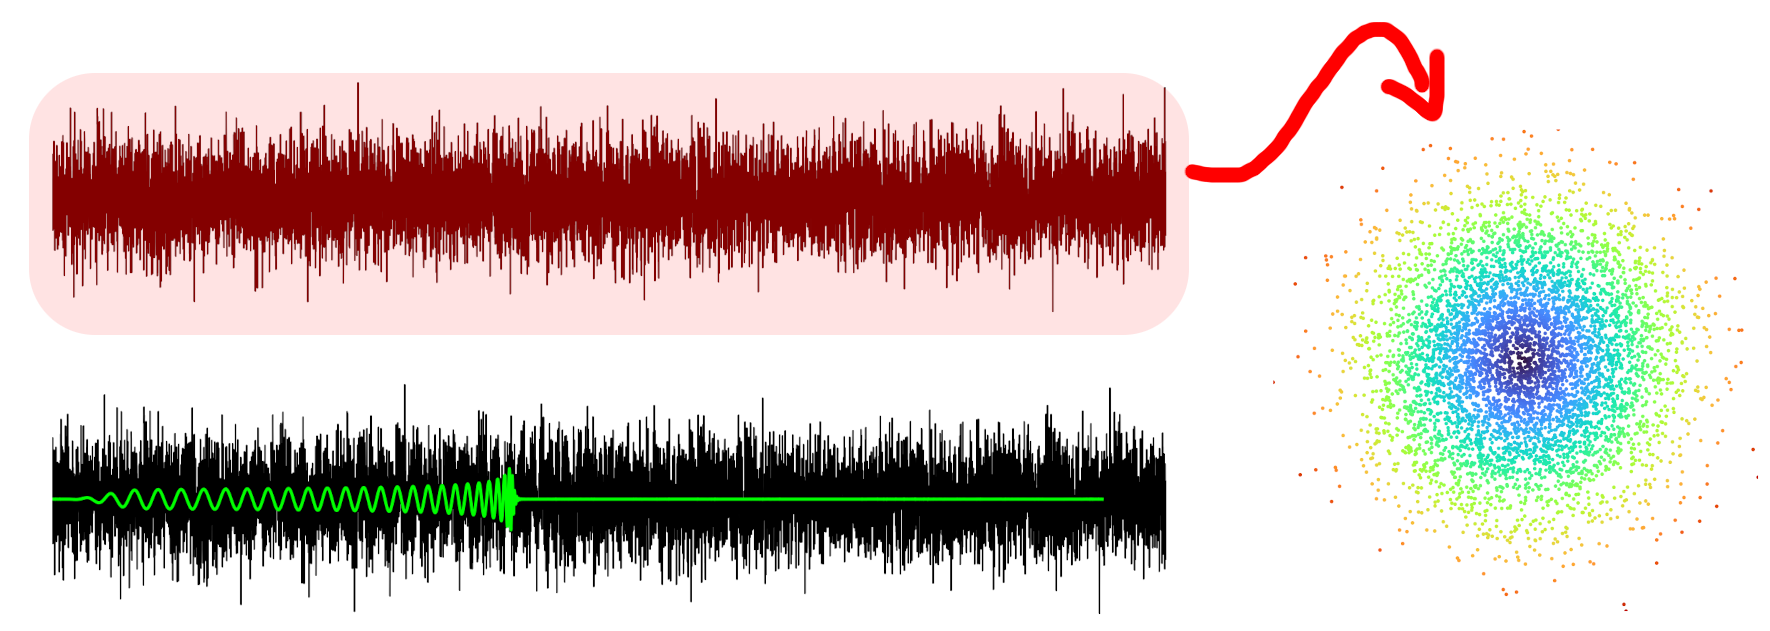
... but oscillations result in circles!
The effect of the window size
Grounded in Theory
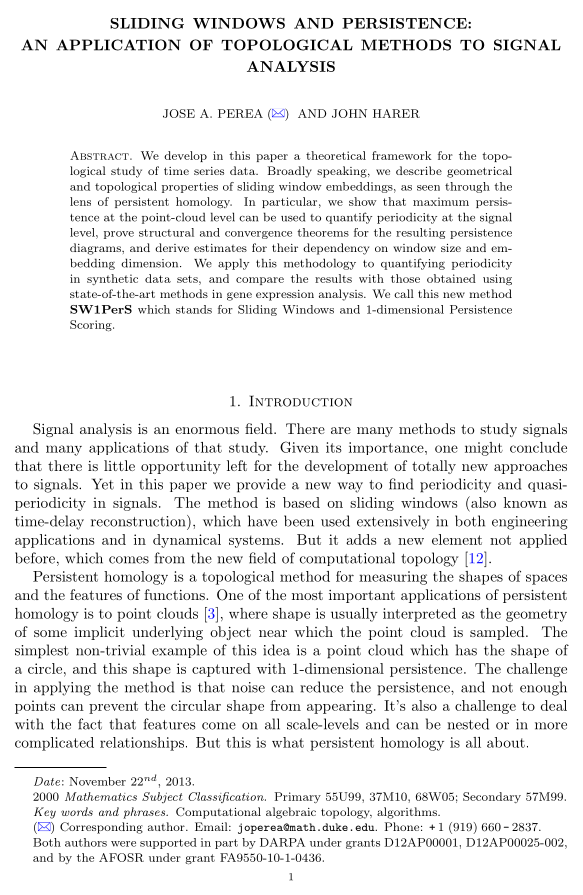
Sliding Windows and Persistence: An Application of Topological Methods to Signal Analysis
Jose Perea and John Harer


They explained: Why the circles?
We asked: What can we do with this?
- Visualise change points
- Cluster signals
- Find labels
Our Prototype
Vibrana

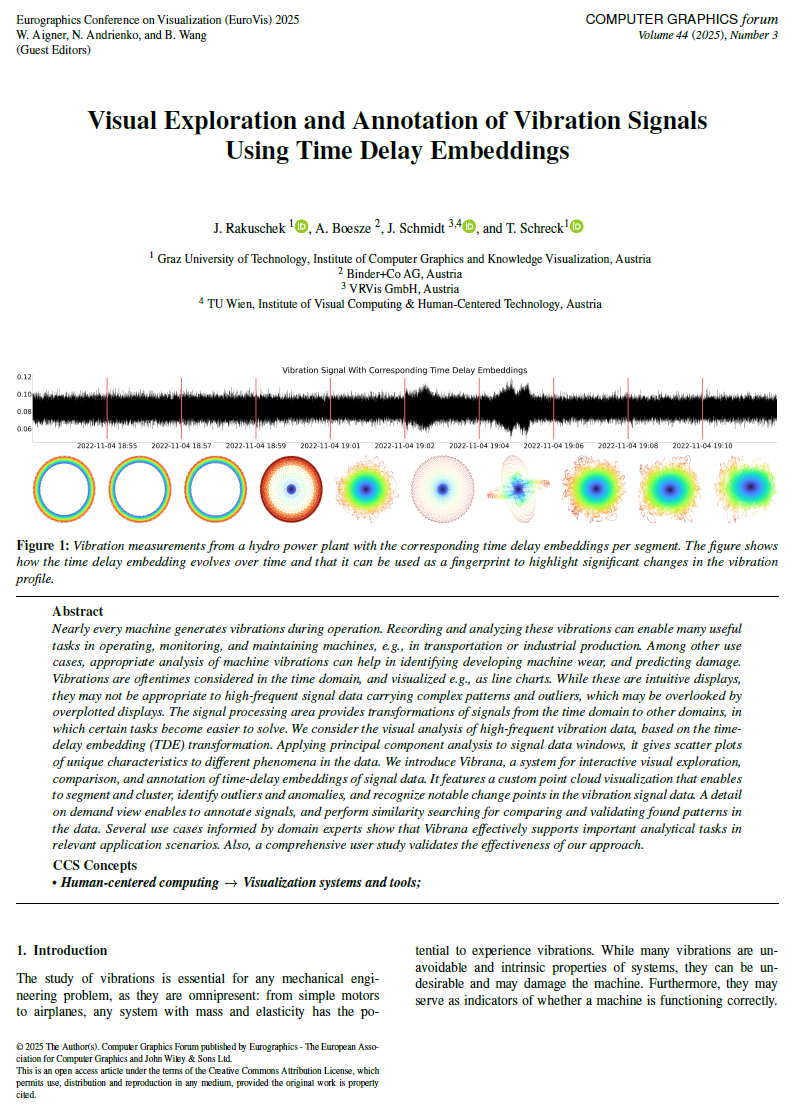
EuroVis 2025 Submission
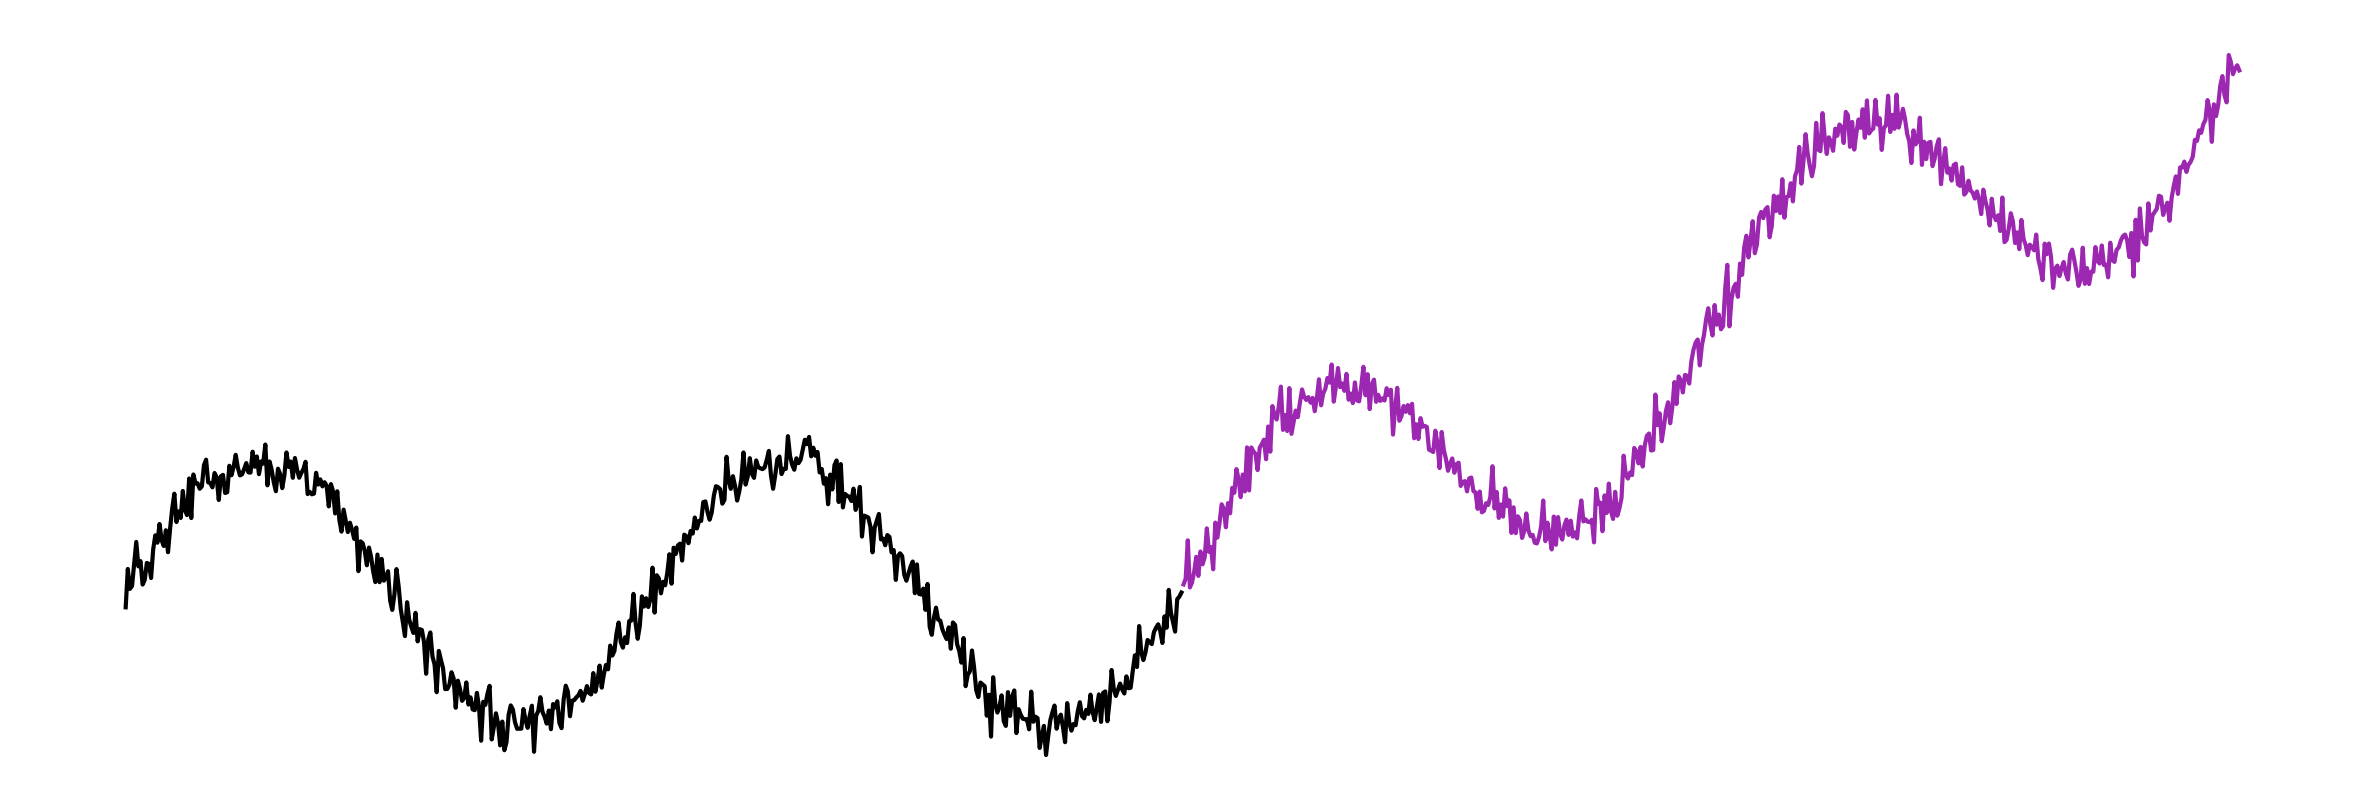
In Review 🍀Can we find a change point in the signal?
Vibrations of a hydropower plant:
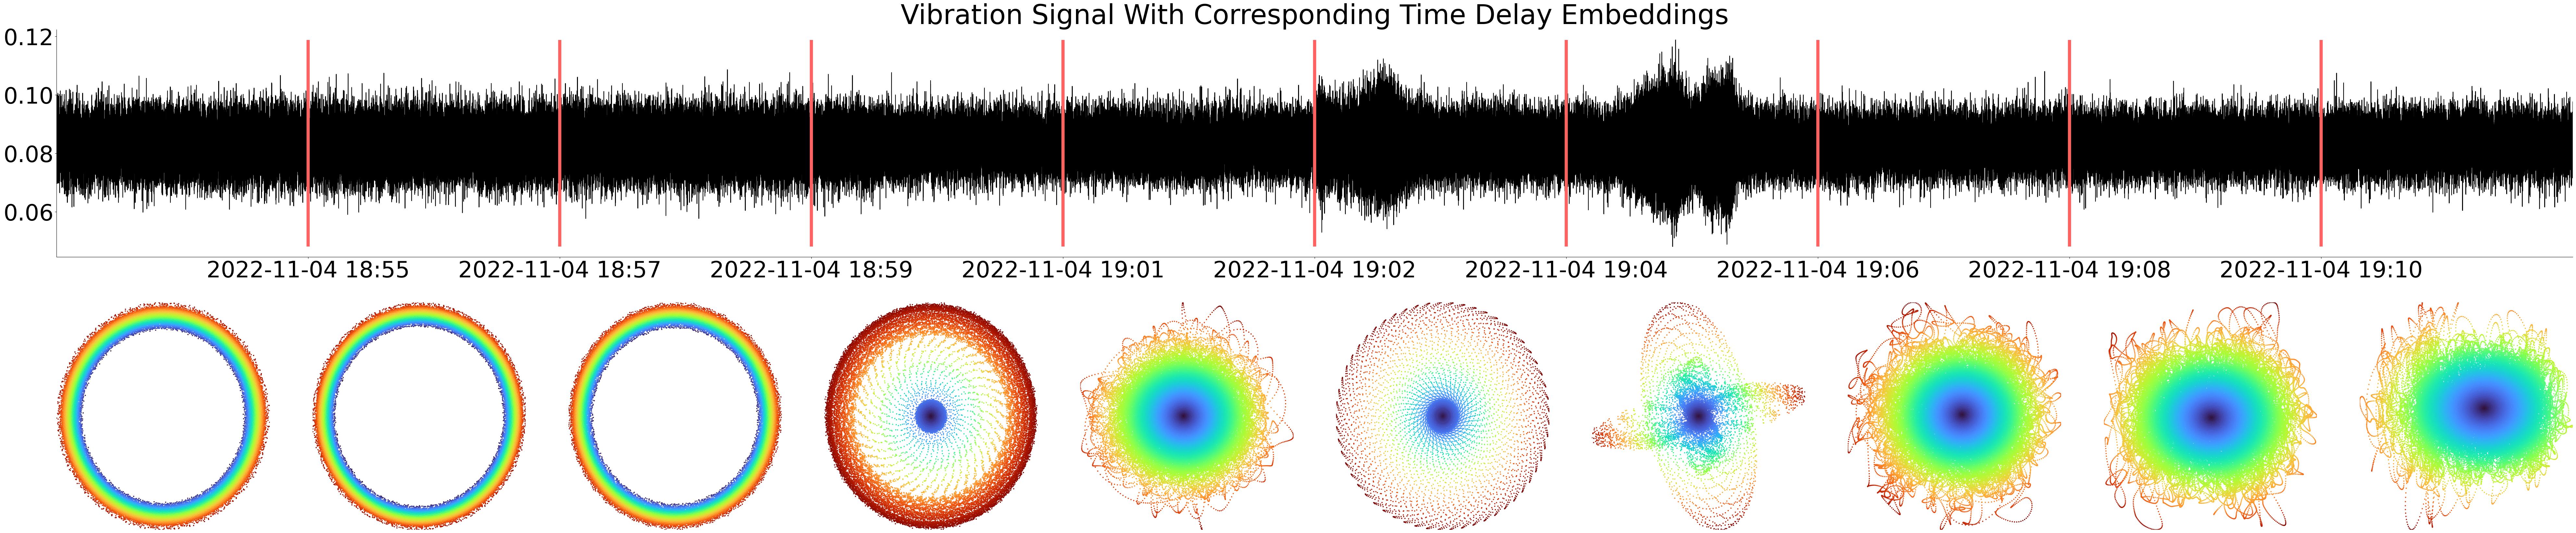
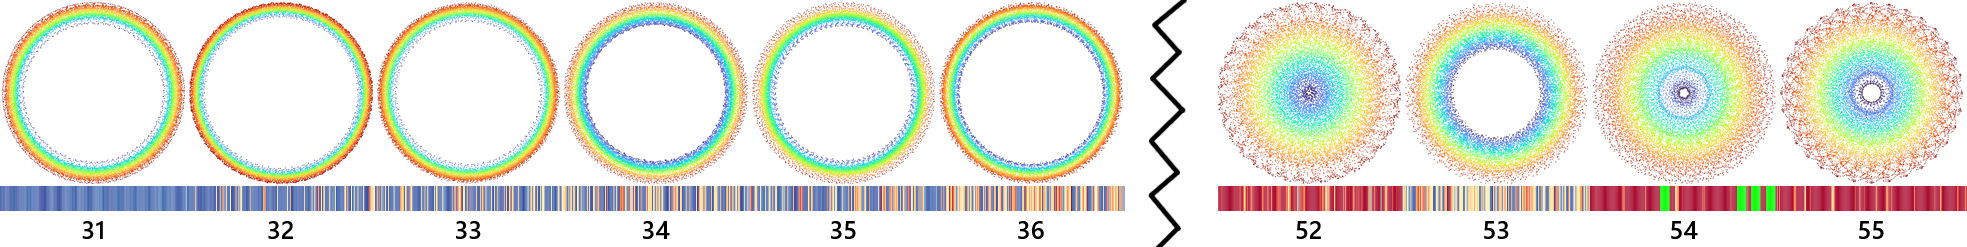
The TDE is a fingerprint evolving over time!
We can also cluster these fingerprints!
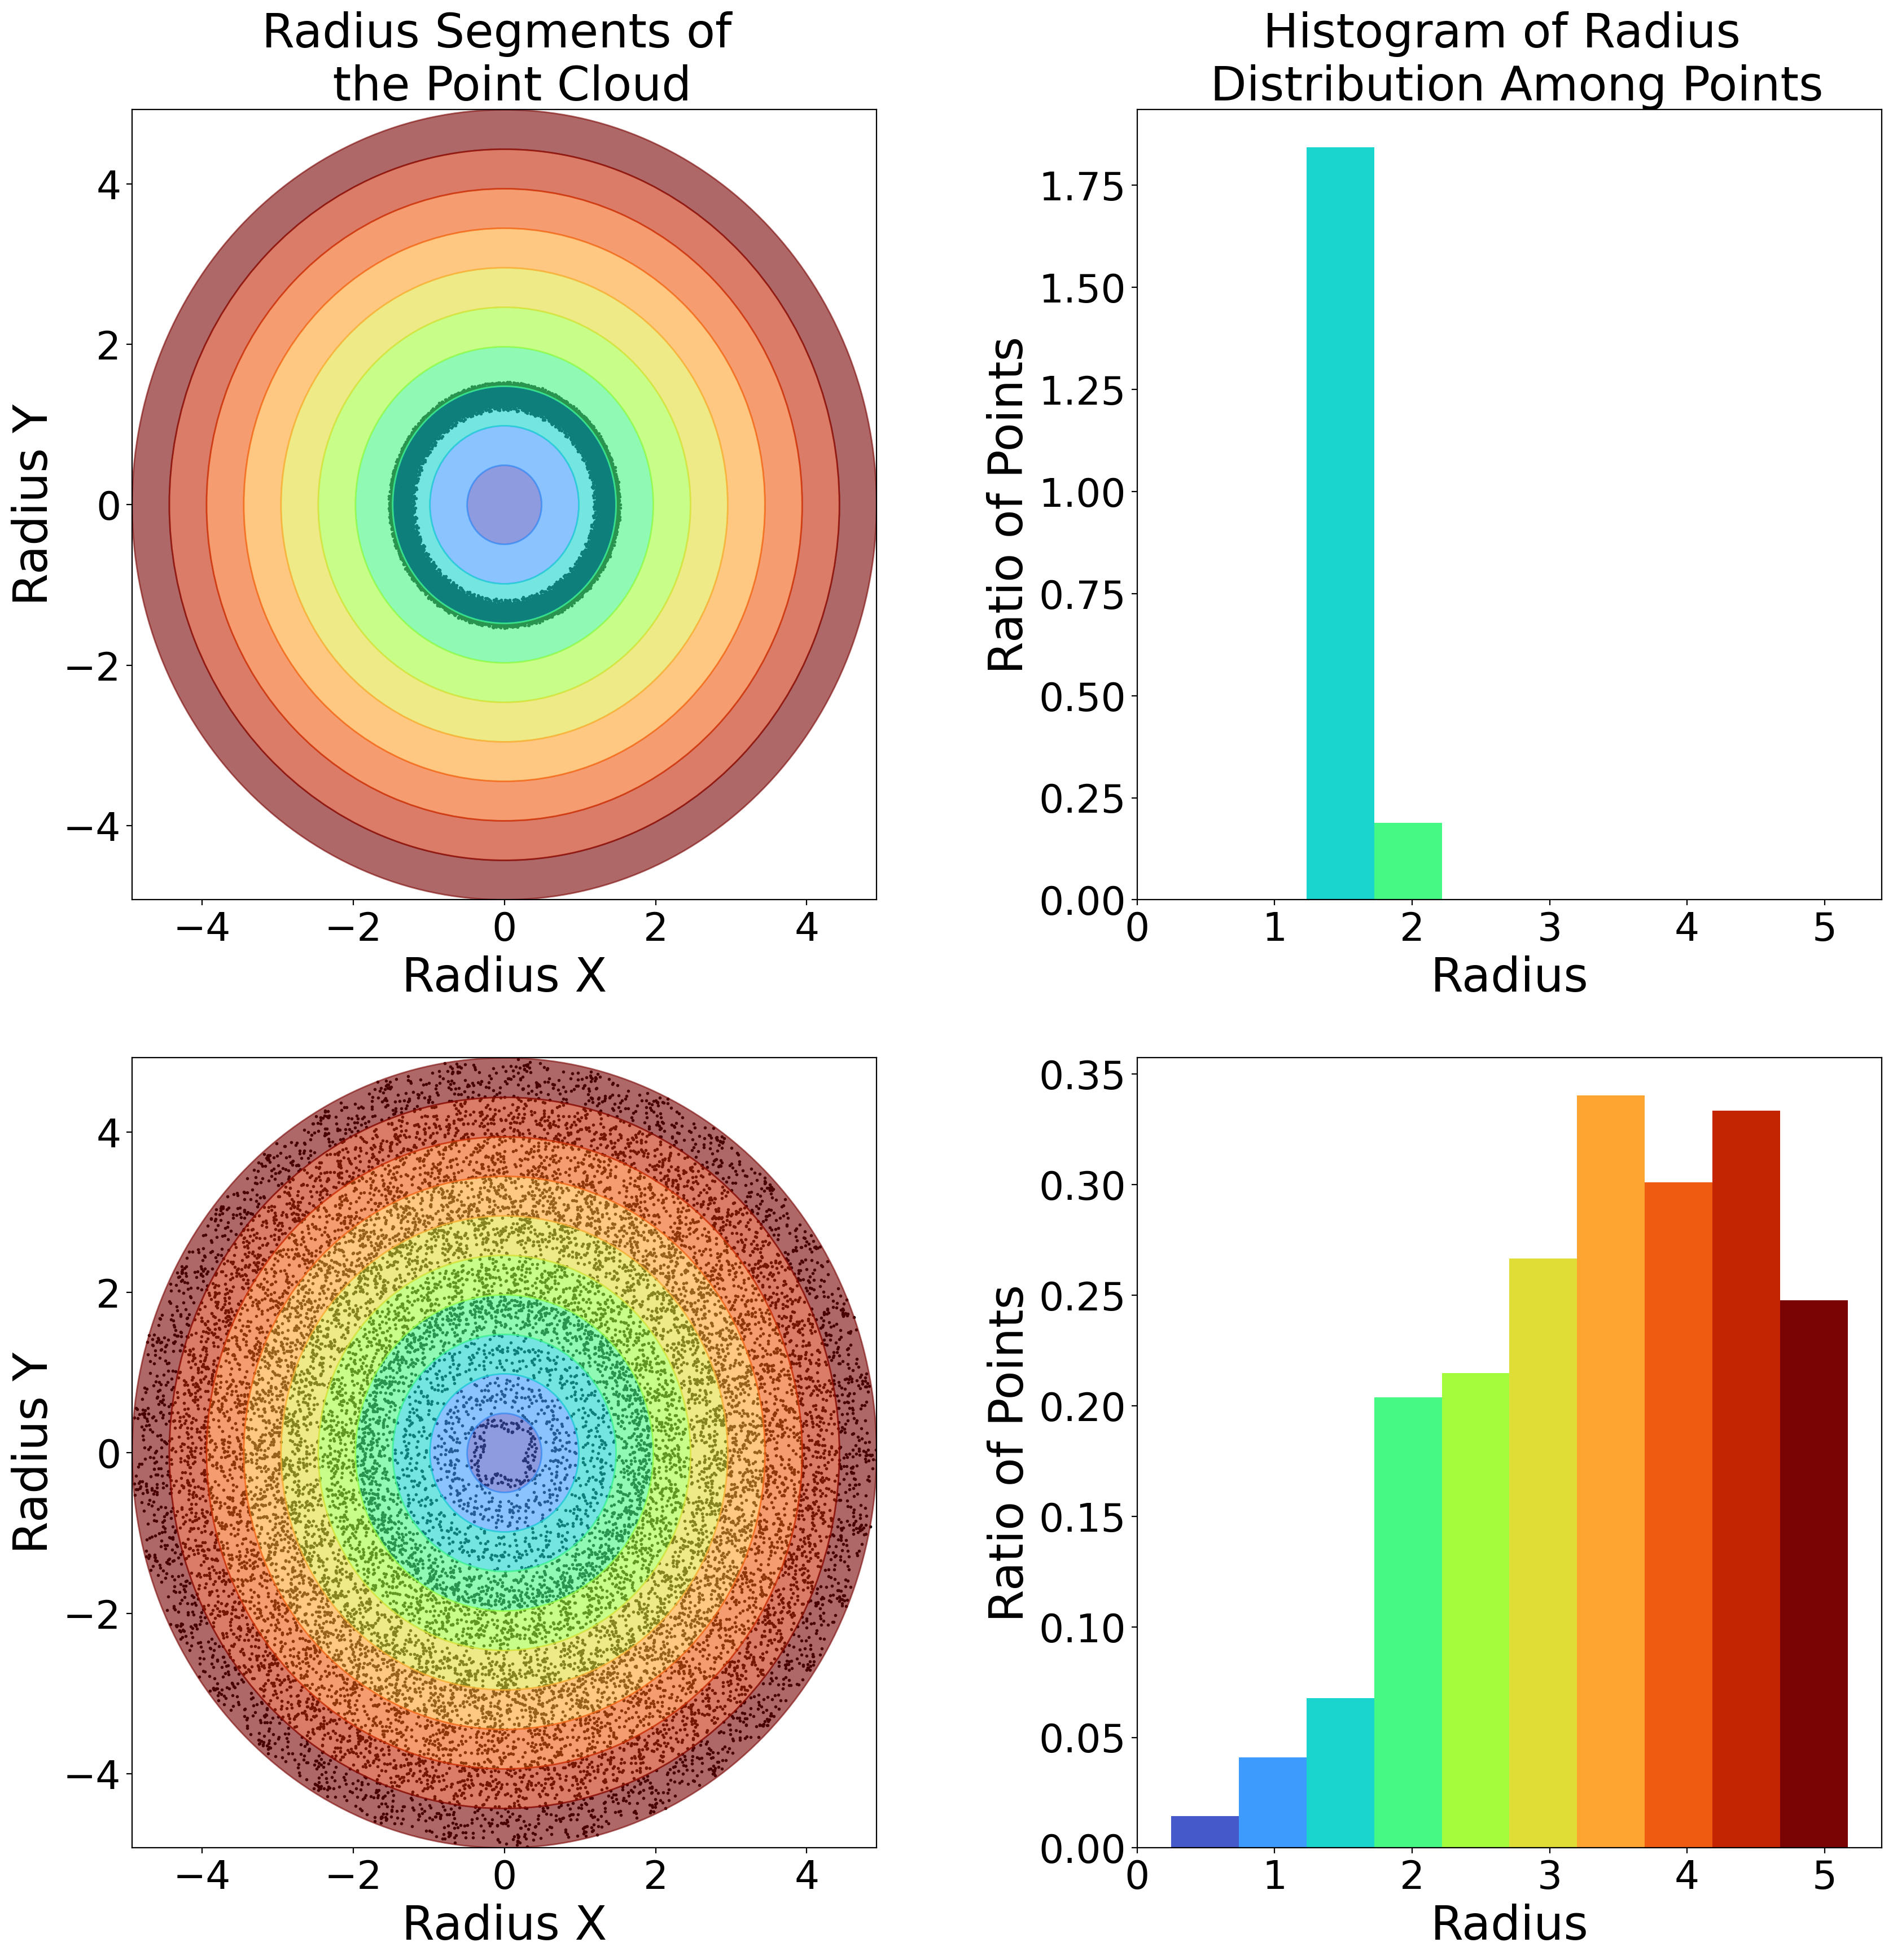
For the curious: We cluster by radius distribution
Applications
Engines
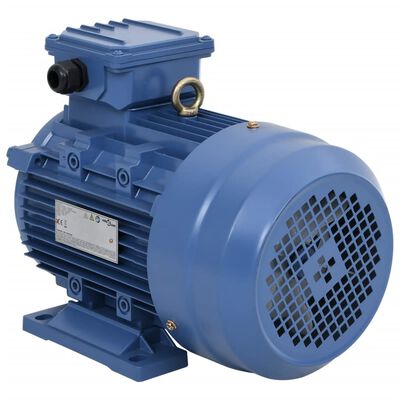
When can we detect wear?
Bearings
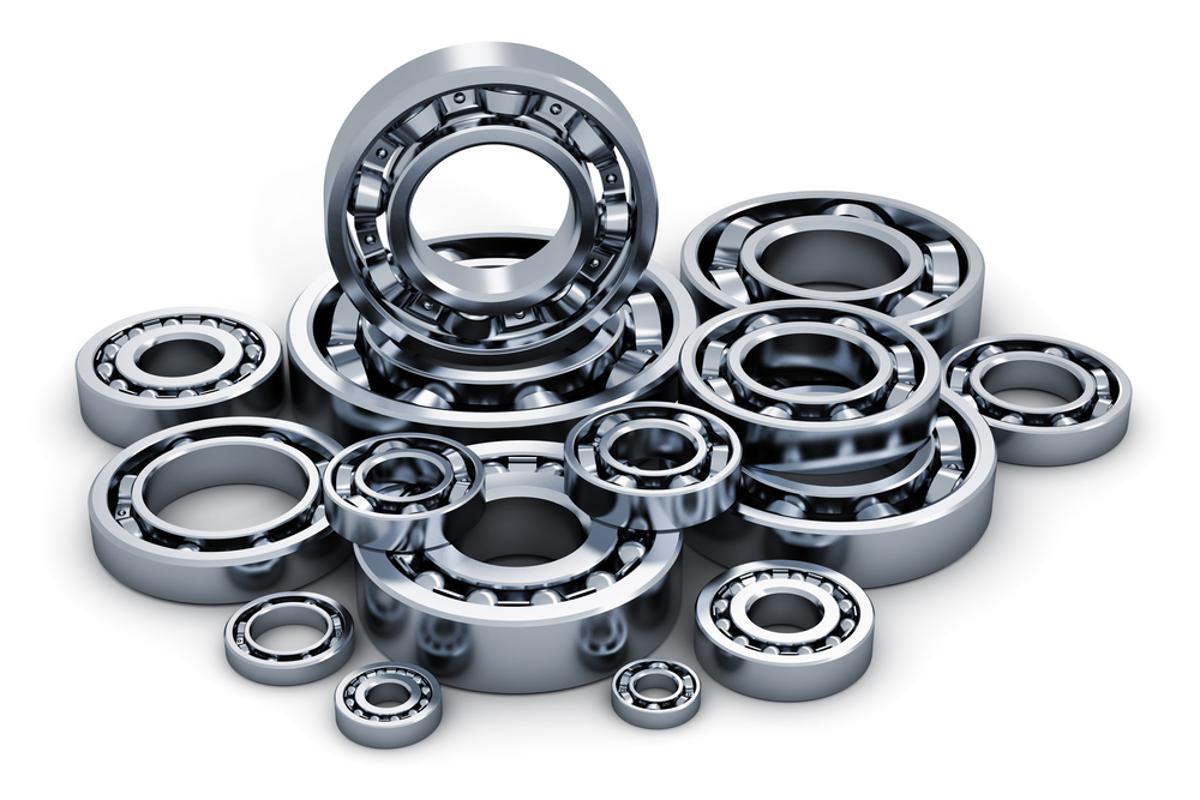
Which are faulty?
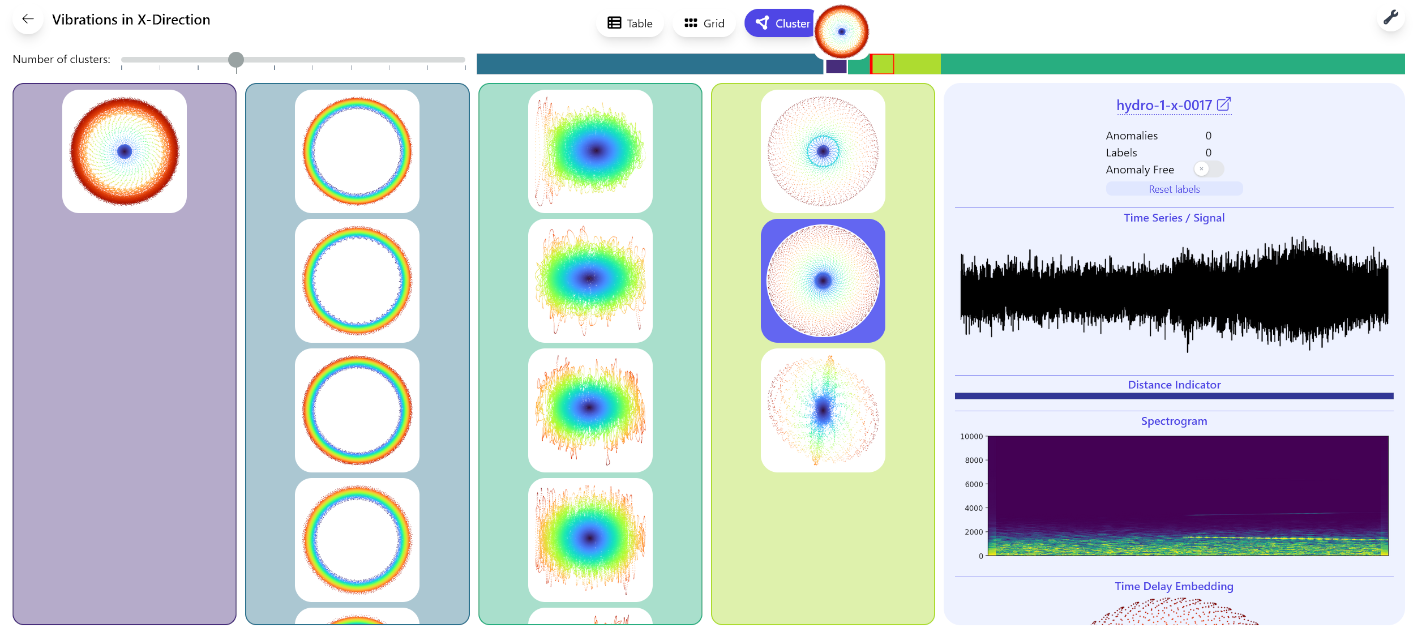
The Three-Charts-View
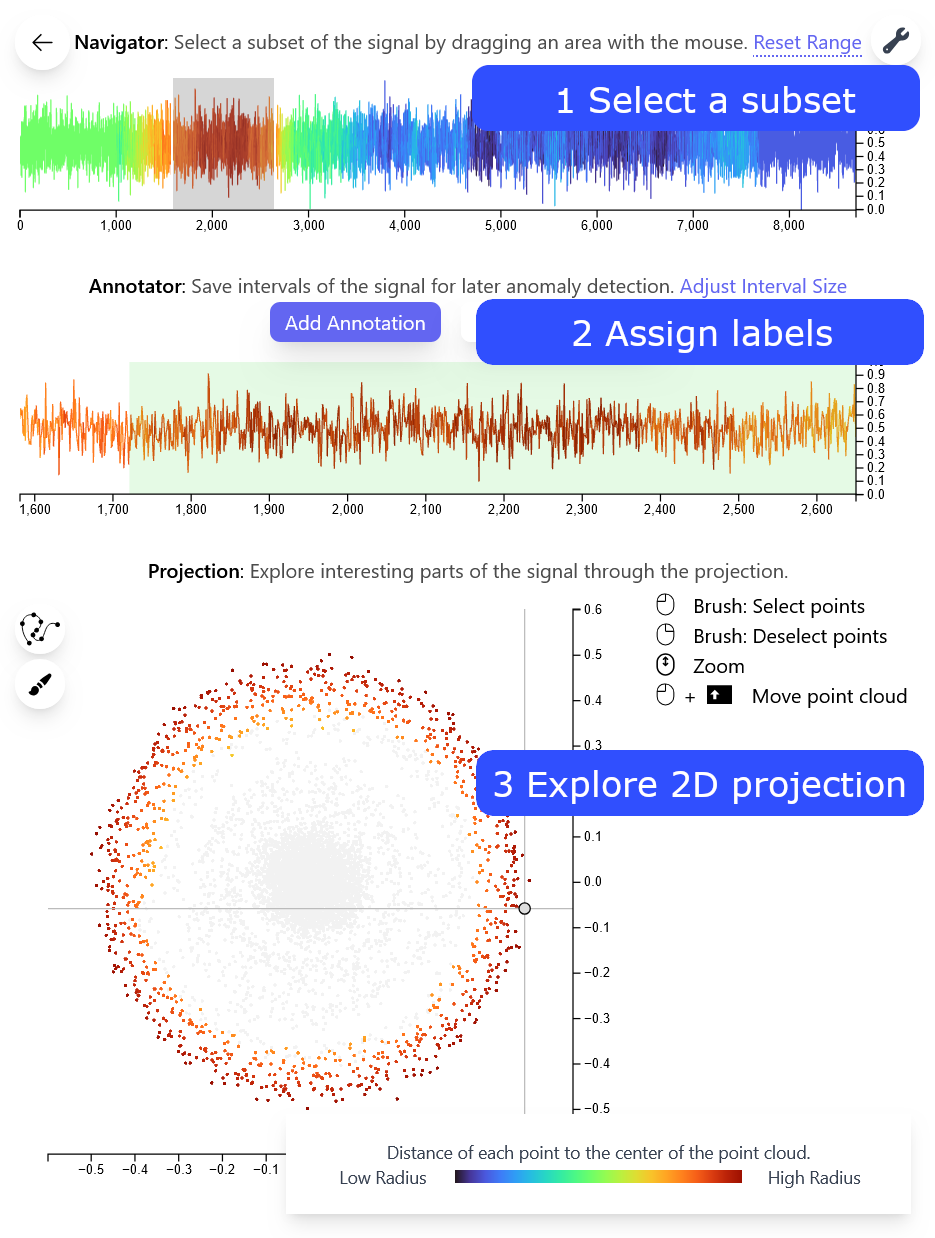
Simply Brush the Scatterplot
The labels are used for a similarity search
This reveals a creeping damage in the engine!
Finally: What about noise?
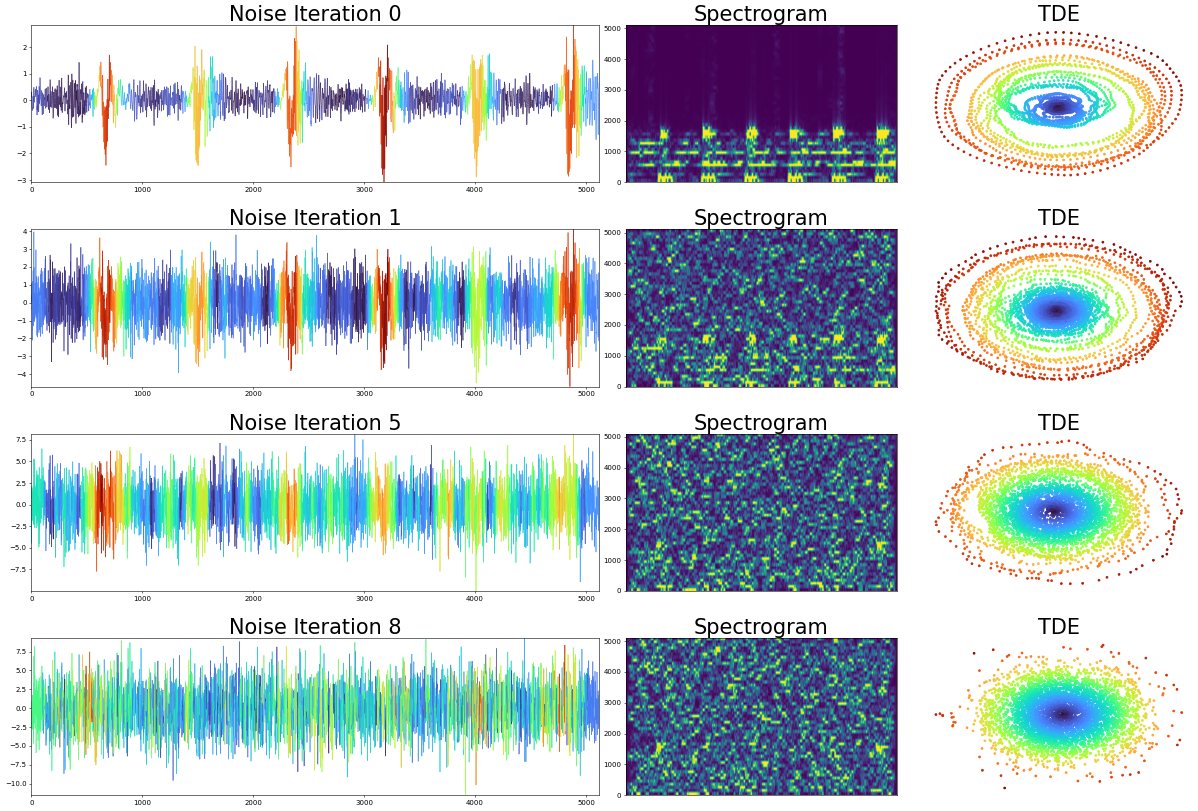
The most important insight however ...
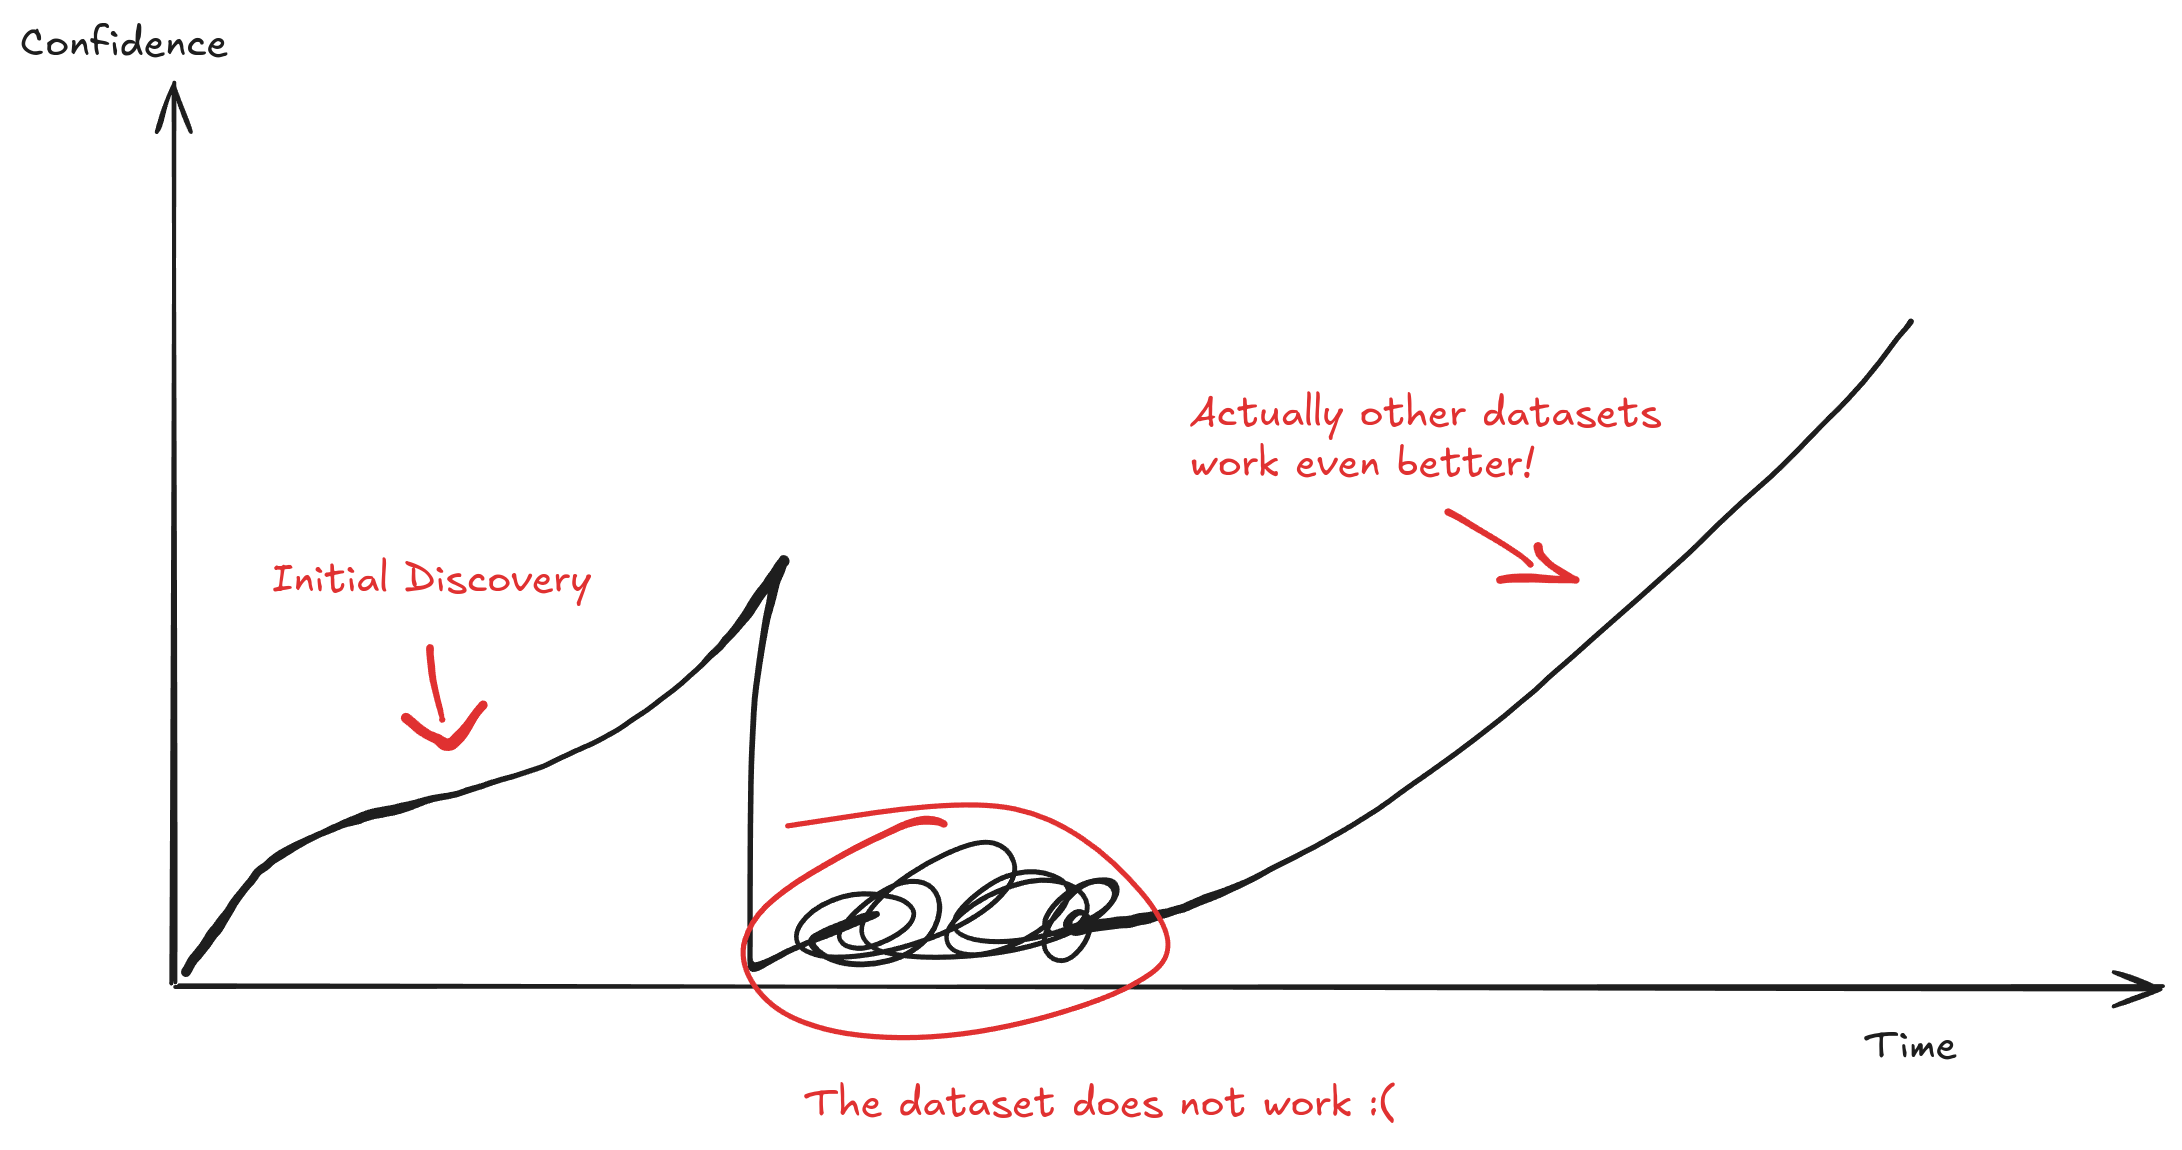
... is that research is not always linear!
Small Cliffhanger
What if we have 75 TB of data? 🤯
To be continued ...
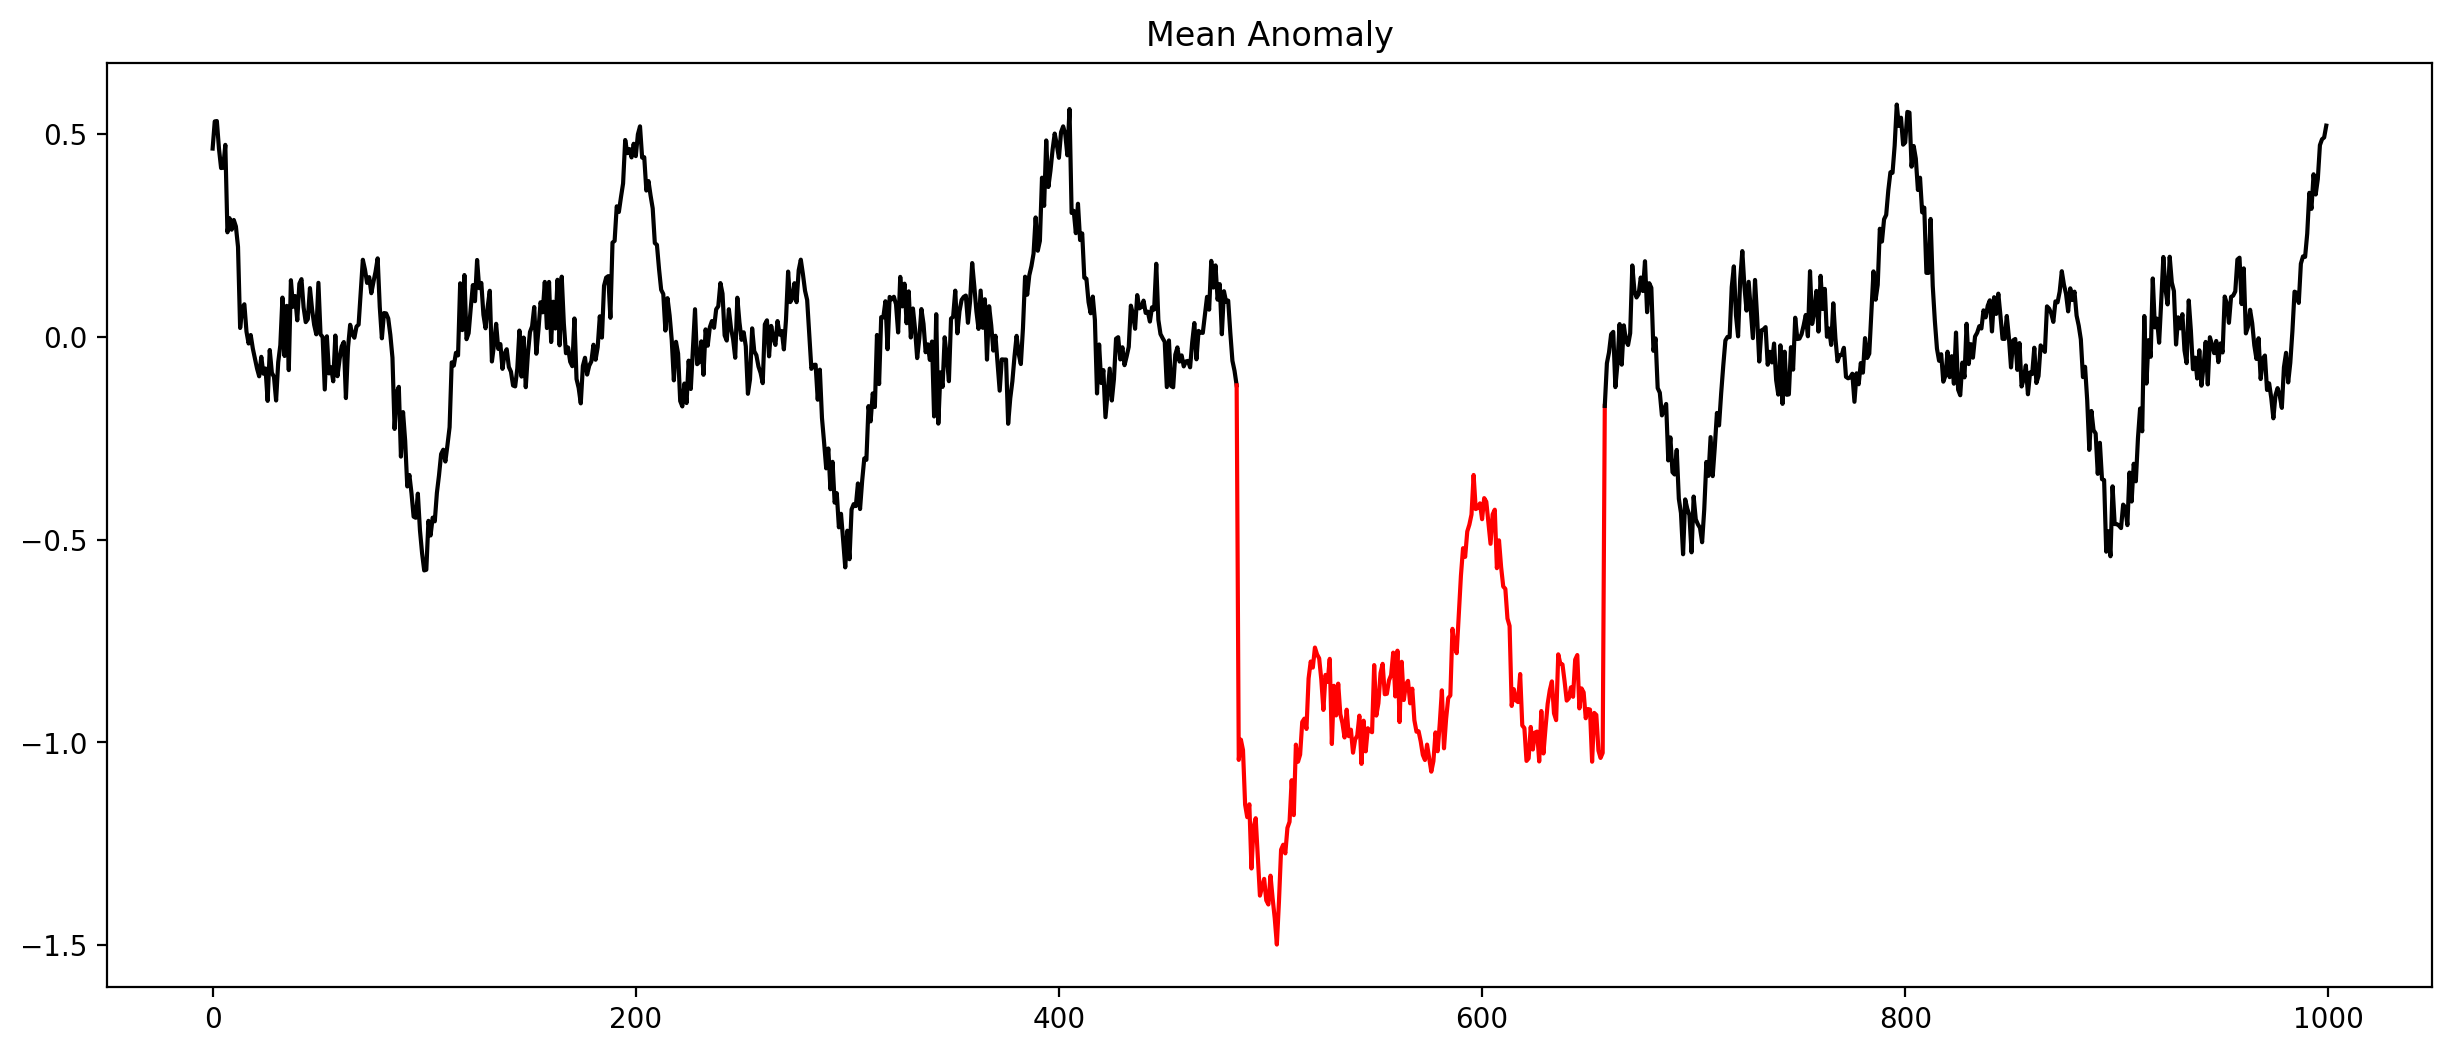
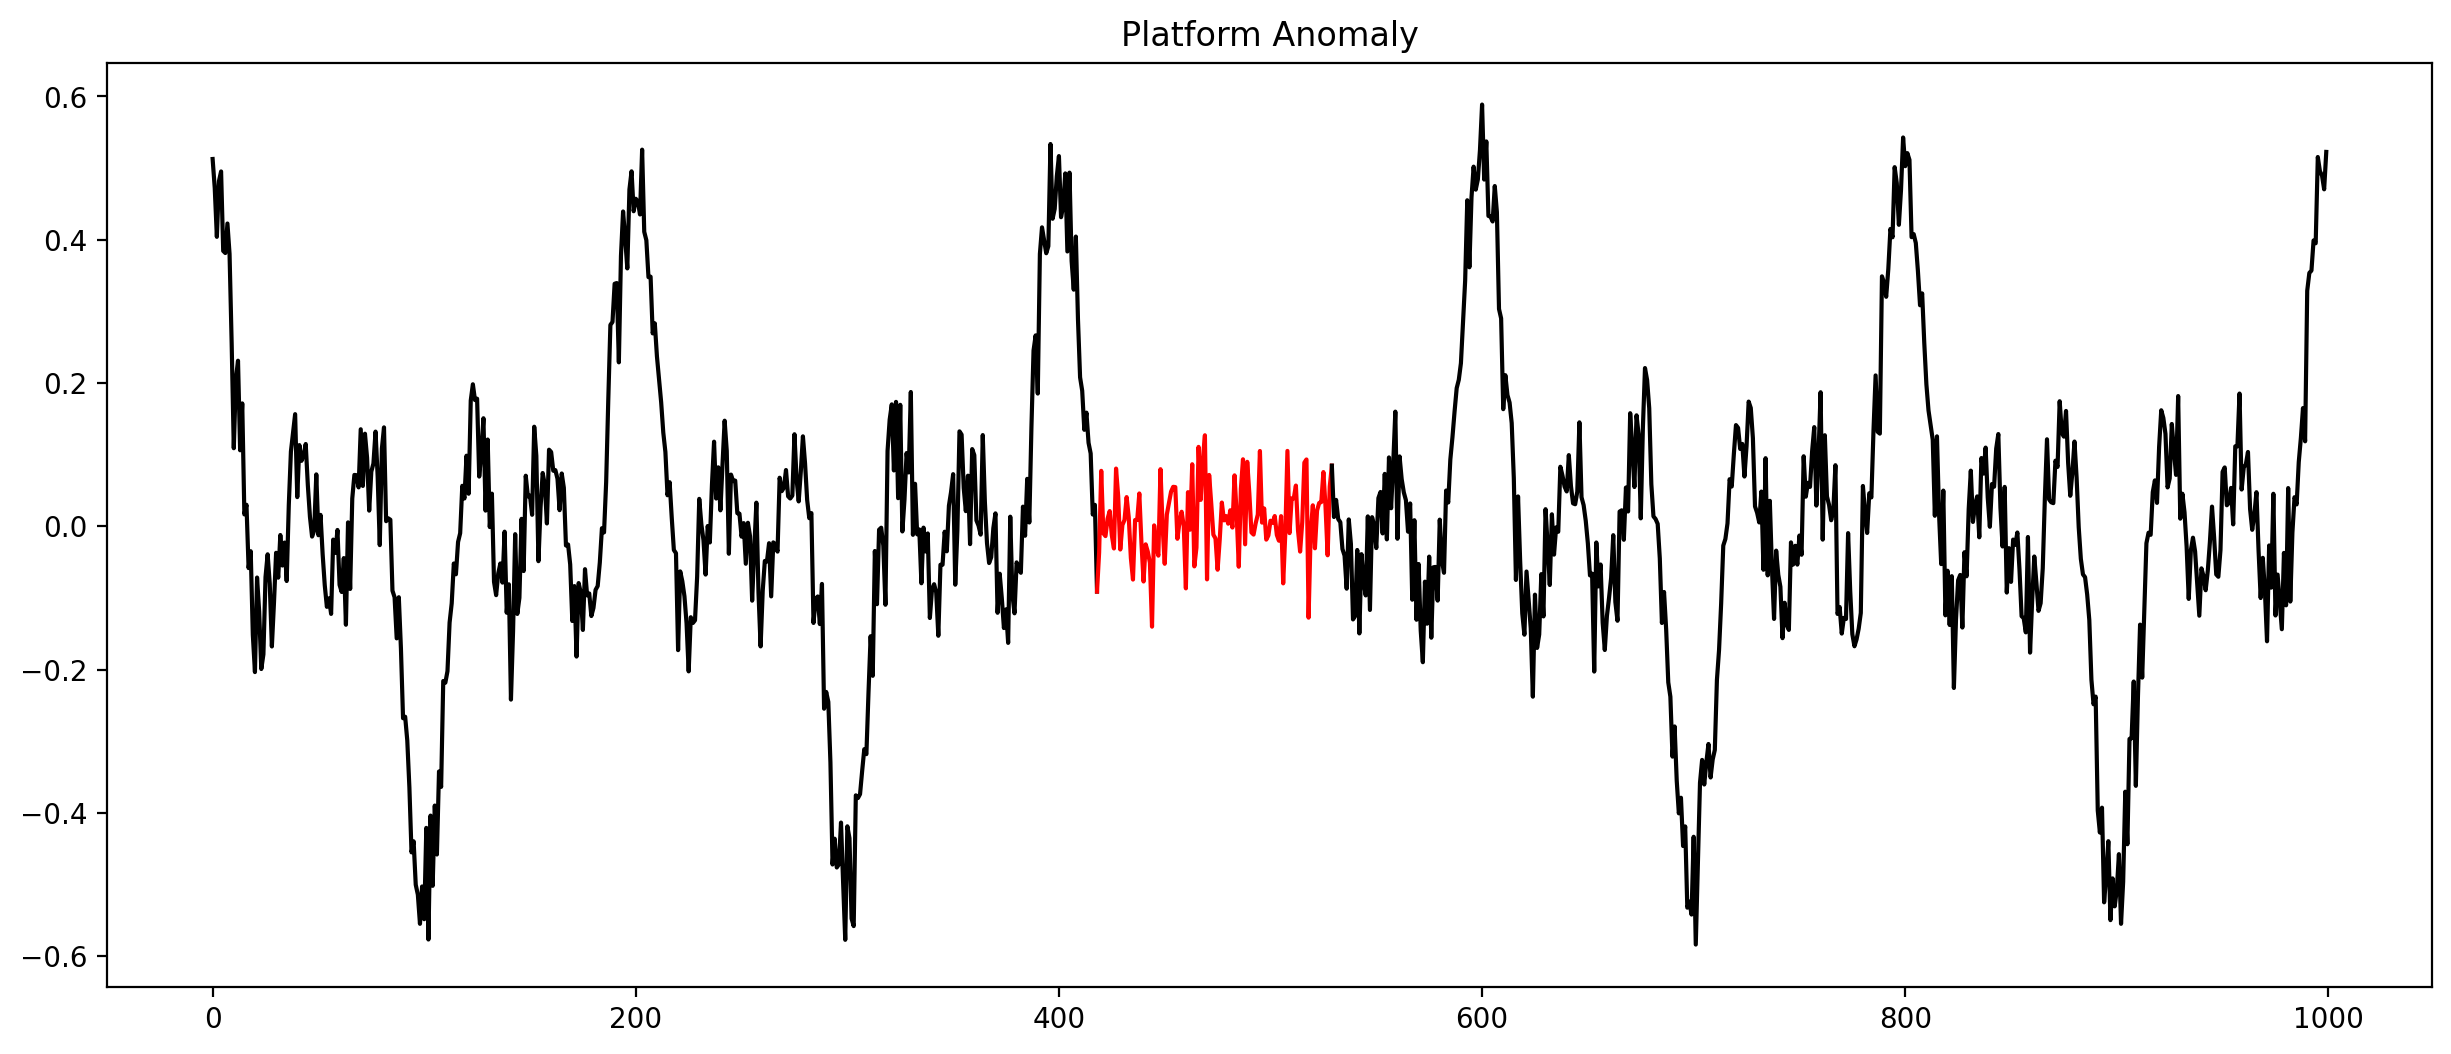
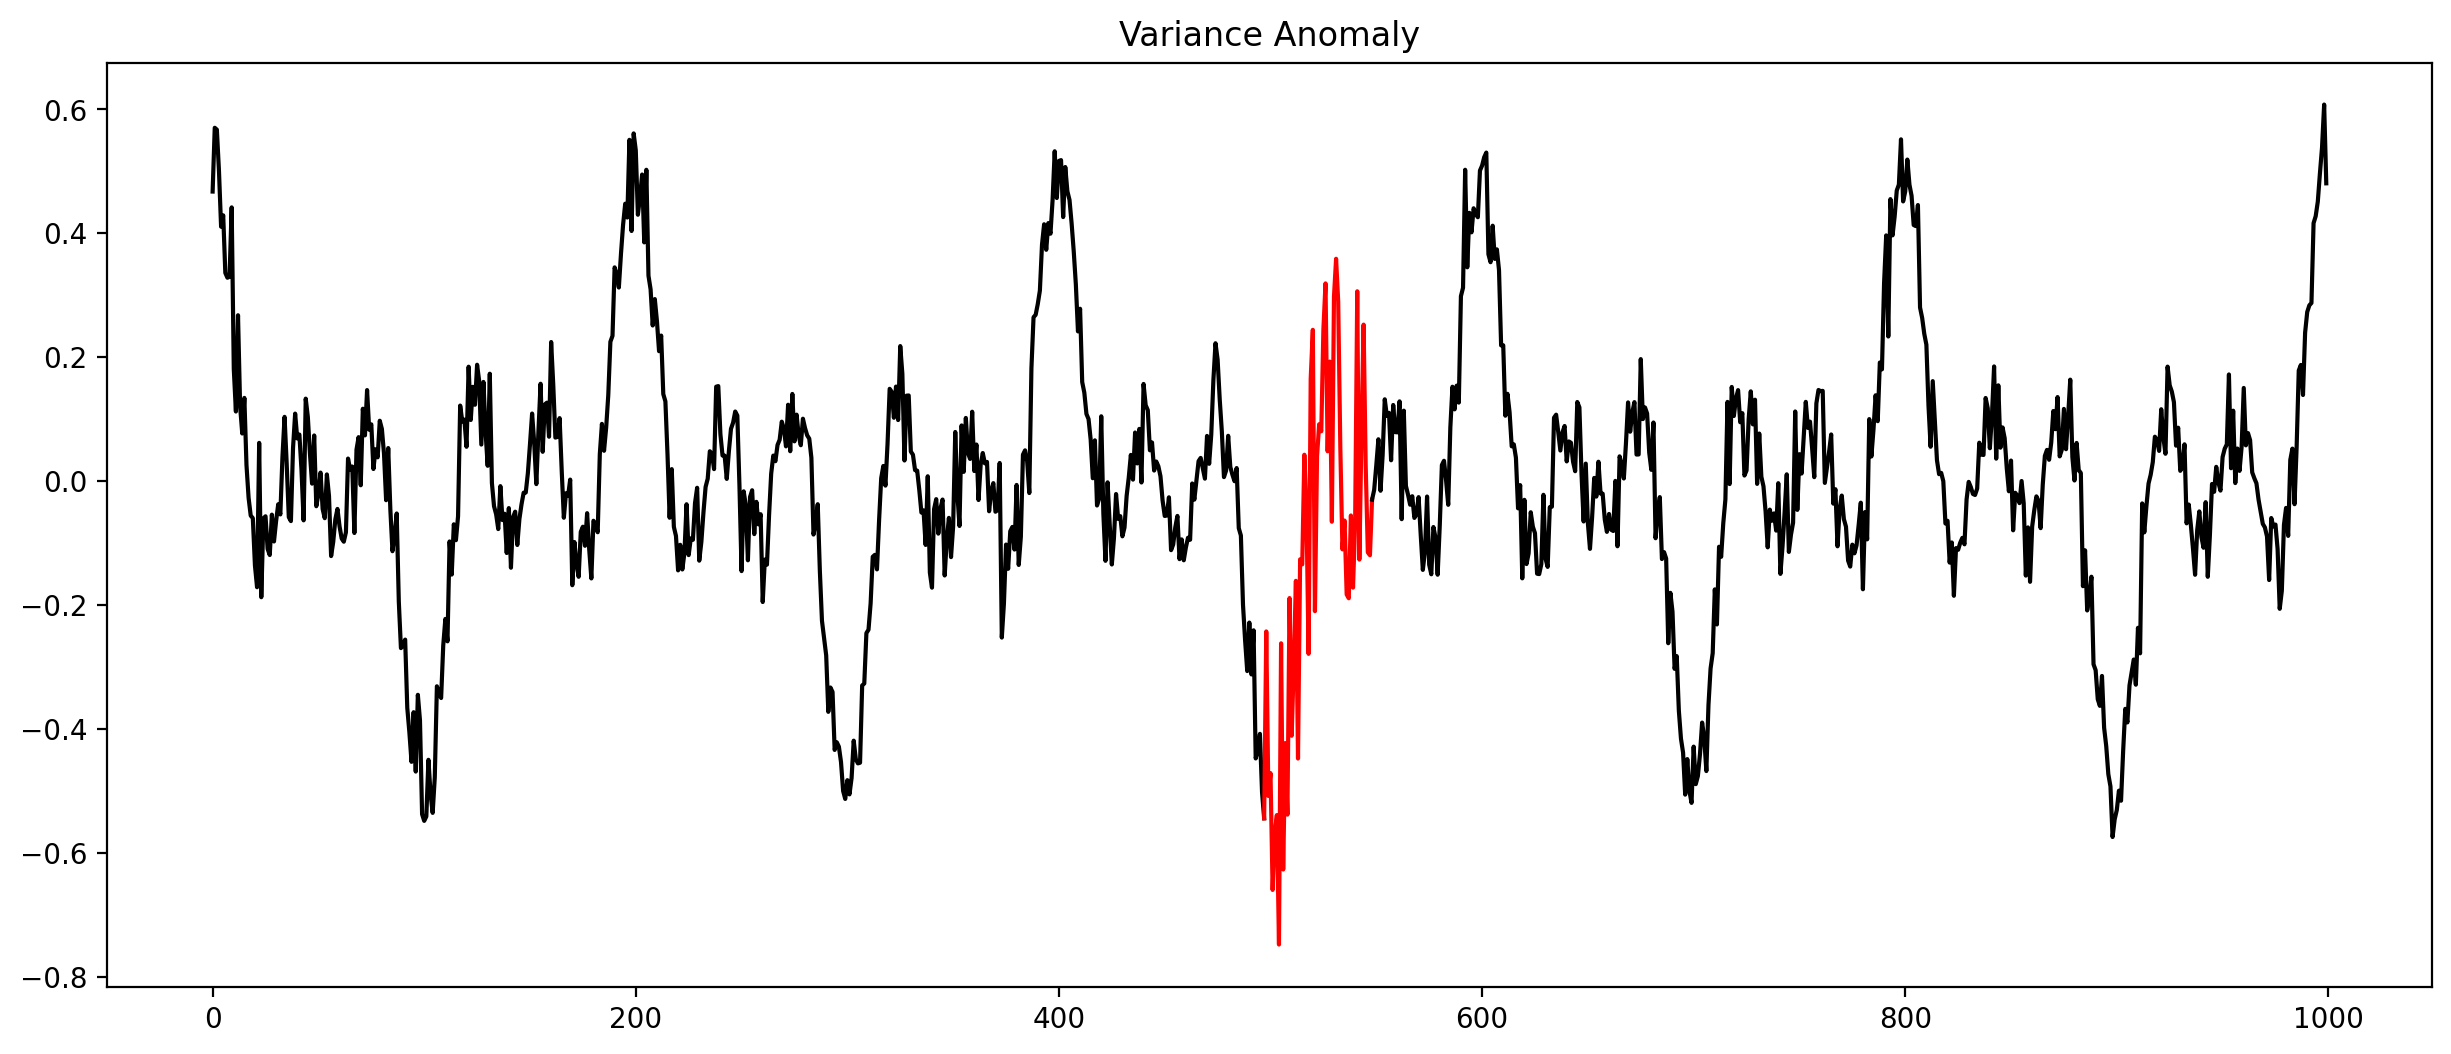
Anomalies
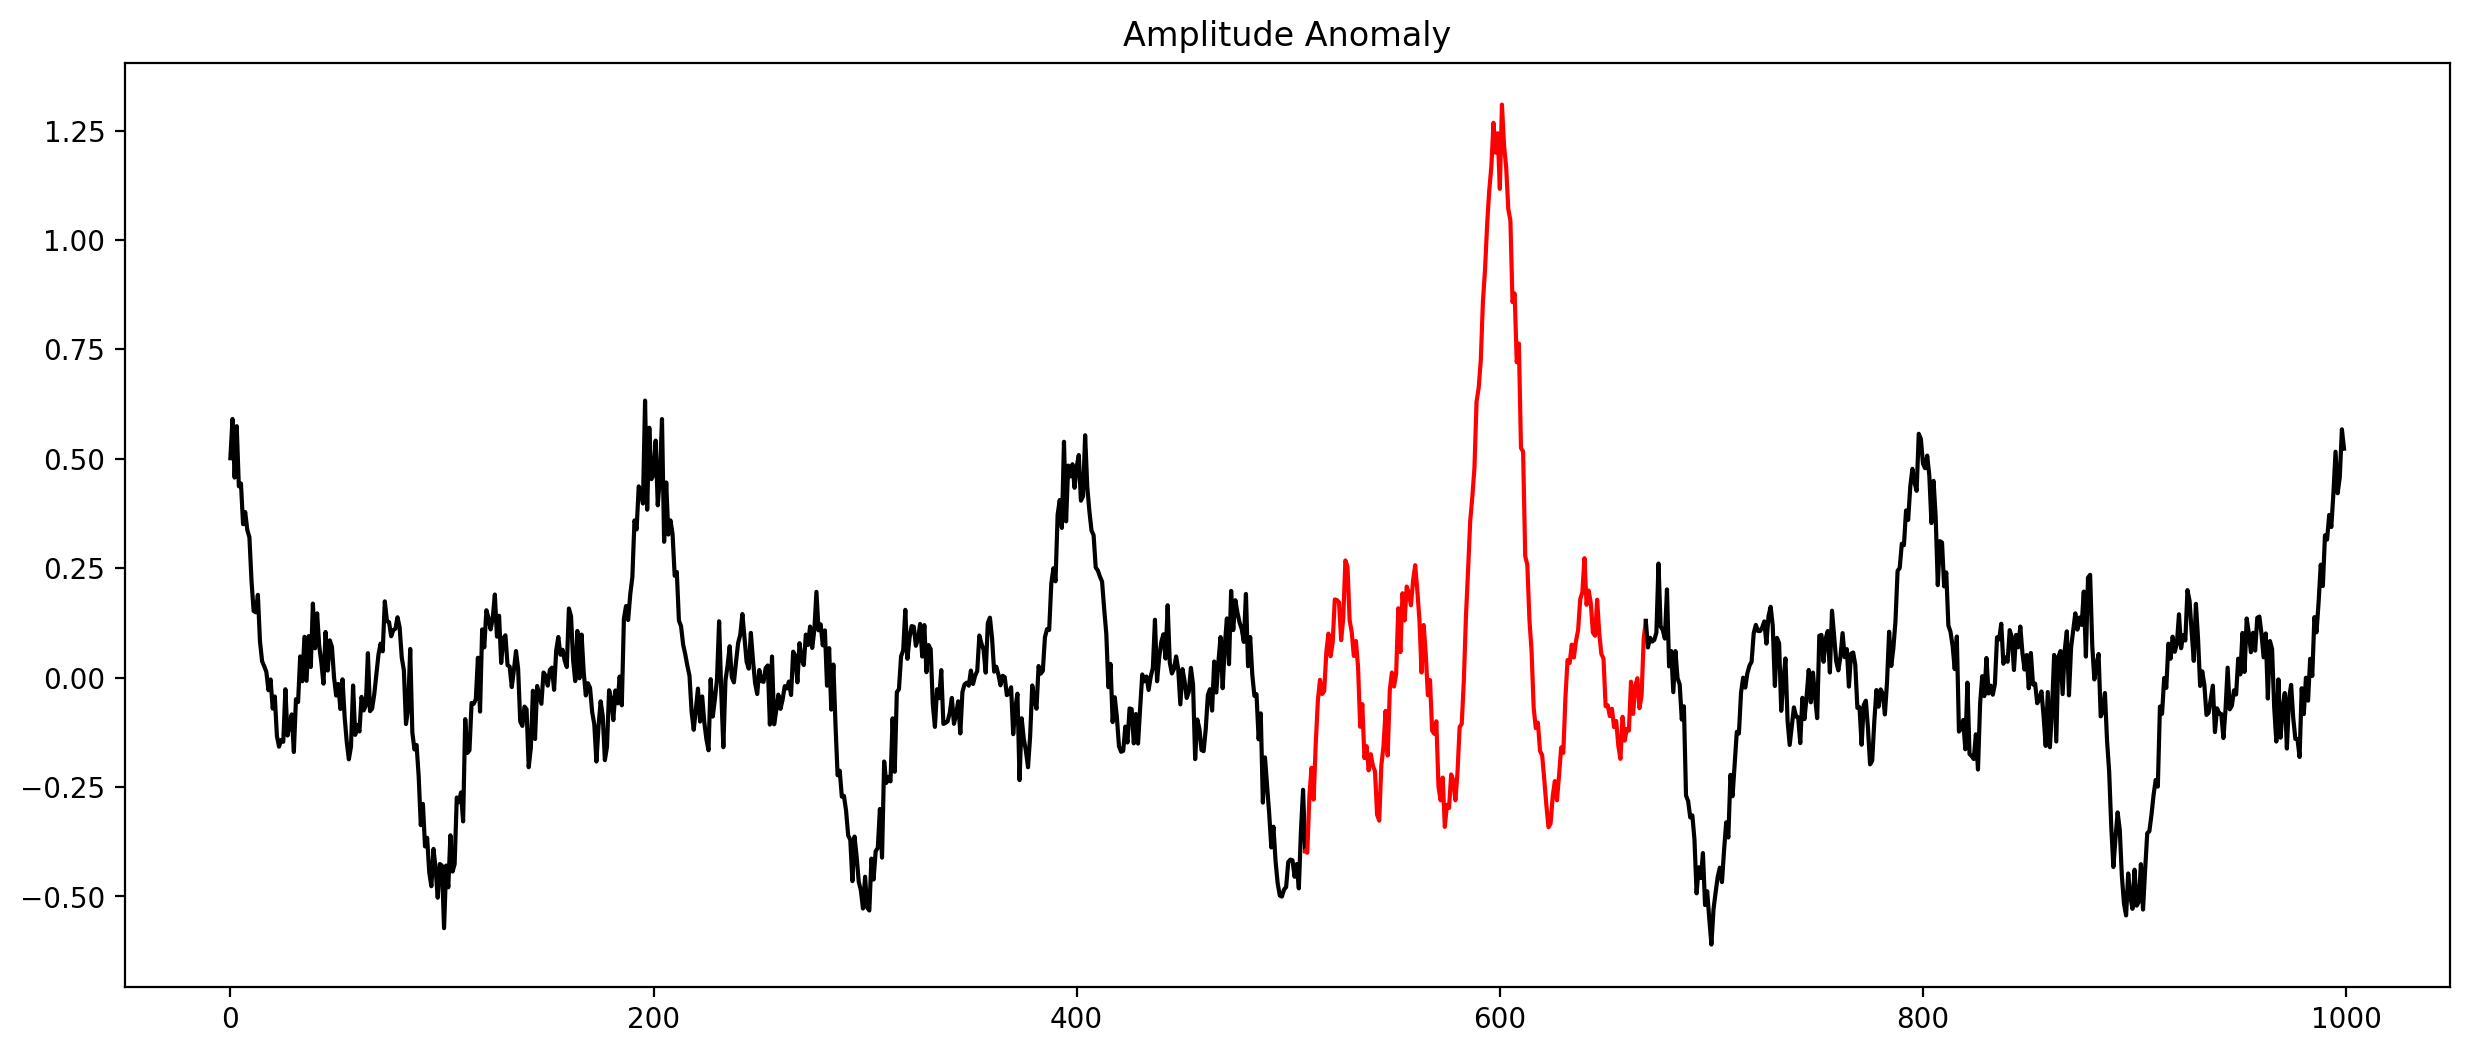
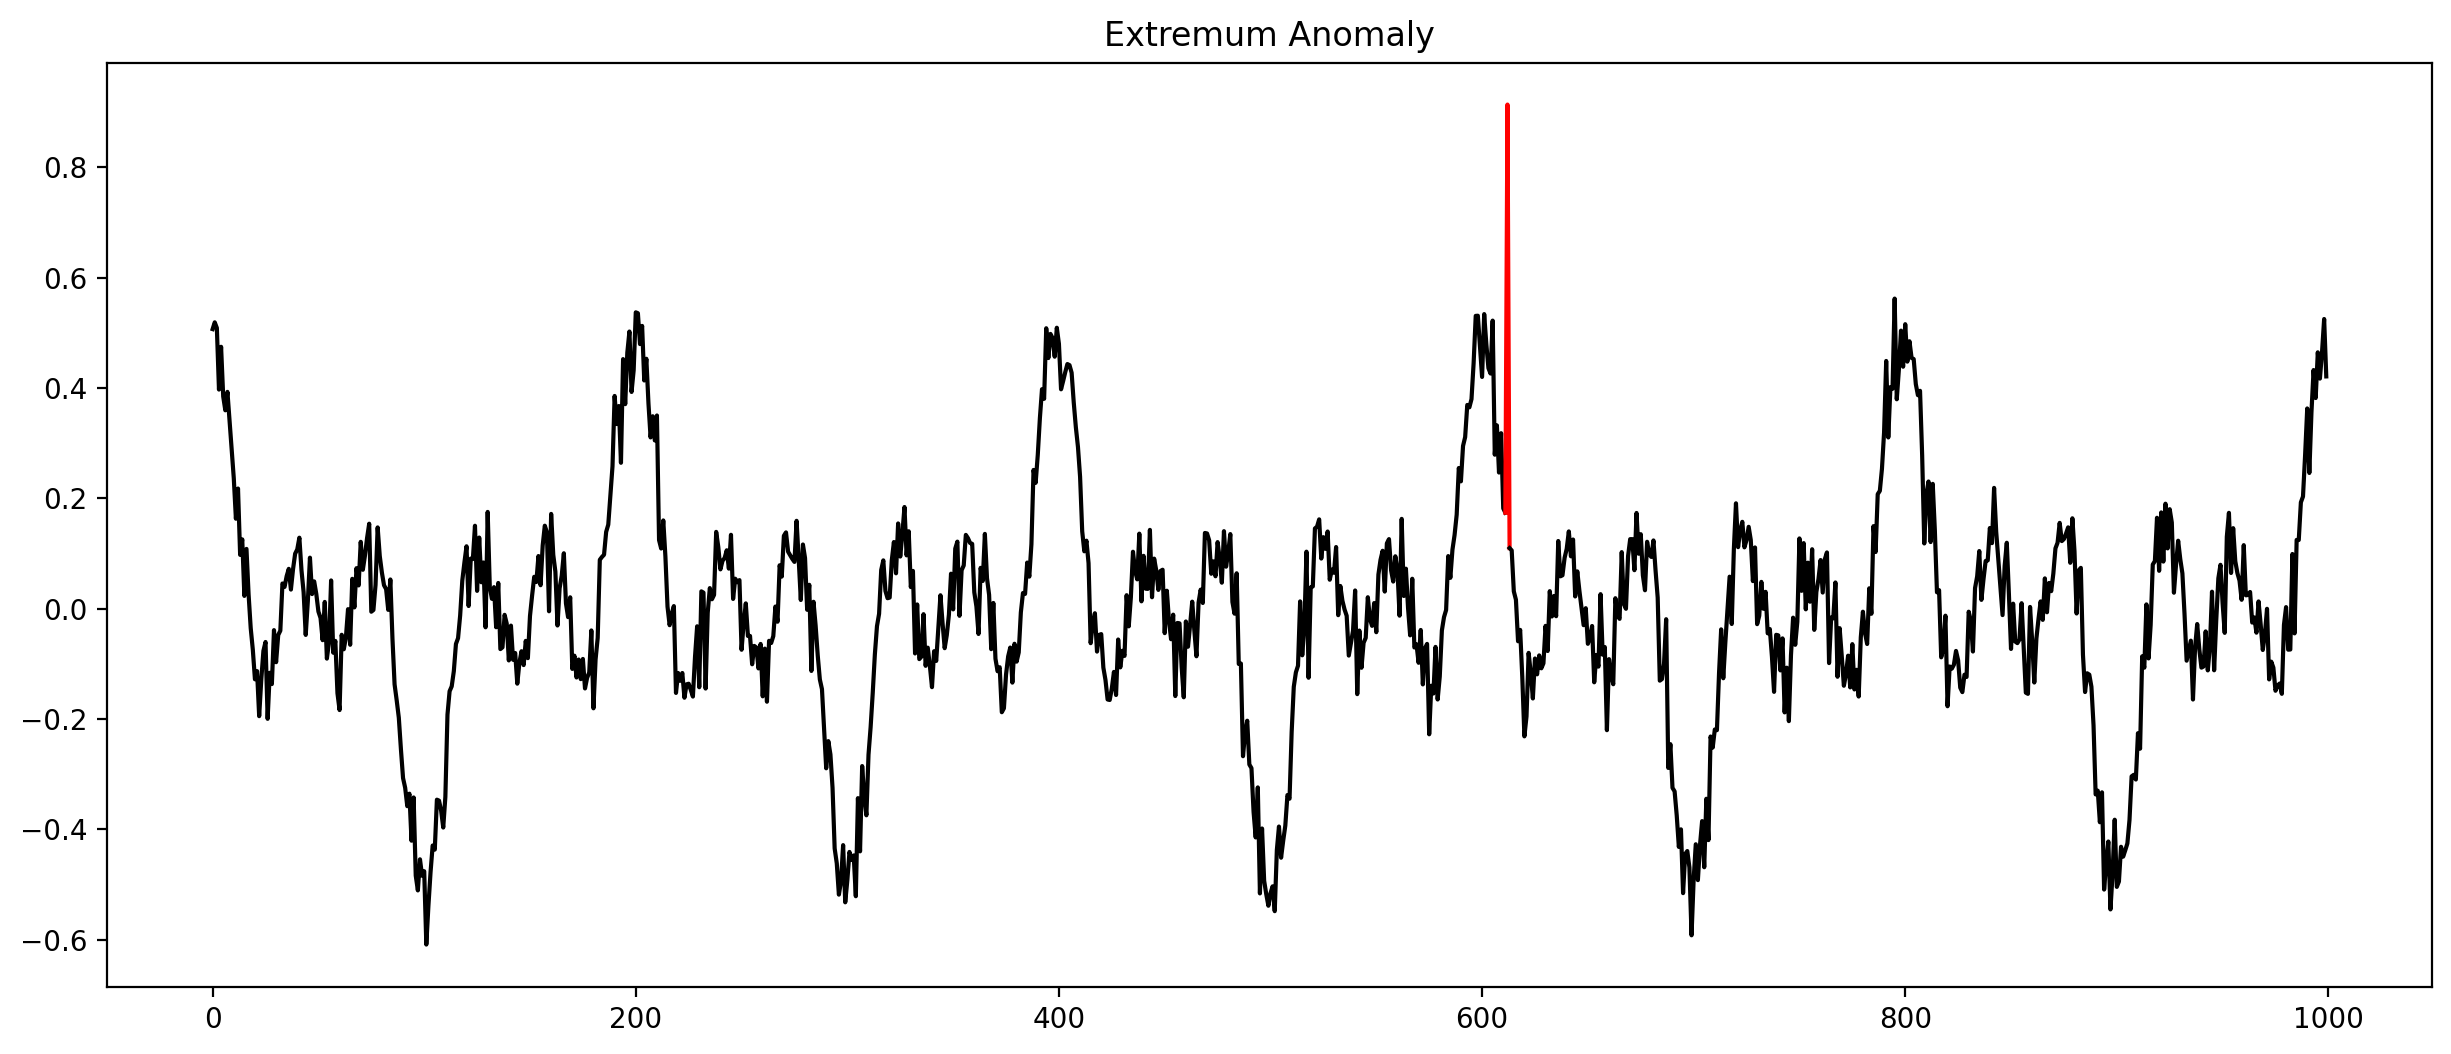
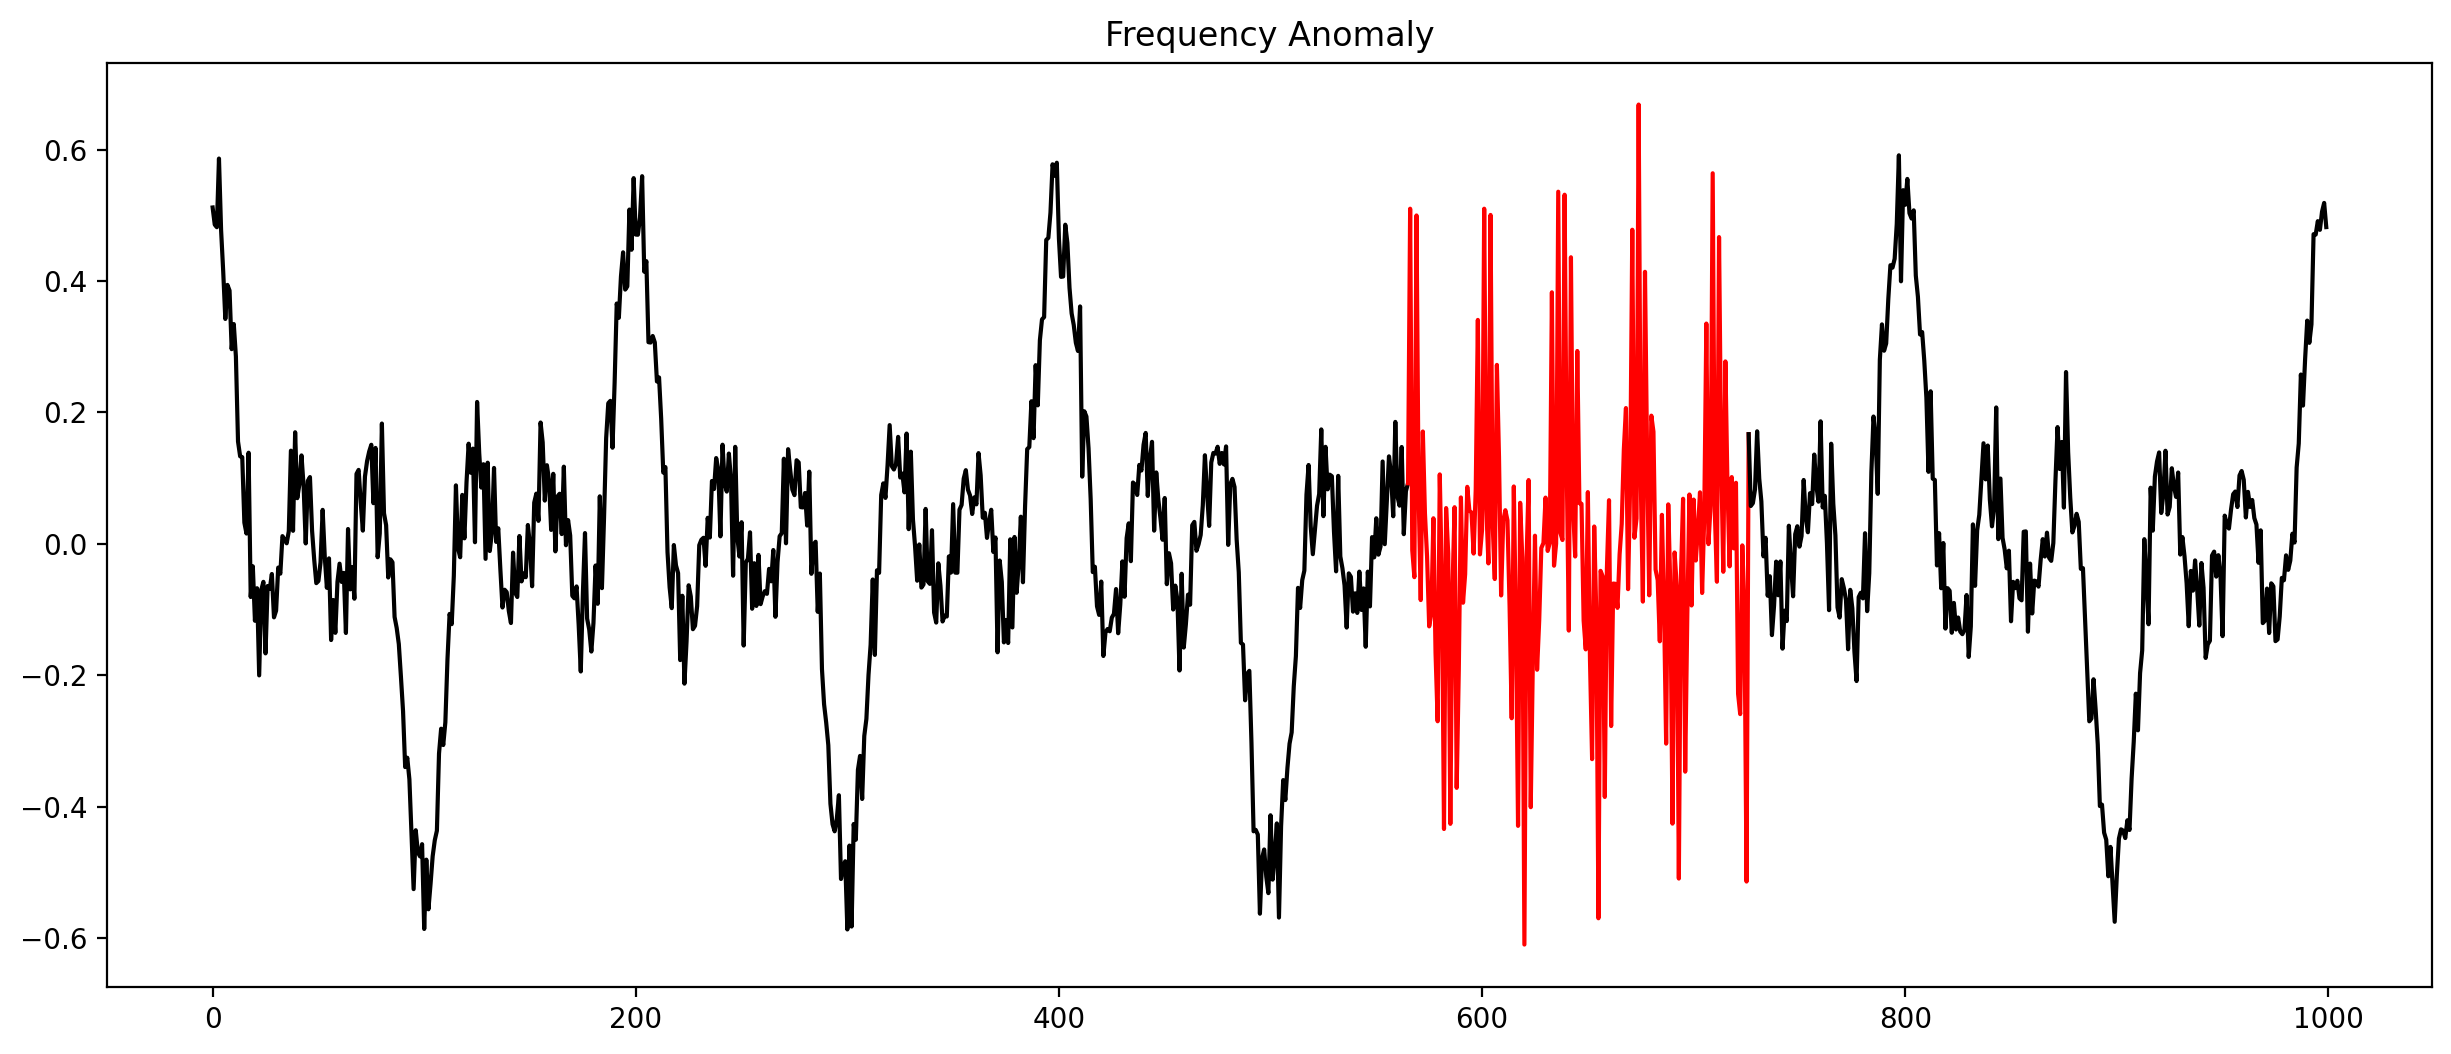
Anomalies in time series (Selection)
Check every time series by hand?
Let algorithms do the work!
Introducing AnoScout
Anomalies are represented as cards:
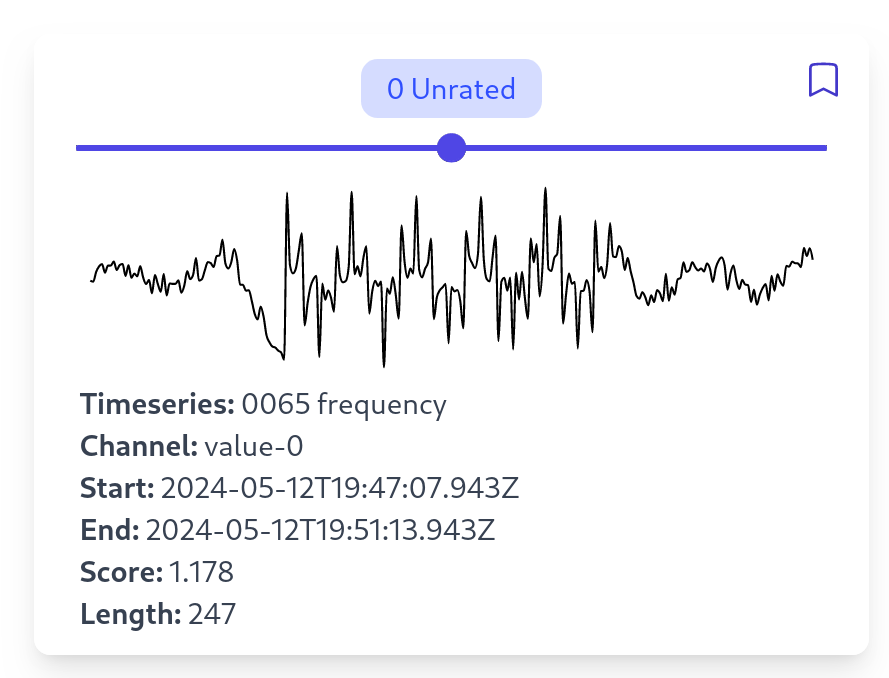
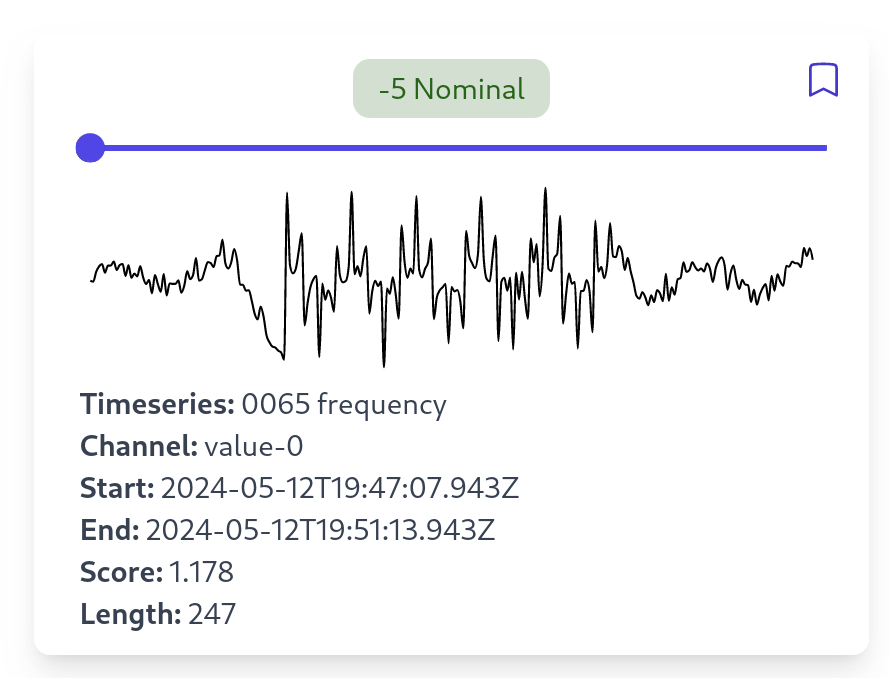
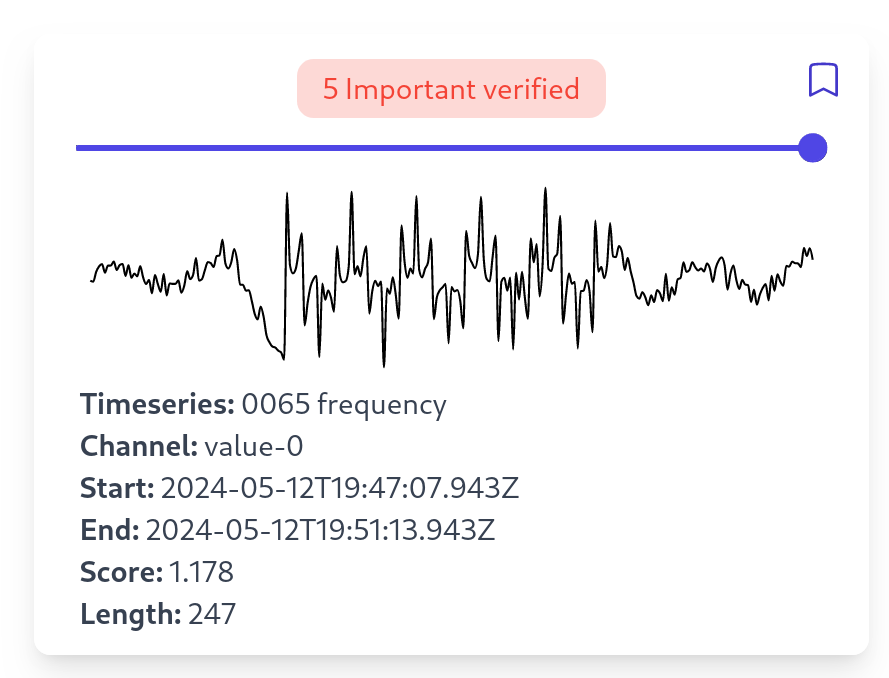
Manual Inspection
Exploring Anomalies
How do we gain an overview of all clusters?
Clustering!
Clustering Anomalies
Main features of AnoScout summarized
- Exploration pipeline for anomalies in time-oriented data.
- 7 algorithms for computing anomalies.
- "Playground" for testing various algorithms.
- Using user labels to fine-tune the system.
Application Scenario
- A company wants to install a new machine.
- The machine conducts an etching process (semiconductor manufacturing).
- Each etching process is recorded through a sensor (e.g. pressure, temperature, and gas)
- We want to use AnoScout to:
- Find possible anomaly patterns.
- Check which algorithms work well.
The Plan
Short Paper Track
Forecasting
How can we build a "sandbox" to explore forecasting models?
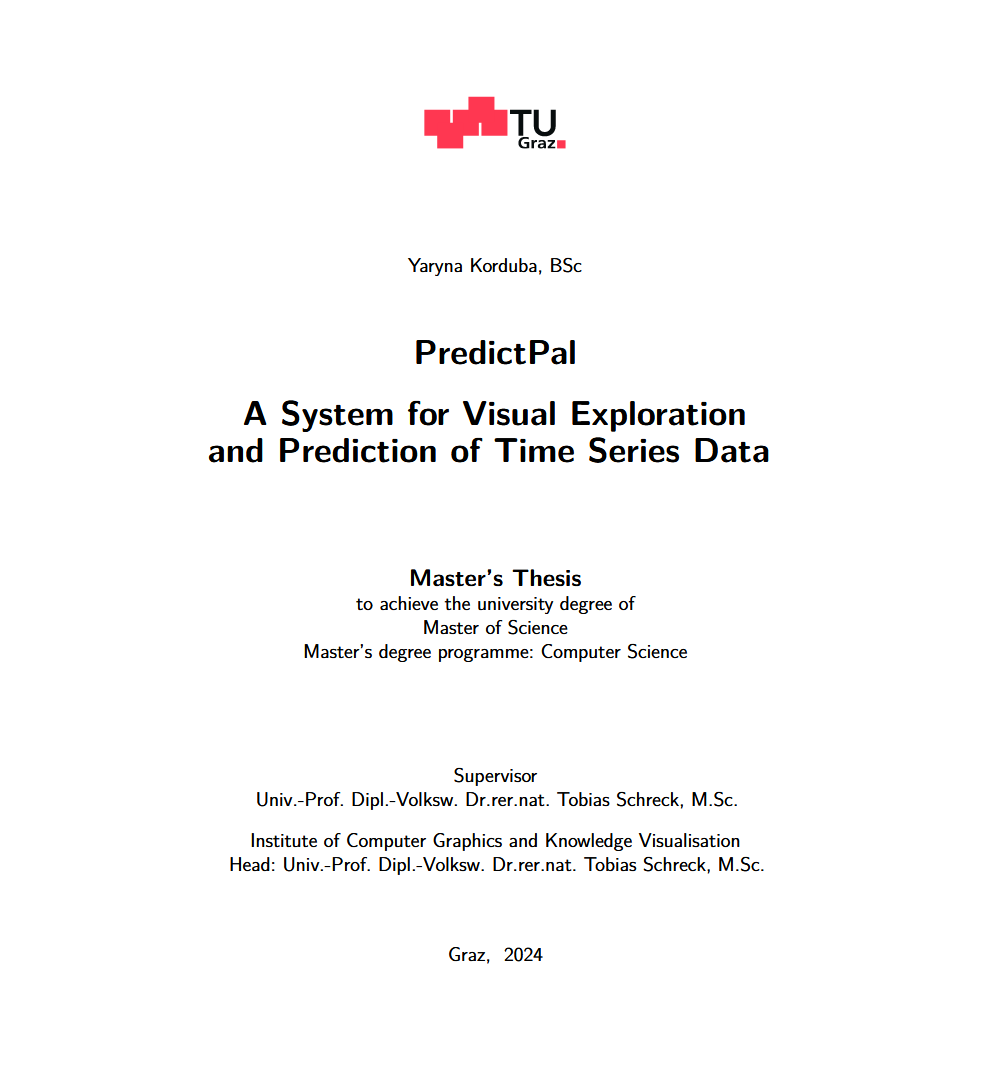
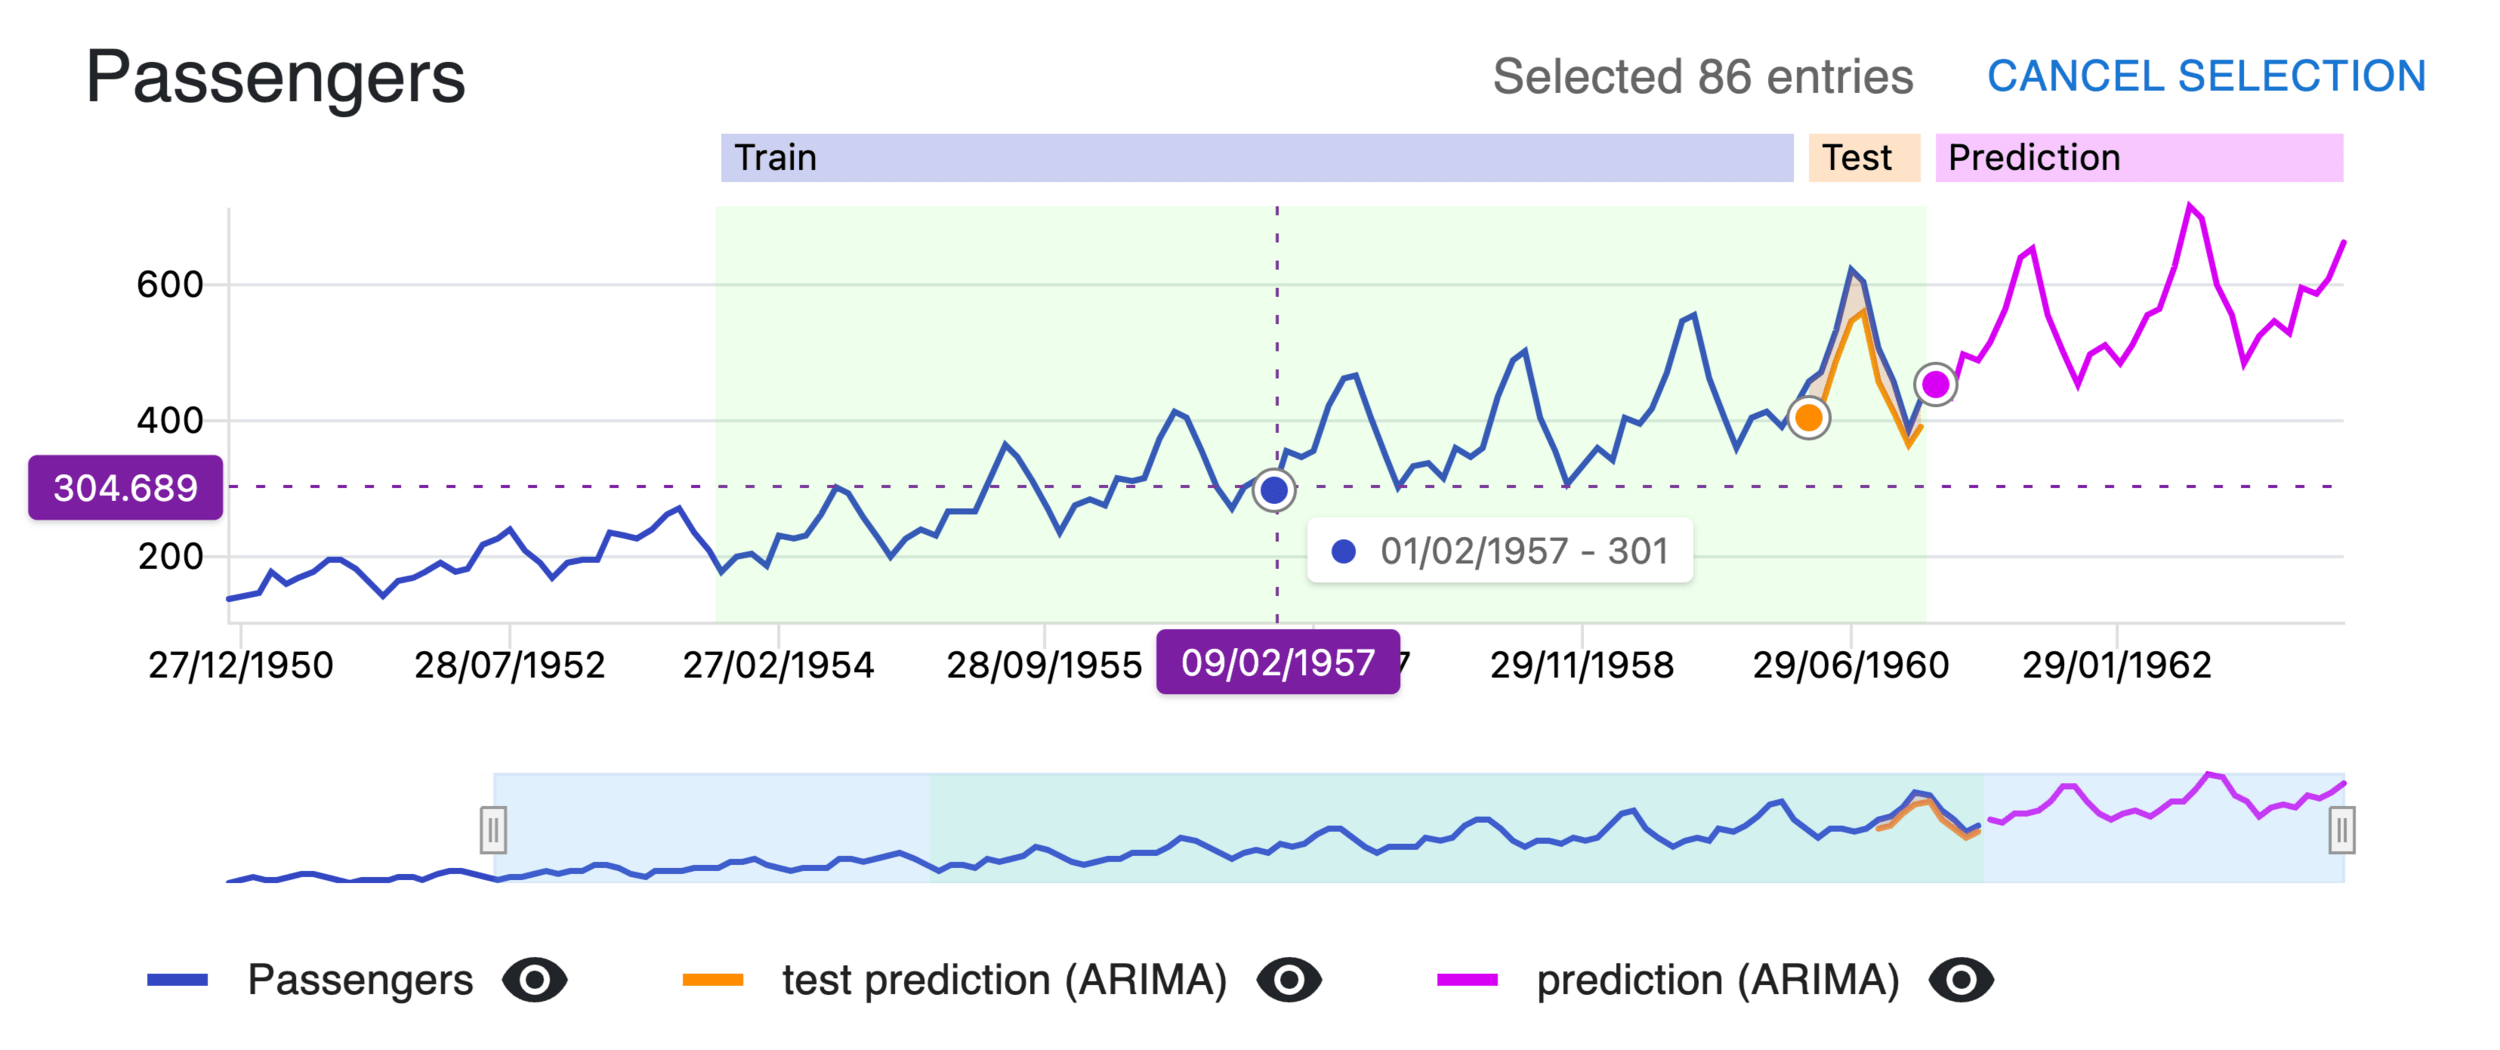
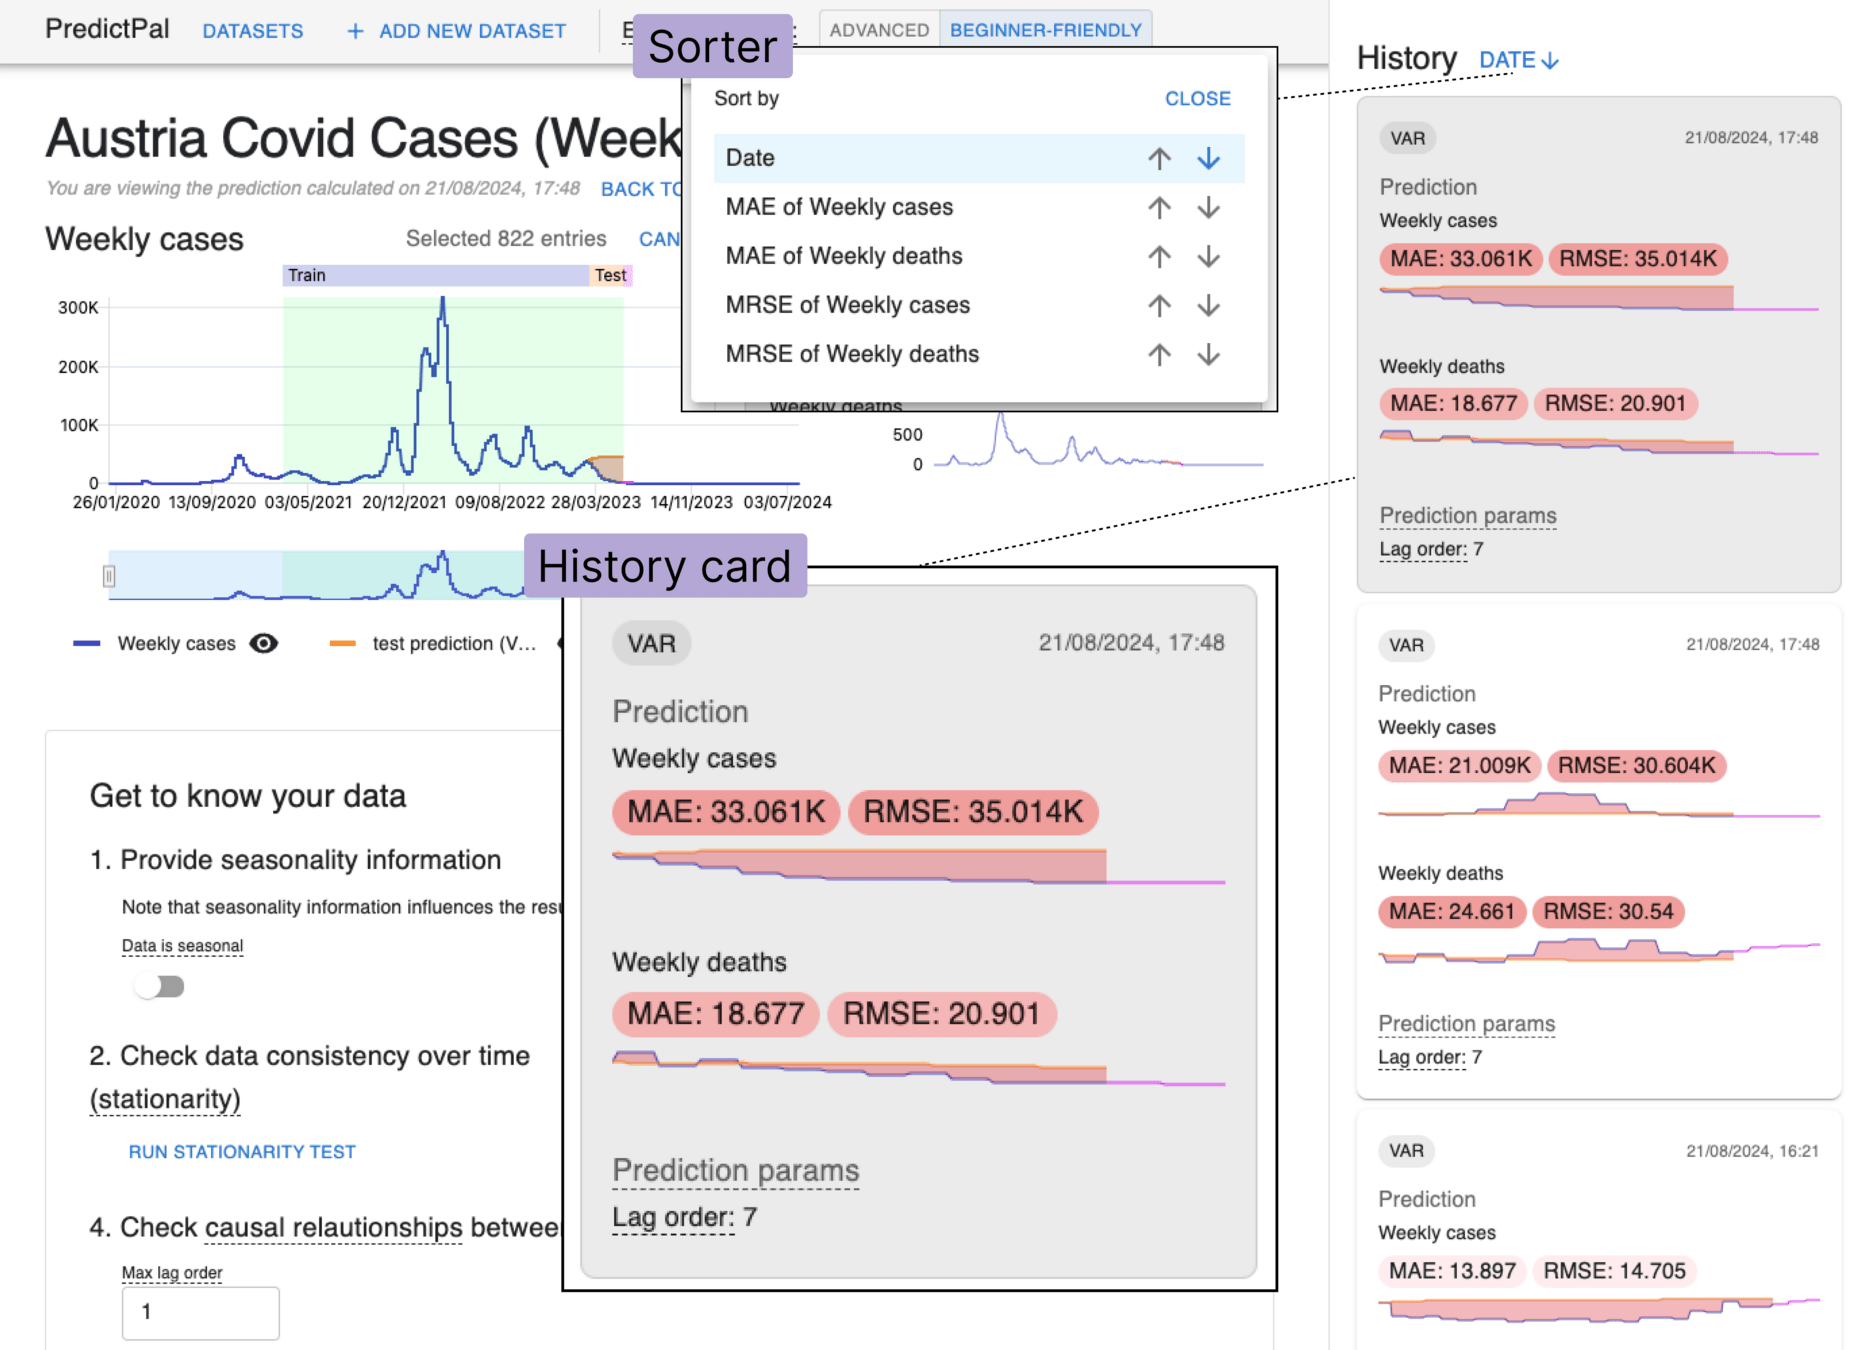
Introducing PredictPal
Prediction Models
ARIMA
AutoRegressive Integrated Moving Average
VAR
Vector Autoregression
Analysis View
History of Models
A municipal office worker John Doe needs to predict the traffic load at Intersection X
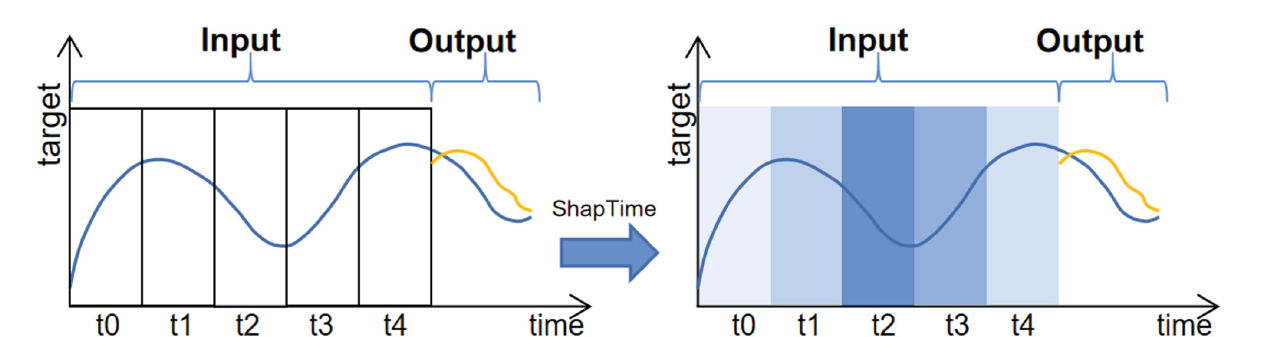
Towards XAI: ShapTime
Thank you!

Slides