How to read these slides?
 Overview
Click on the menu bar items to navigate to chapters
Click here for PDF version
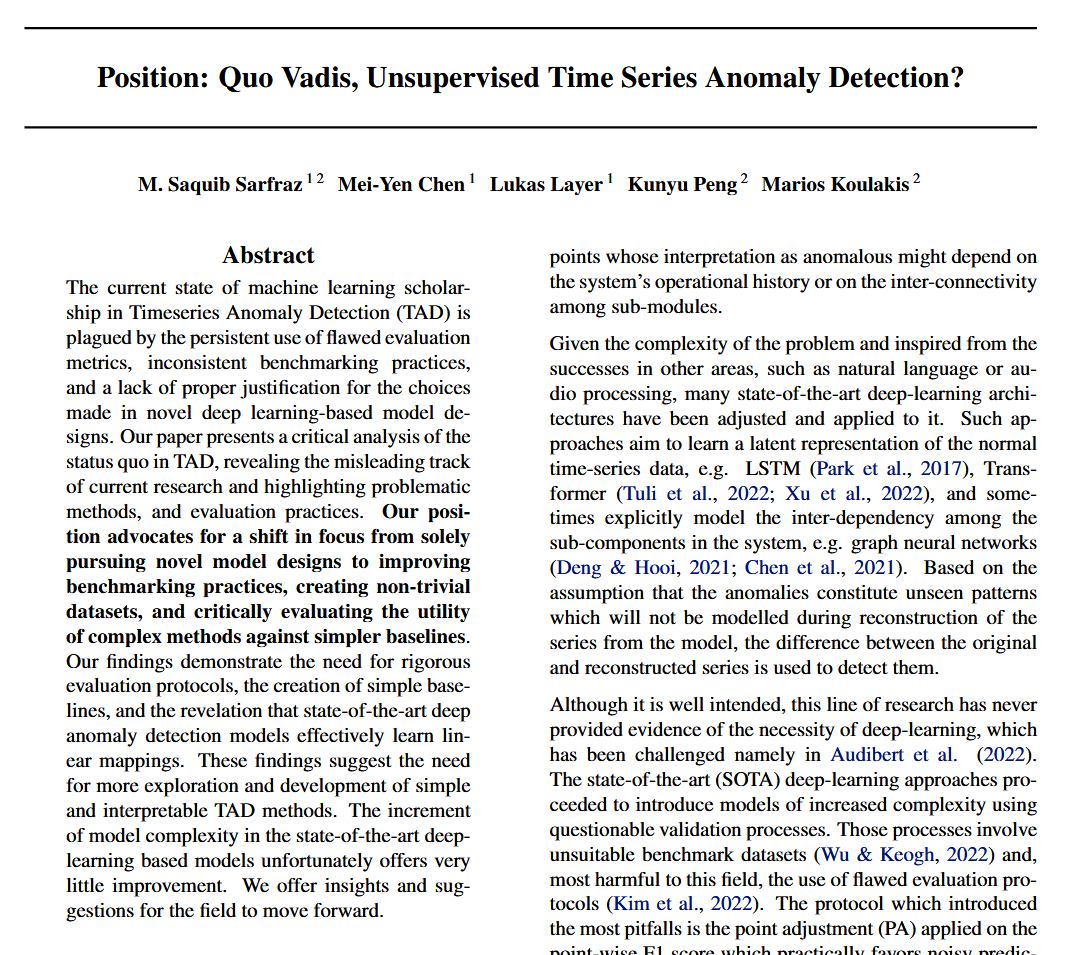
Journal Club
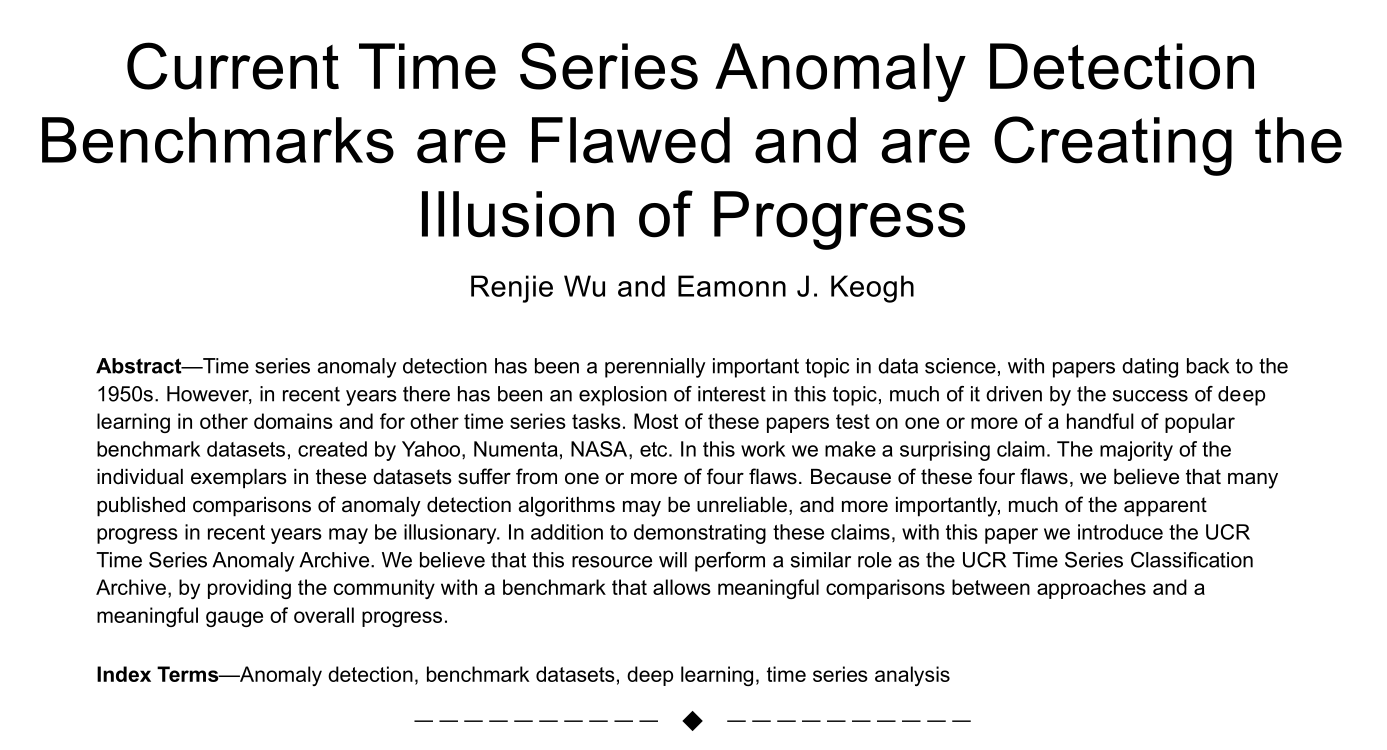
Current Time Series Anomaly Detection Benchmarks are Flawed and are Creating the Illusion of Progress
Julian Rakuschek
15.05.2025
Look at this time series
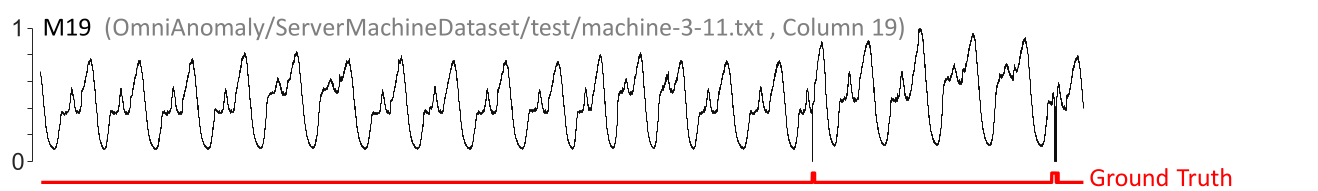
How would you detect these two anomalies?
Three one liners can detect them!
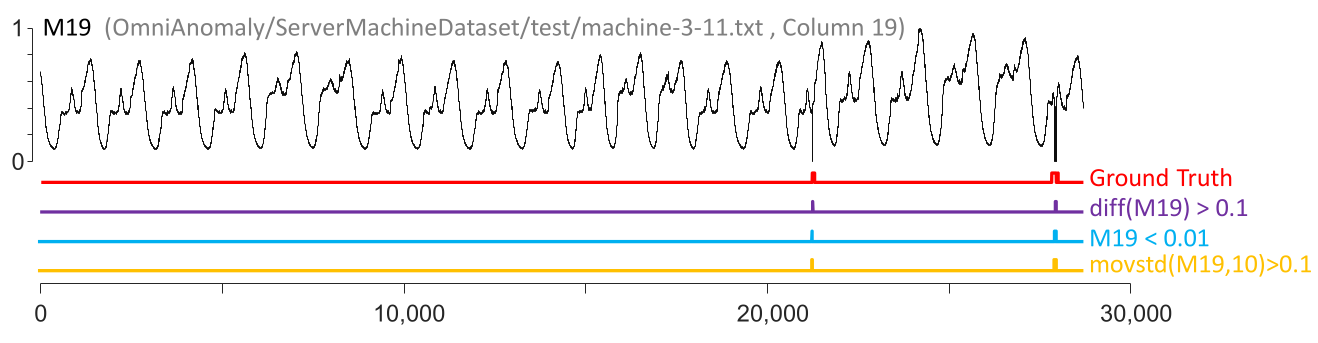
Would you train a deep neural network for this task? Hopefully not ...
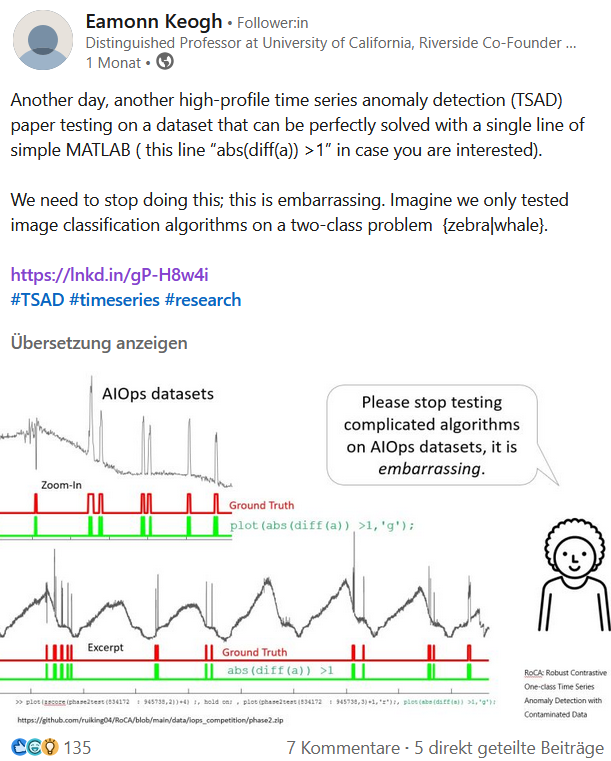
But people actually do that!
Novel anomaly detector for time-series KPIs based on supervised deep-learning models with convolution and long short-term memory (LSTM) neural networks, and a variational auto-encoder (VAE) oversampling model.

And they compare their algorithms on these kinds of anomalies!

This creates an Illusion of Progress!
What are these Flaws?
Trivial Anomalies
Given the following universal one-liners
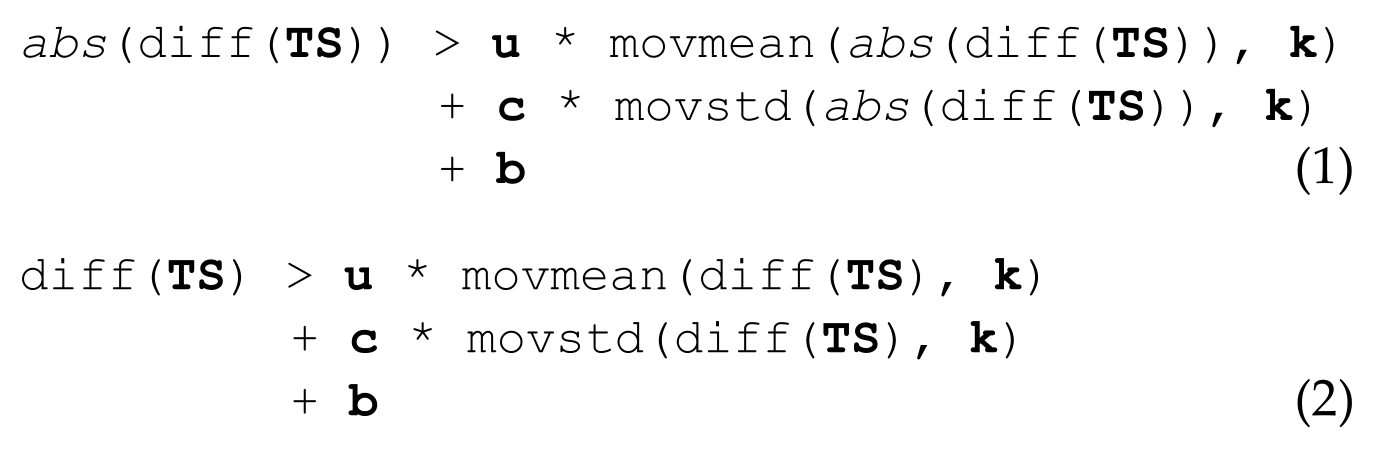
the authors achieved $86.1\%$ accuracy on the YAHOO benchmark.
This is as best as it can get due to another problem ...
Mislabeled Ground Truth
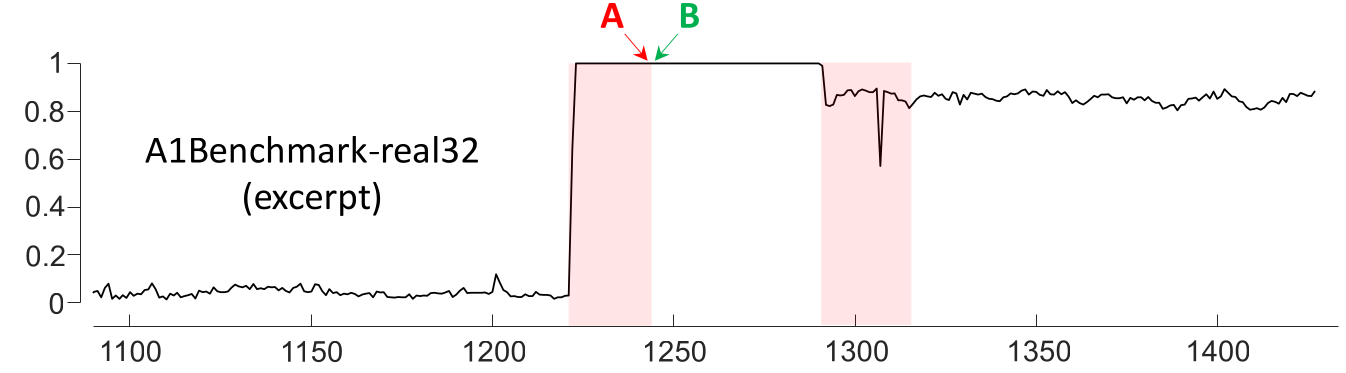
Algorithms pointing to B will be penalized,
although nothing changed from one point to the next
Mislabeled Ground Truth
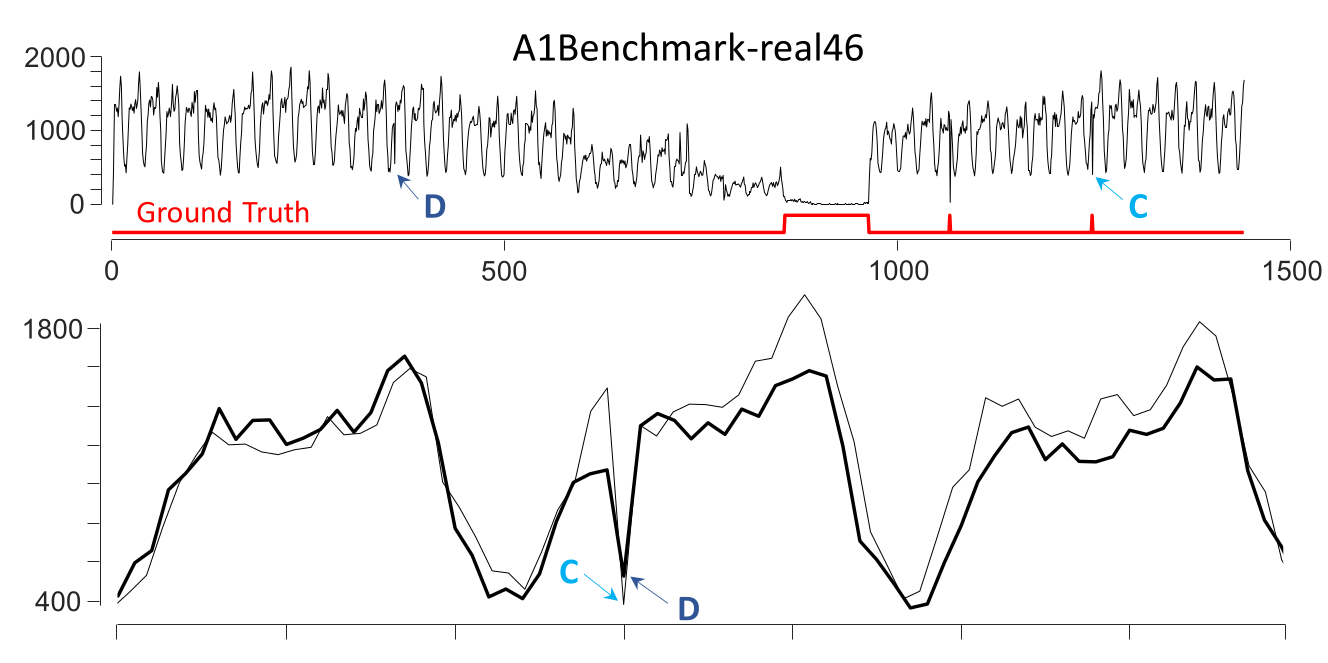
Regions C and D are very similar. One is labeled as an anomaly while the other is not.
Unrealistic Anomaly Density
- For some examples, more than half the test data exemplars consist of a contiguous region marked as anomalies.
- This blurs the line between classification and anomaly detection.
- Anomalies are supposed to be rare!
- Recommendation: One anomaly per test time series.
Anomaly Location Bias
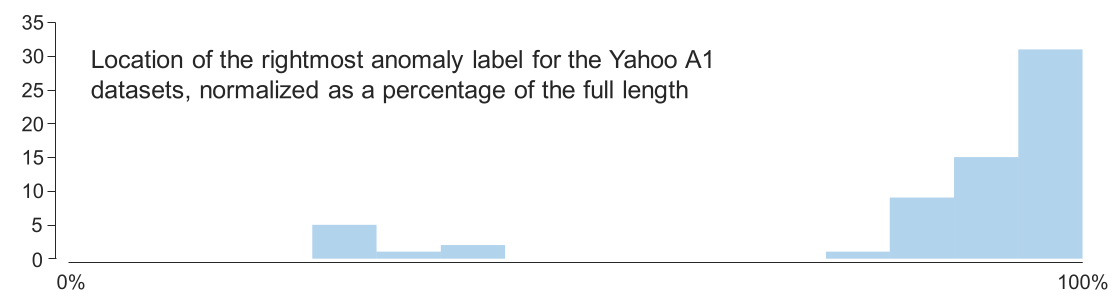
Location of anomalies not randomly distributed!
Did people learn from it?
Nope
Nope x 3


What should we do?
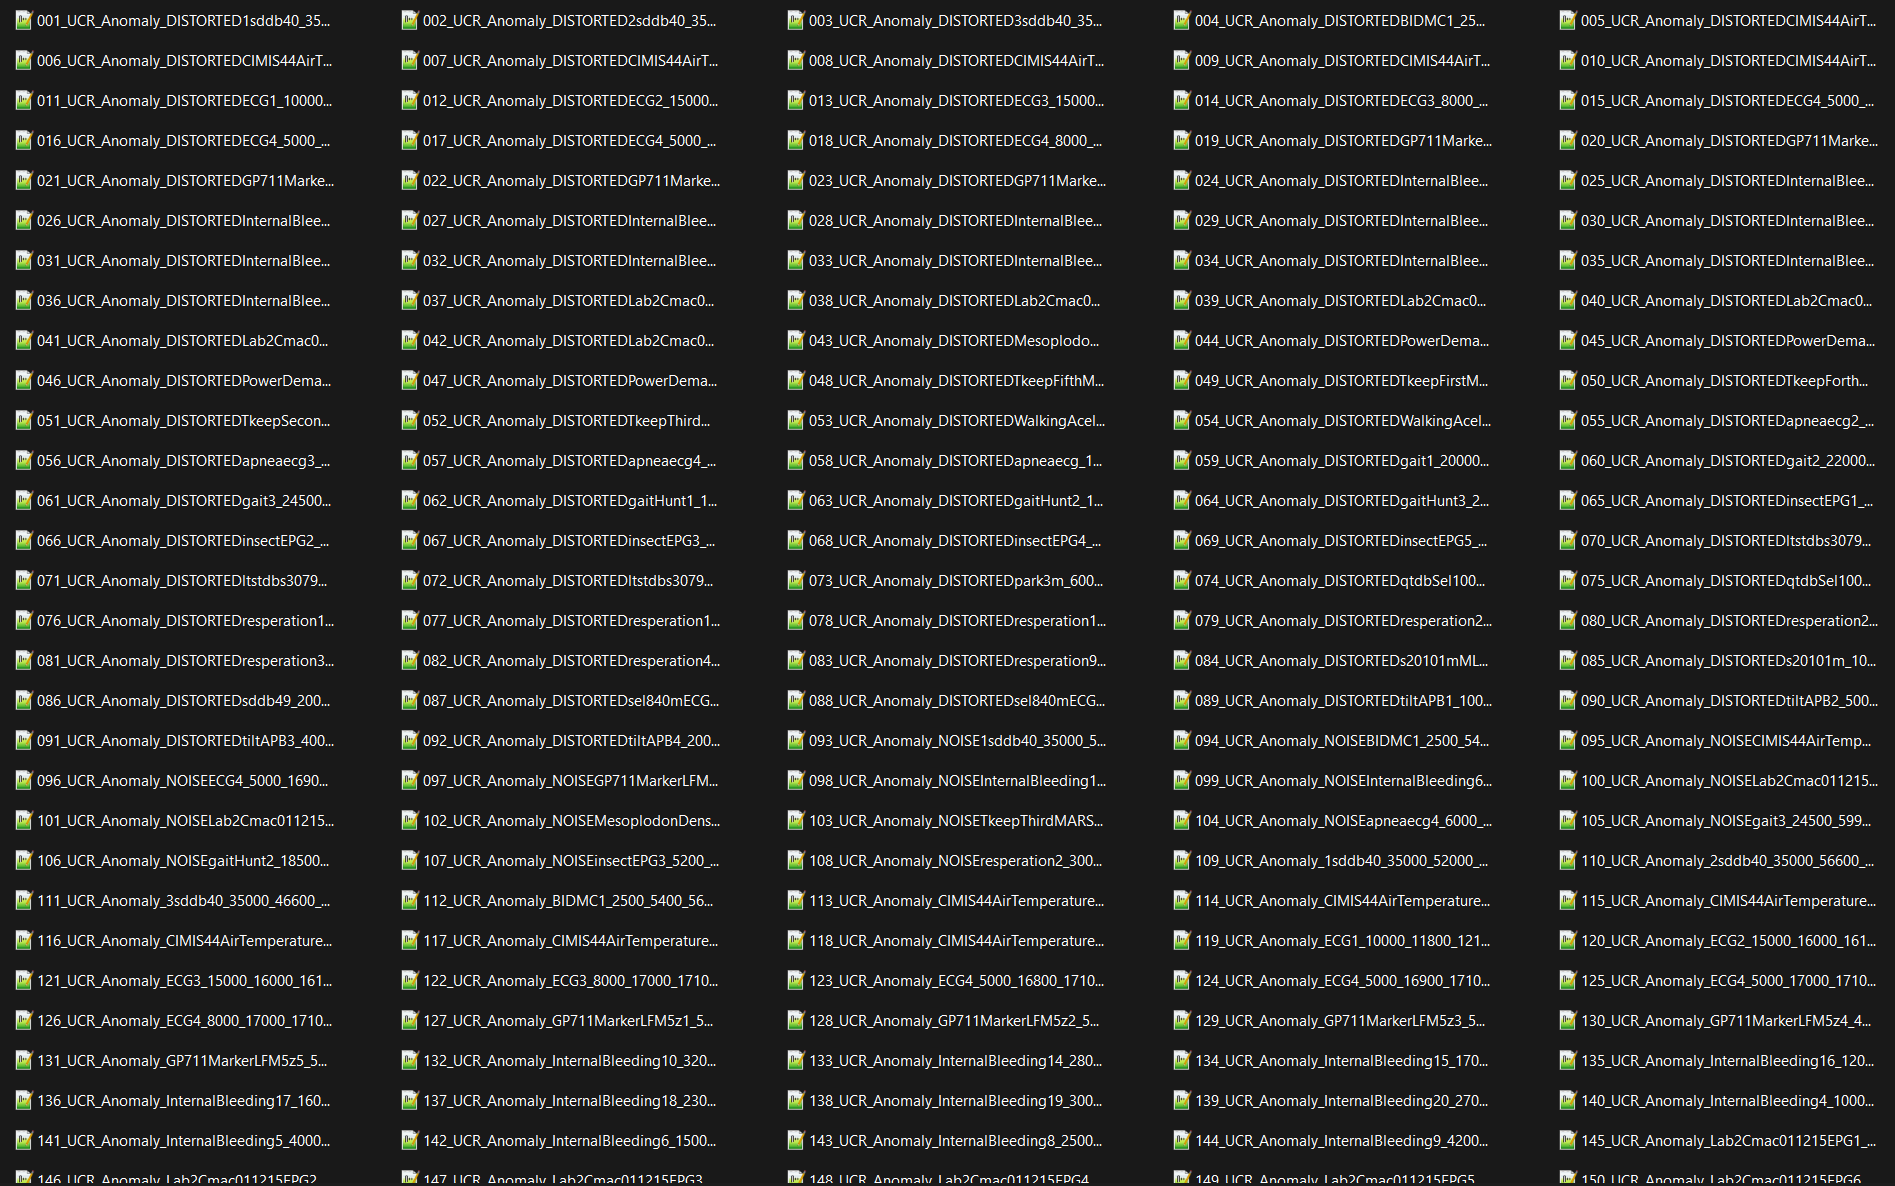
Test on the UCR Archive
Fair Presentation of Results
- Explain limitations
- Visualize your data and the algorithm results
- Use an appropriate scoring function