How to read these slides?
 Overview
Click on the menu bar items to navigate to chapters
Click here for PDF version
Guided Visual Analysis of Time Series Data
with Spiral Views and View Quality Measures
Stefanie Stoppacher, Julian Rakuschek,
Tobias Schreck
02.06.2025 - EuroVA
Given a long time series
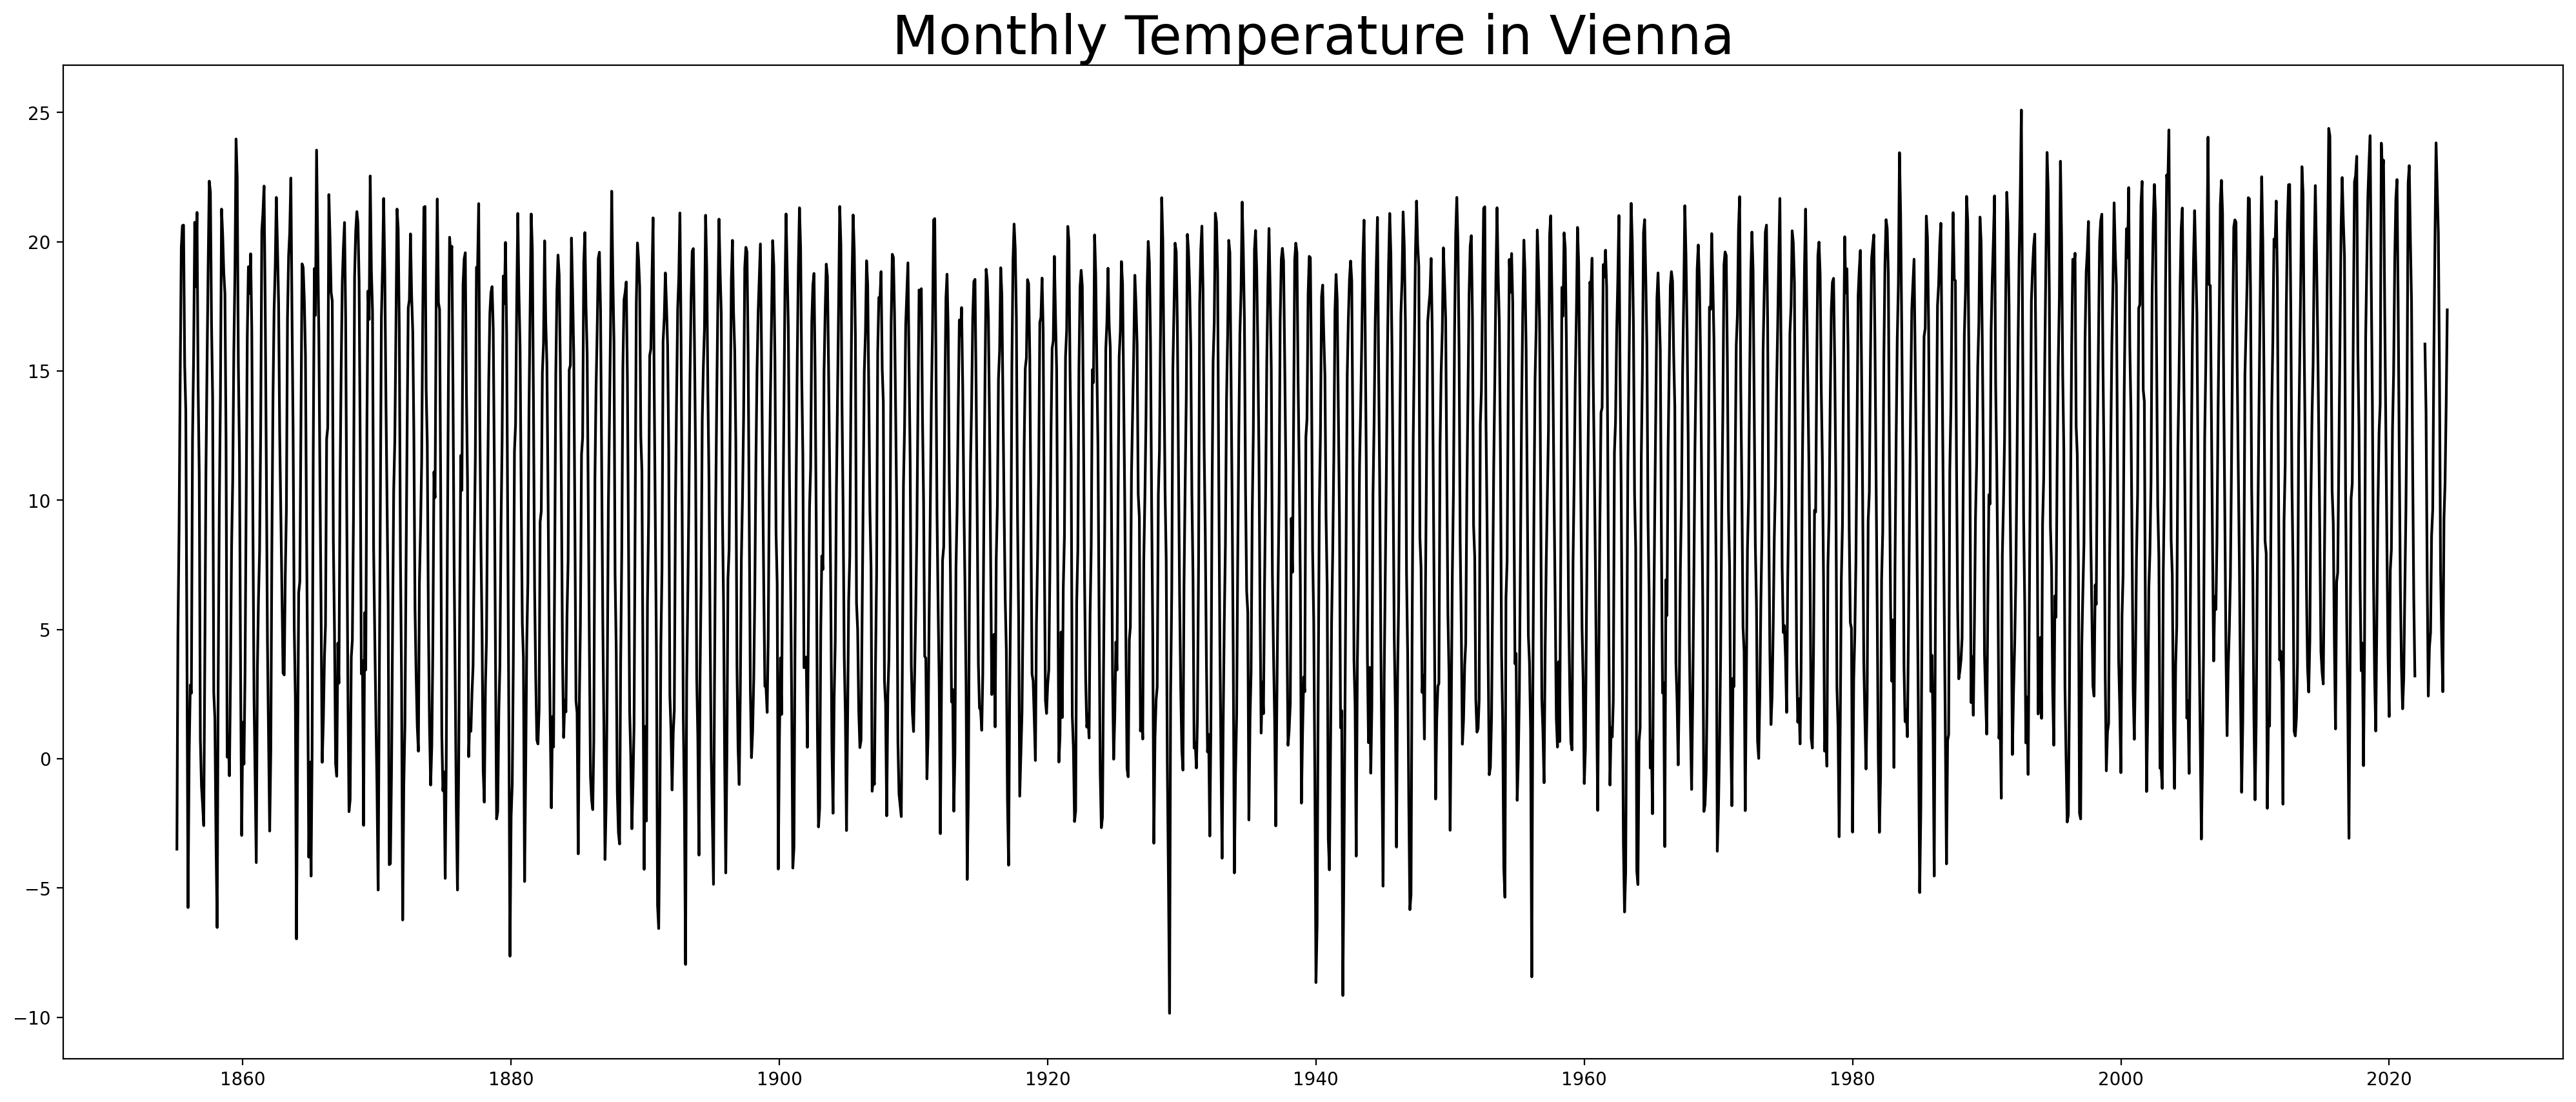
Hard to spot repeating patterns through a line chart.
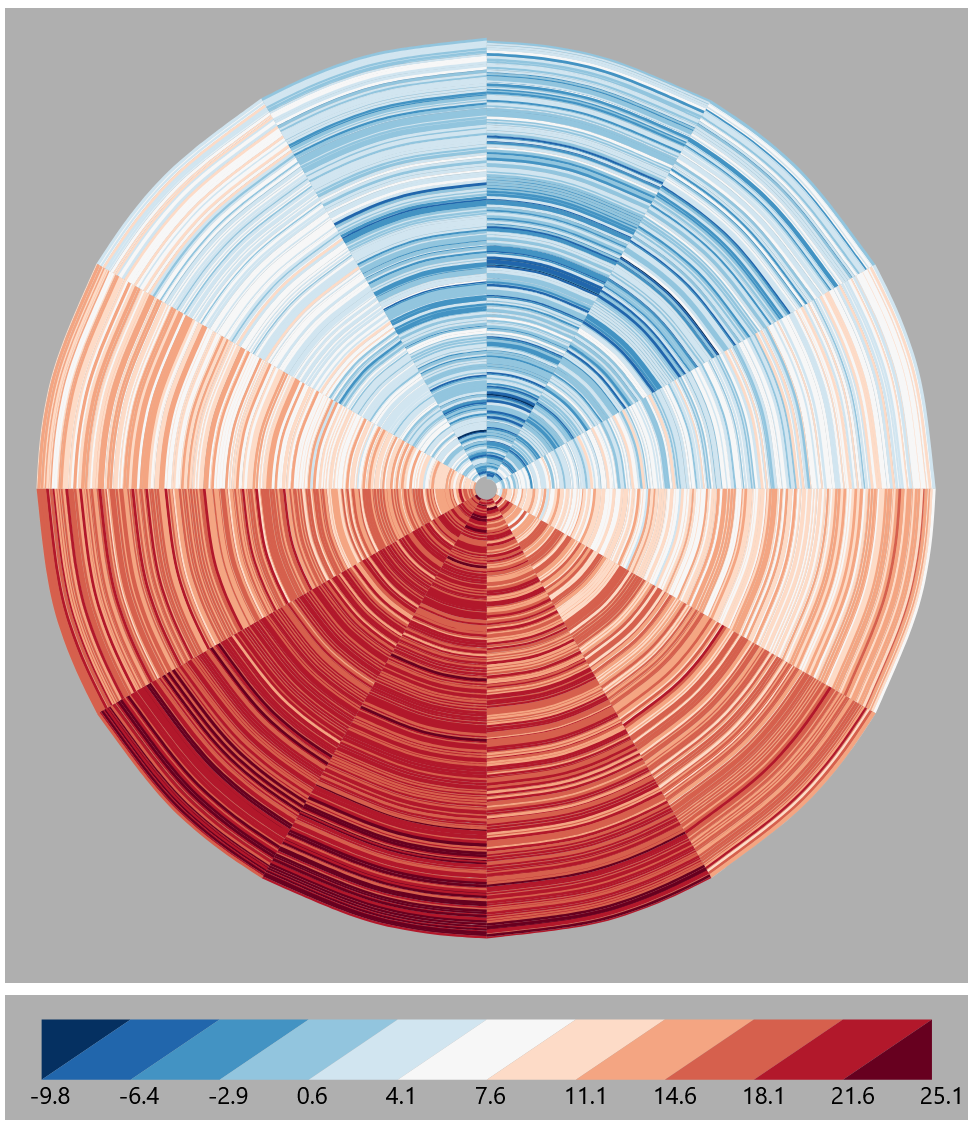
Alternative Visualization: Spirals
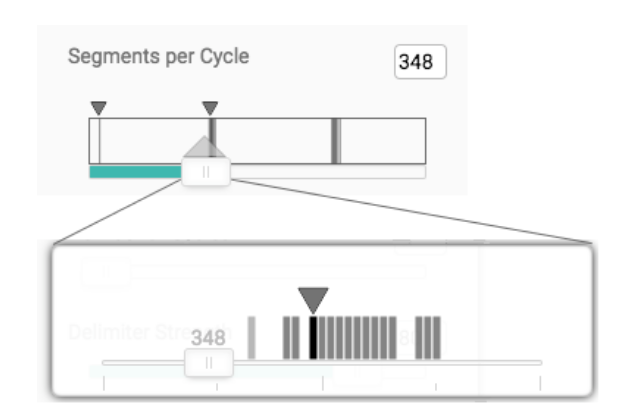
Not every number of segments per cycle is meaningful
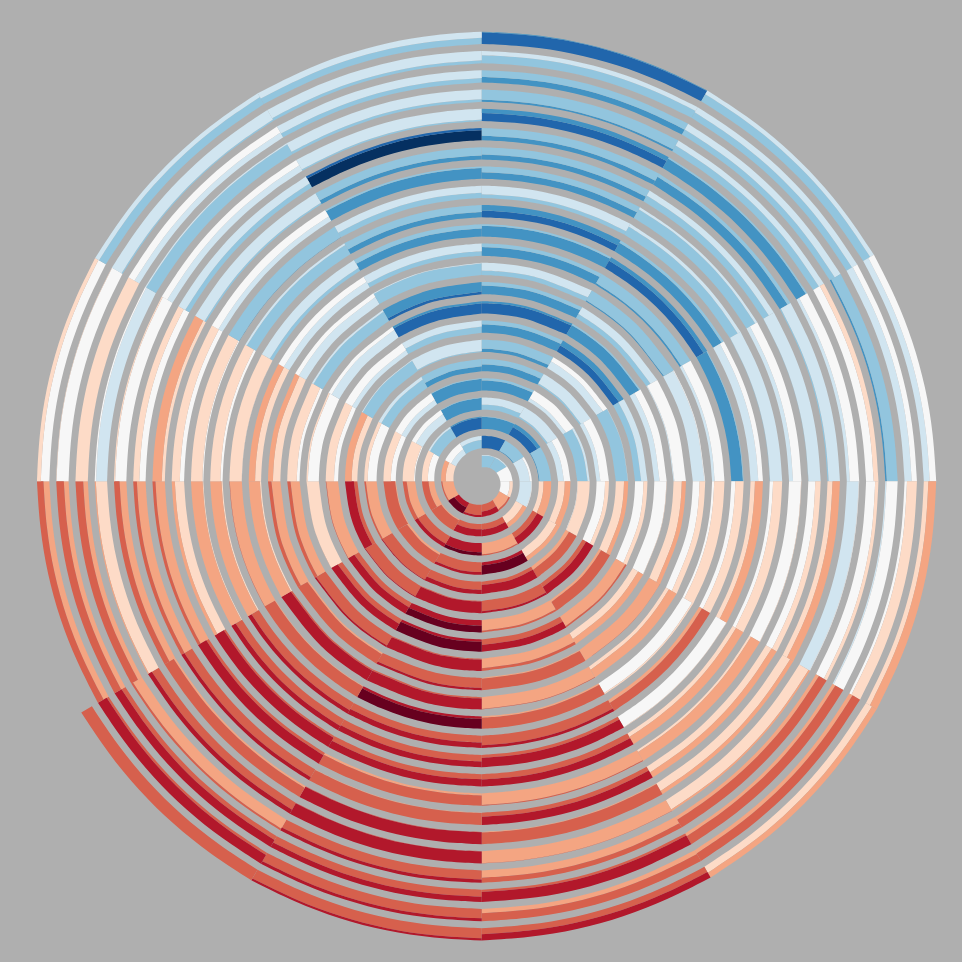 12 segments per cycle
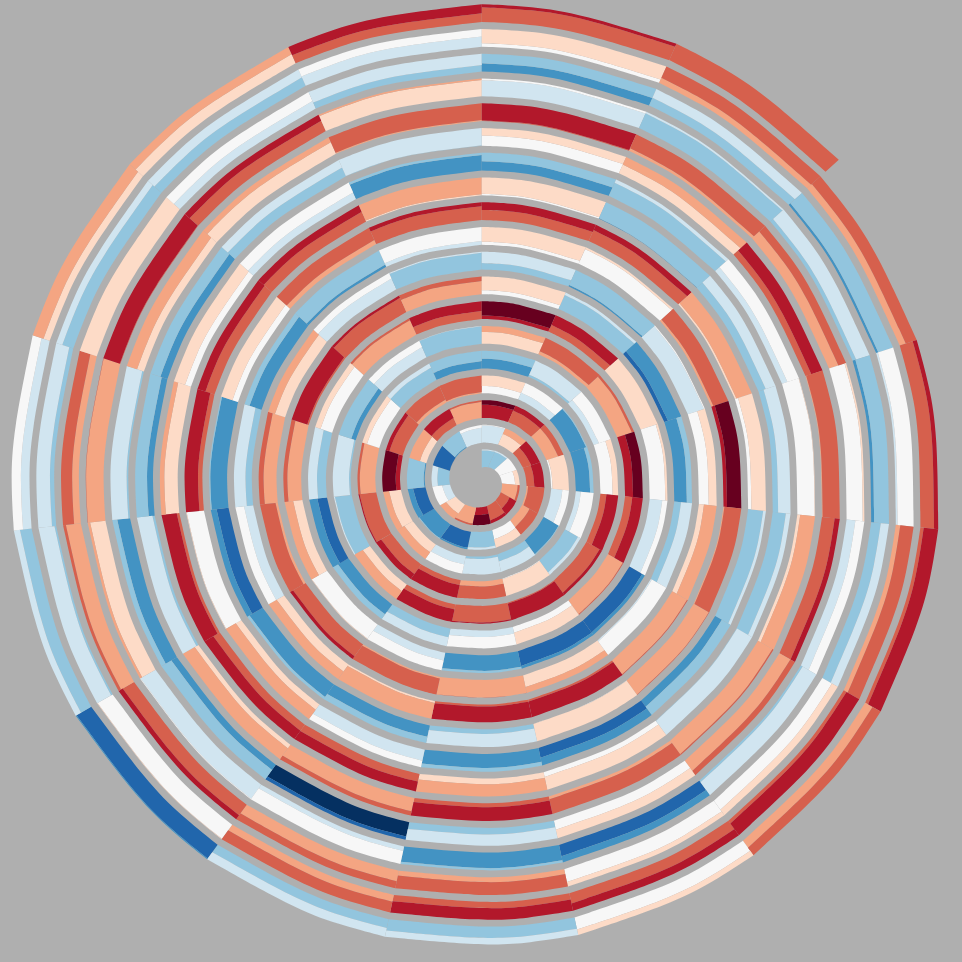 15 segments per cycle
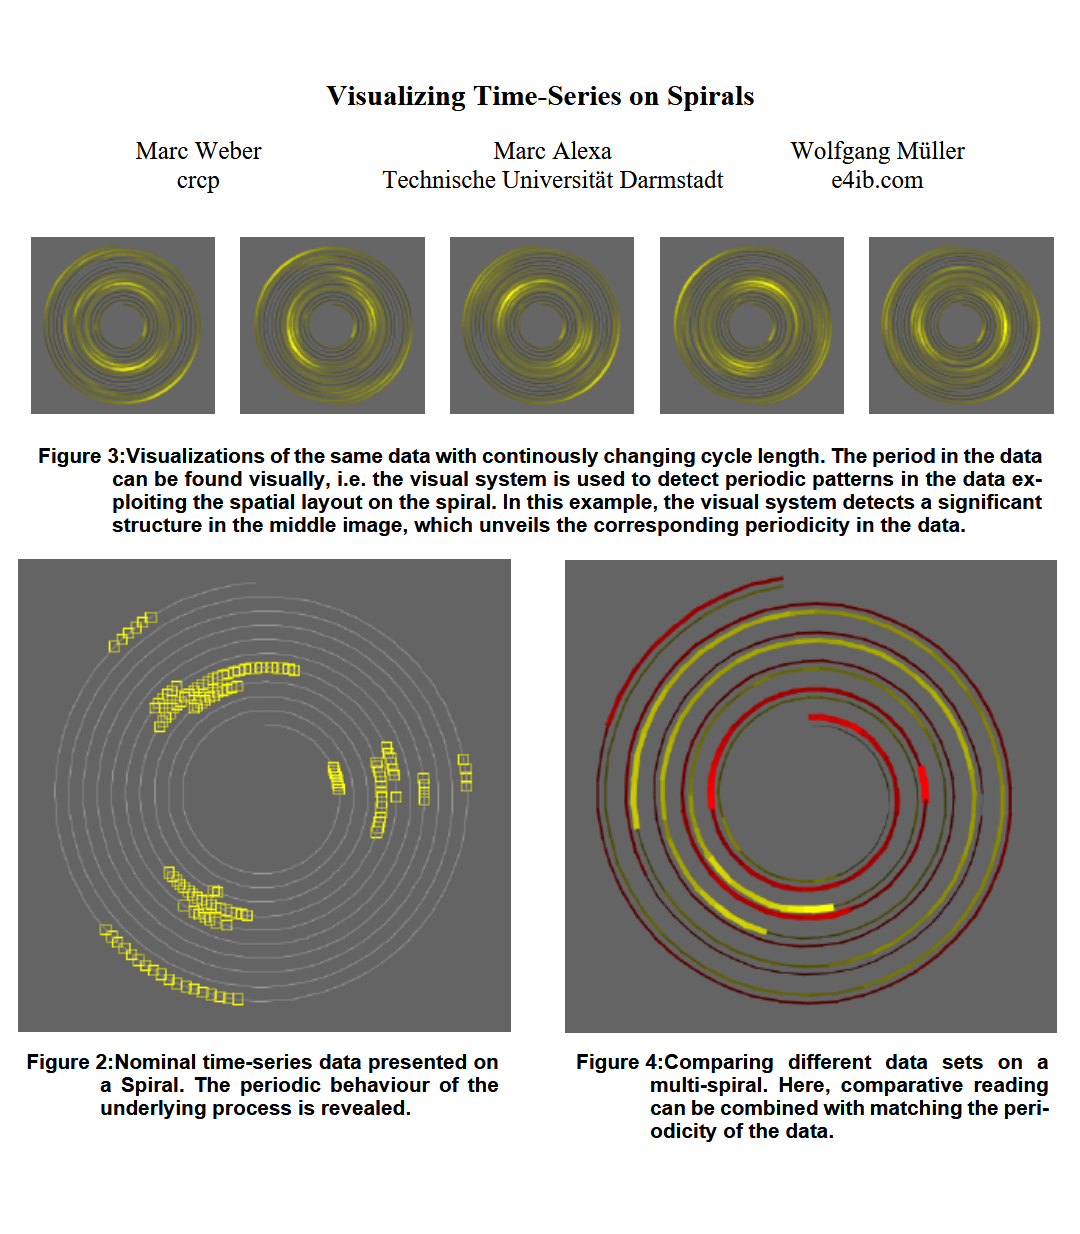
How to find a good alignment? Guidance!
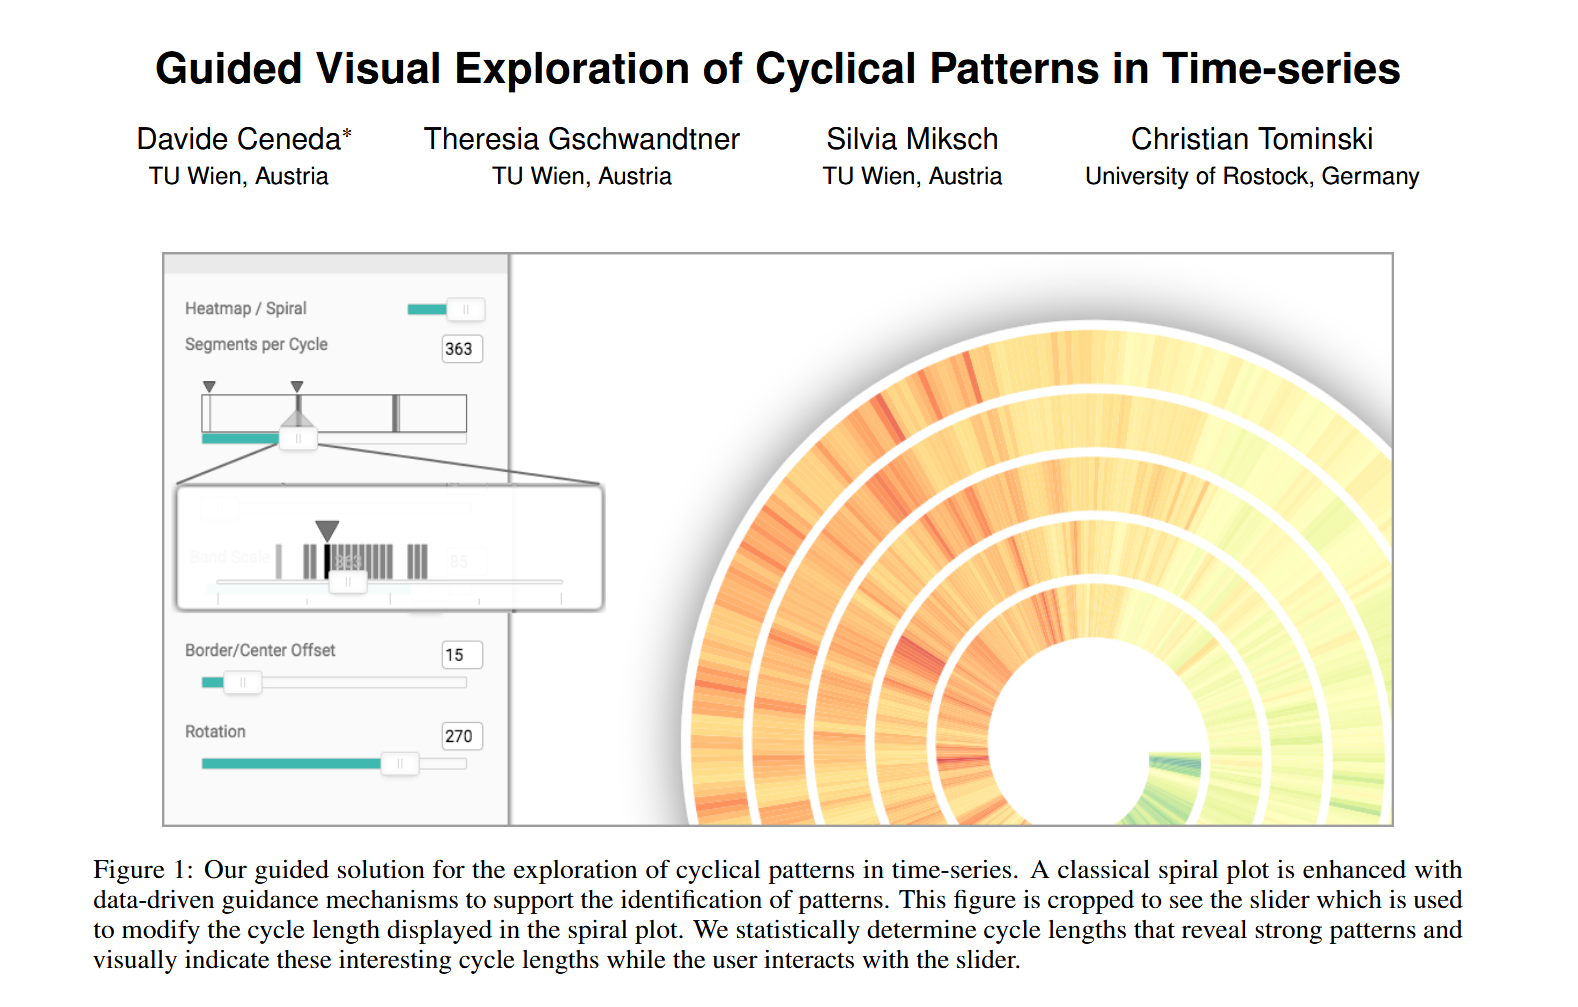
How does it work?
1. Algorithmically determine
cyclical phenomena
- Discrete Fourier Transform (DFT)
- Chi Square Periodogram (CSP)
2. Provide Visual Cues
Once aligned, we can compare cycles within a sector
Do segments within a sector change over time?
How do segments compare with neighboring segments?
Can we effectively guide users towards interesting sectors?
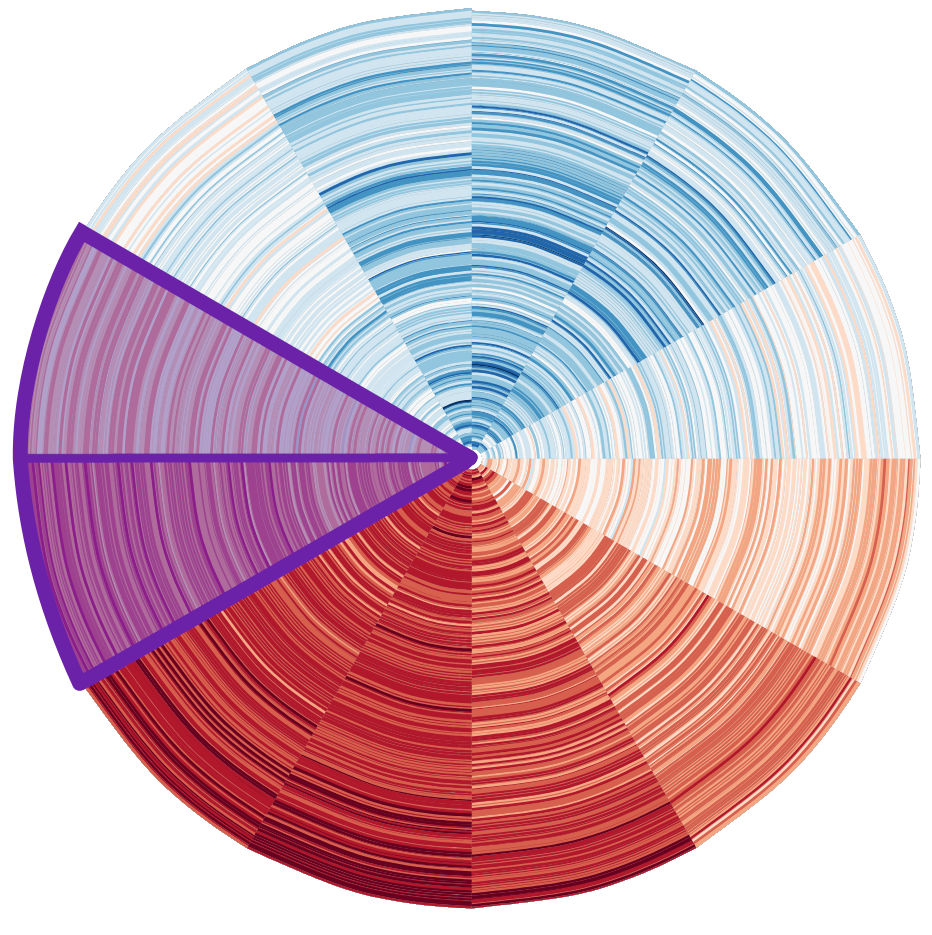
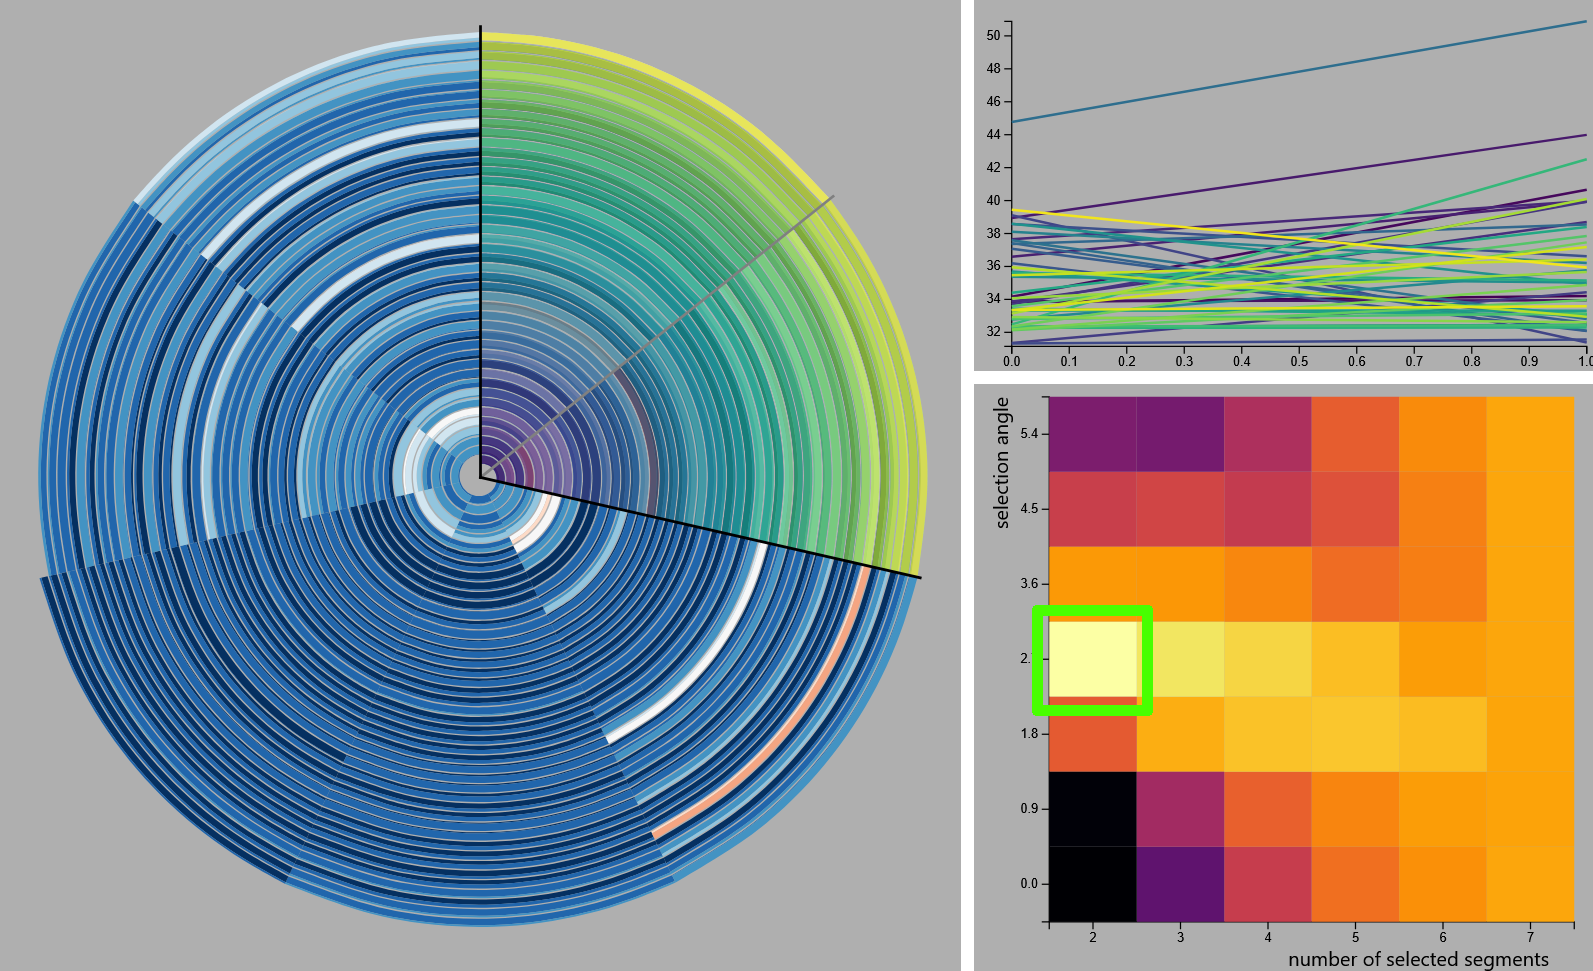
Selecting Sectors of the Spiral
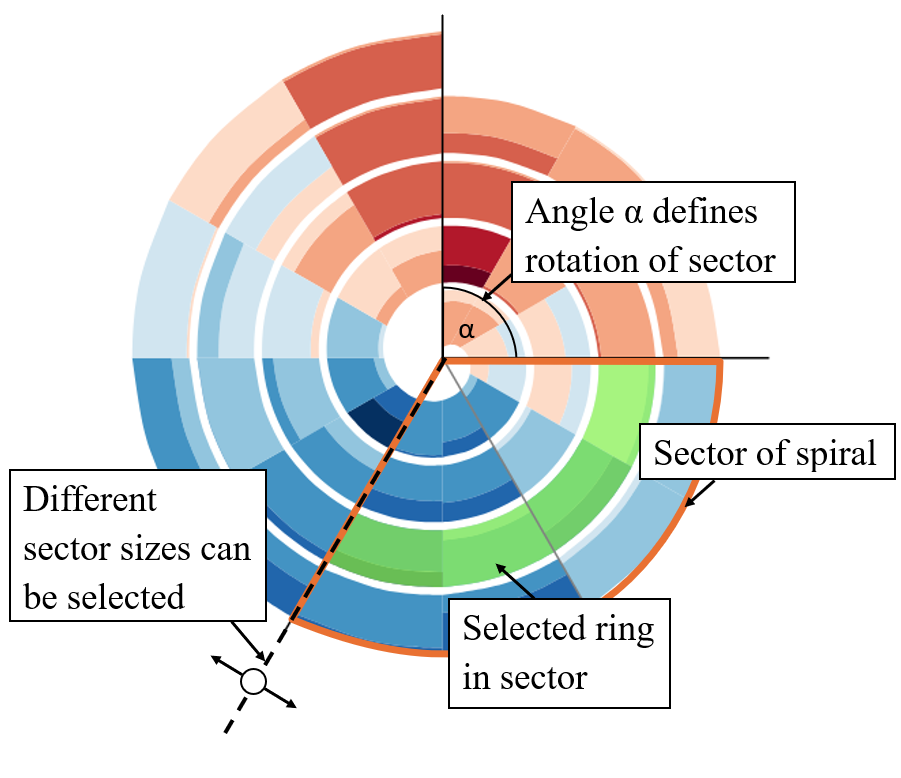
Interactive Sector Selection
What makes a sector interesting?
- Similarity between cycles
- Monotonicity behavior
- Change of values of over time
Quantifying these properties through quality measures
Monotonicity
- Select a sector
- For each cycle in the sector:
- Count number of consecutively increasing elements
- Normalize by cycle length
- Average all cycle monotonicity scores to attain sector score
Dissimilarity
- Select a sector
- Compute pairwise Euclidean distance / DTW between all cycles (excluding self similarity)
- Compute average distance
Visualization via heatmaps
We compute these quality measures for each sector configuration
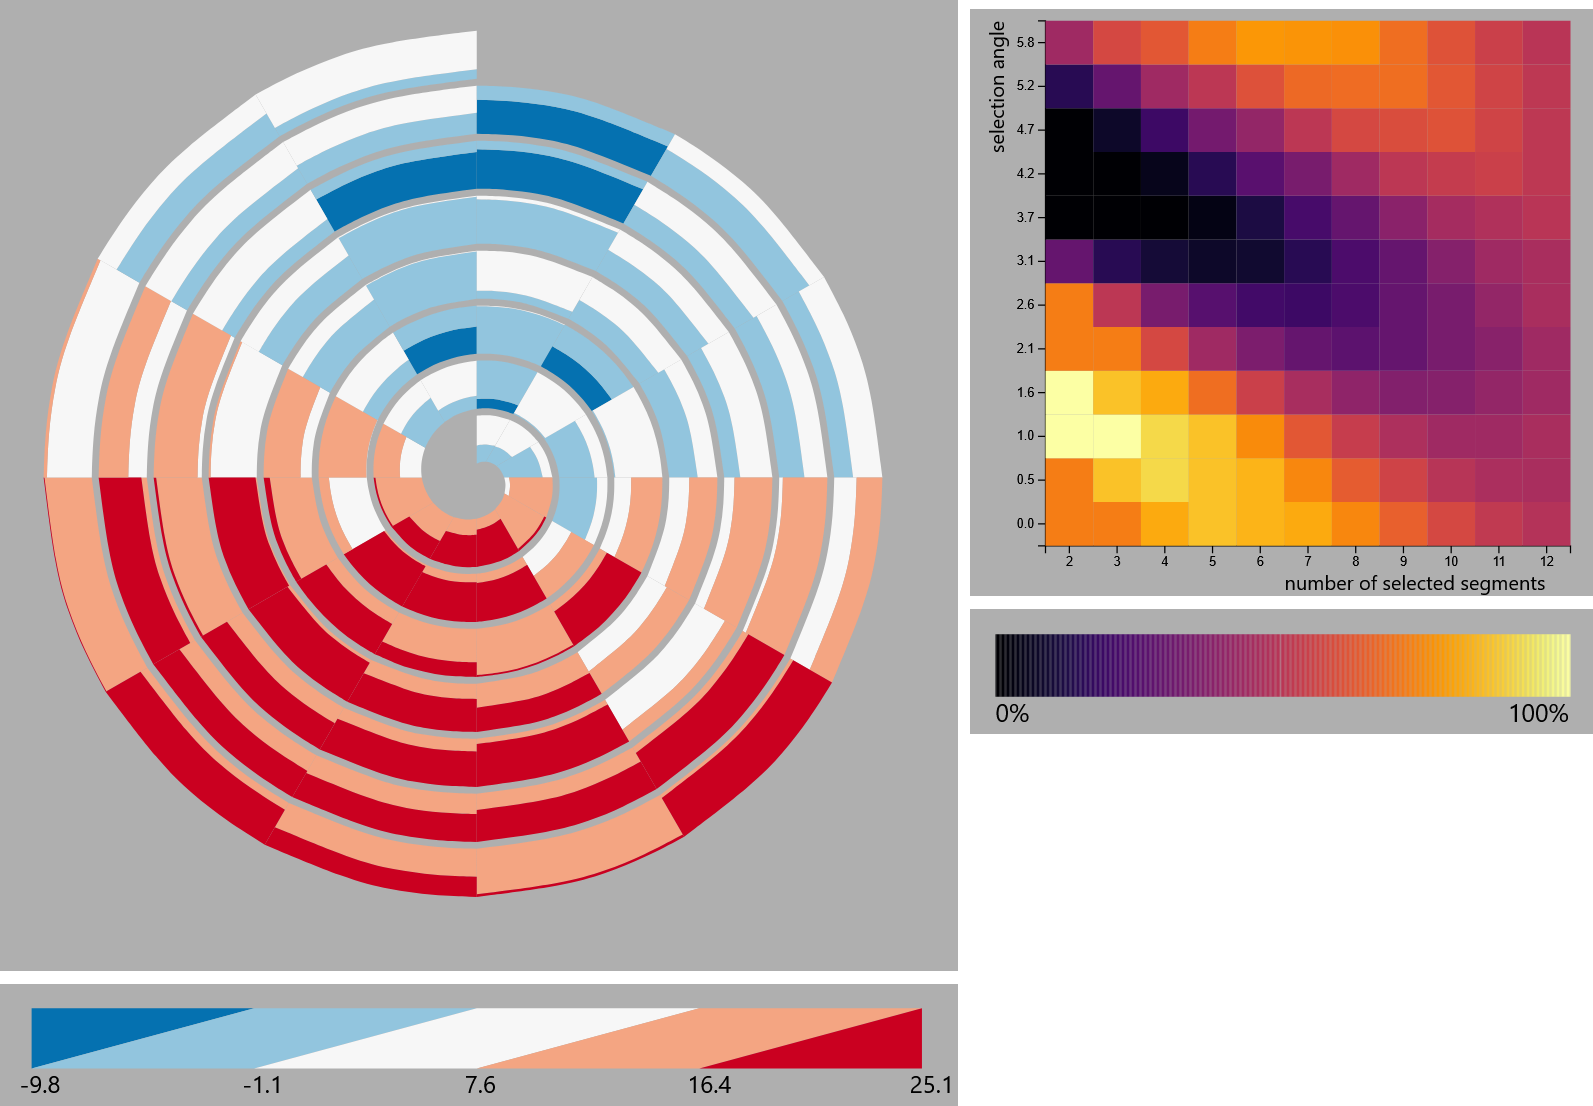
The heatmaps are fully interactive
What are the benefits of this guidance approach?
Outliers may distort the color mapping

We recorded the sound level in our seminar room
Guidance unaffected
Euclidean Distance - Weekends rather quiet
Guidance unaffected
Euclidean Distance - During week rather busy
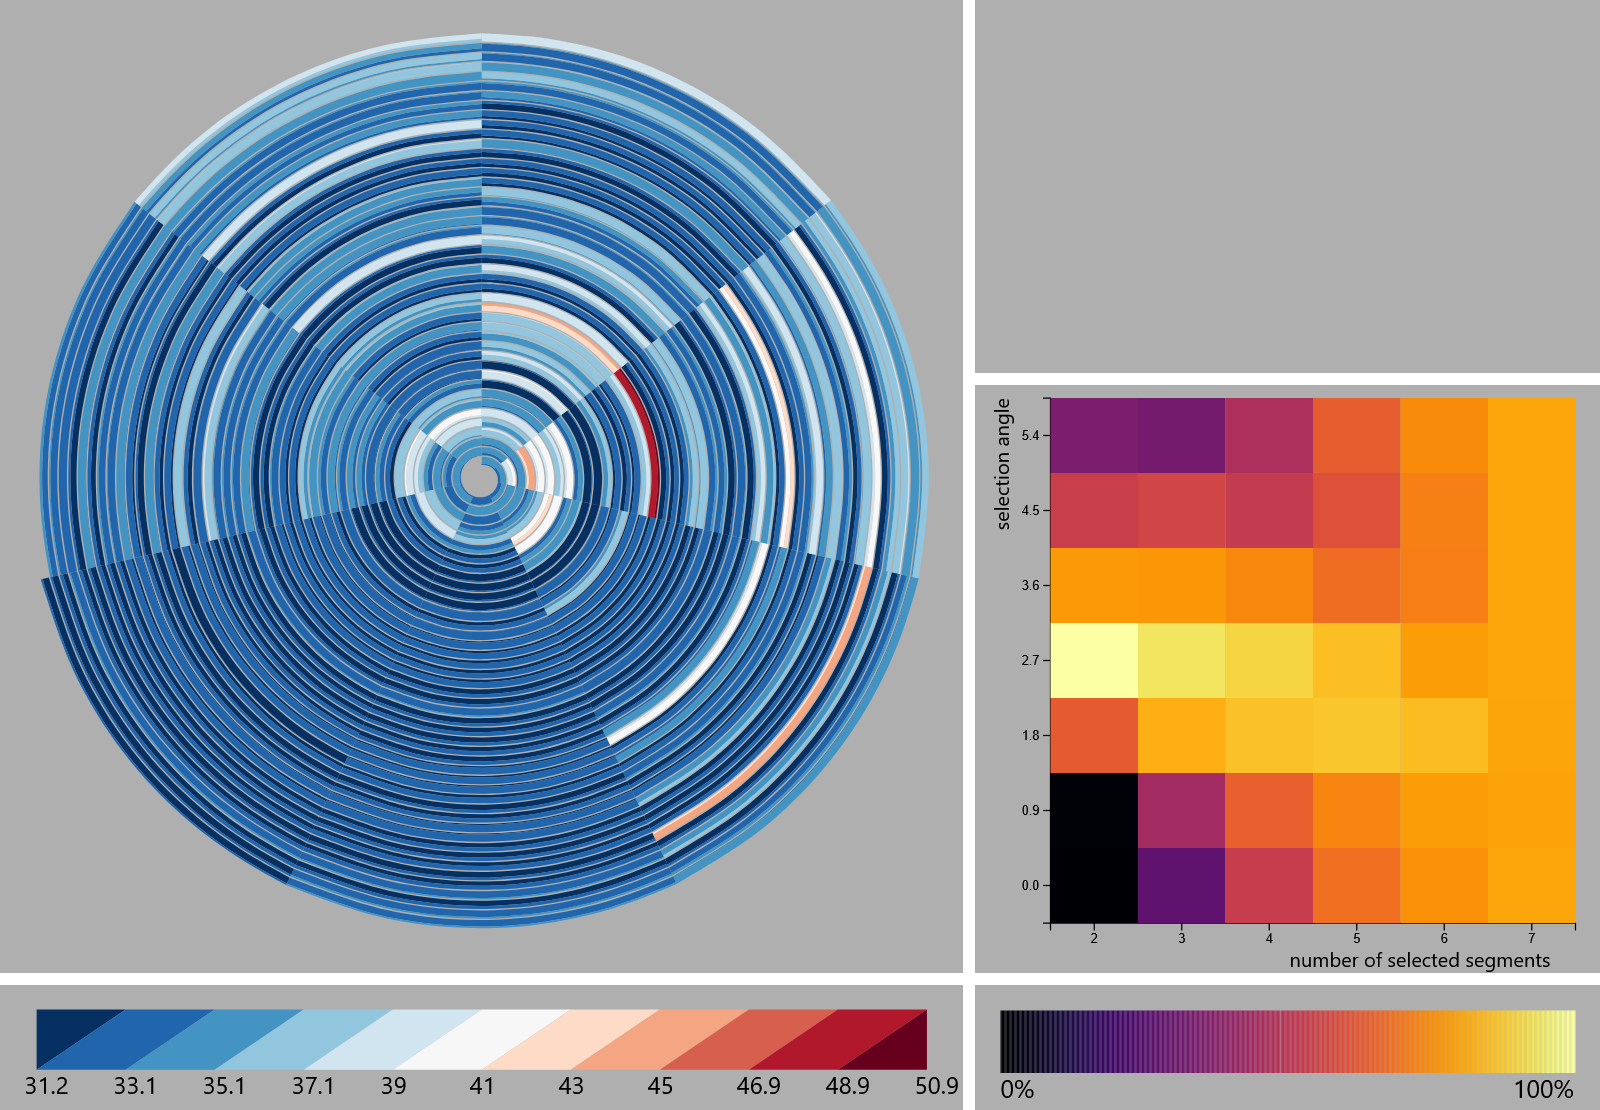
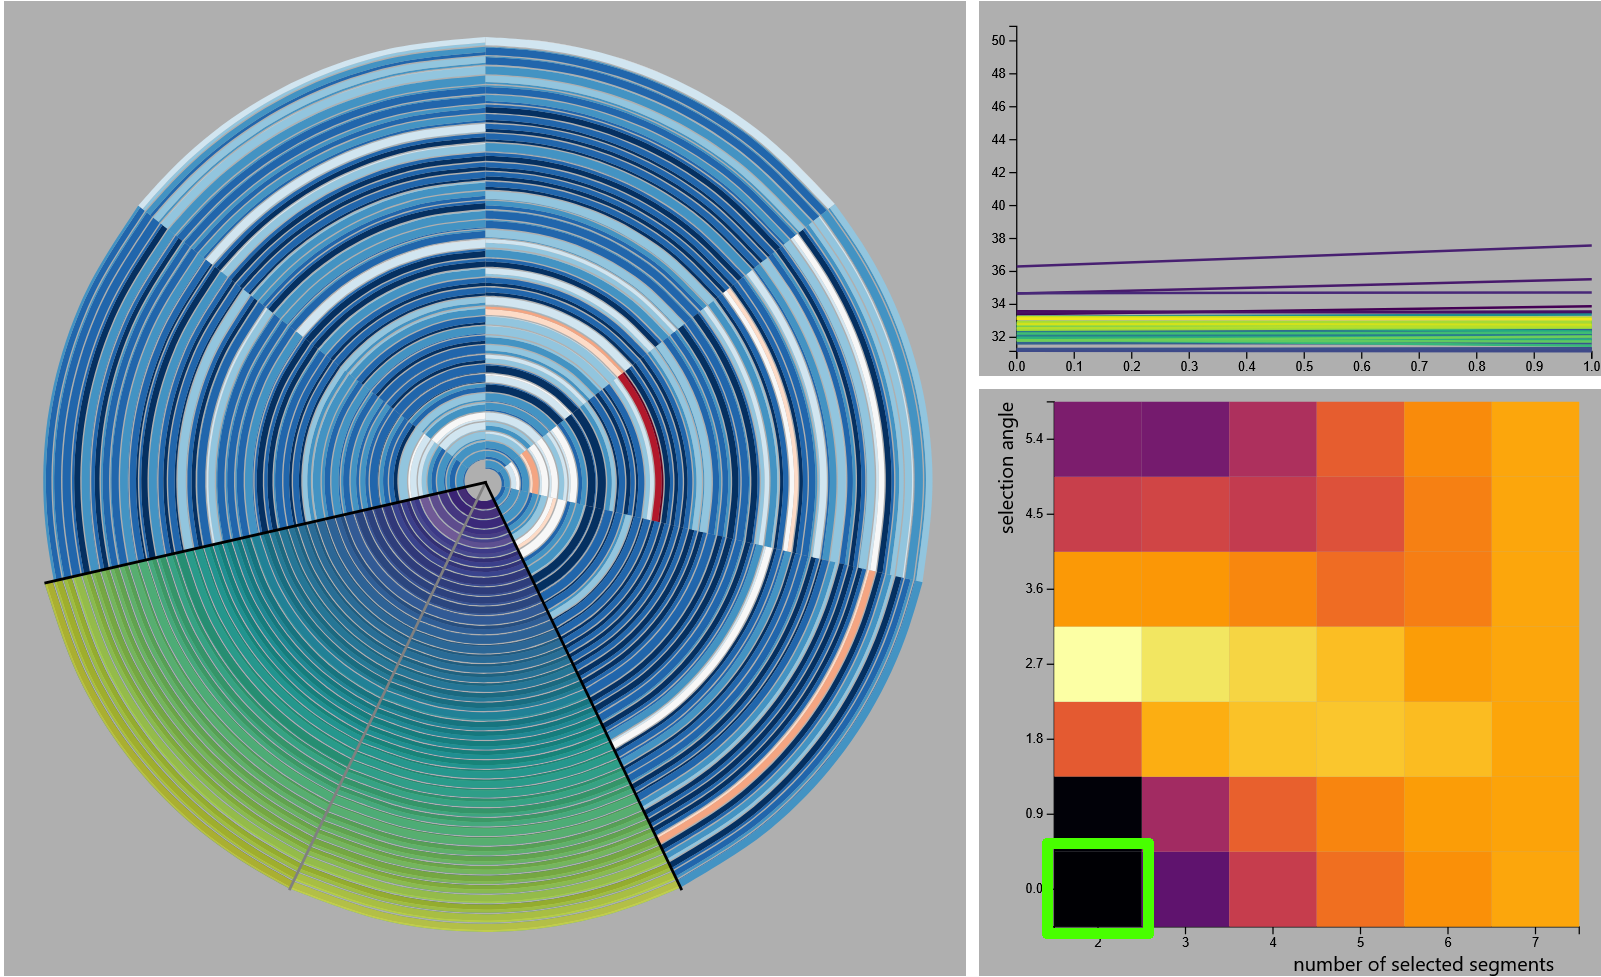
Guidance on large spirals
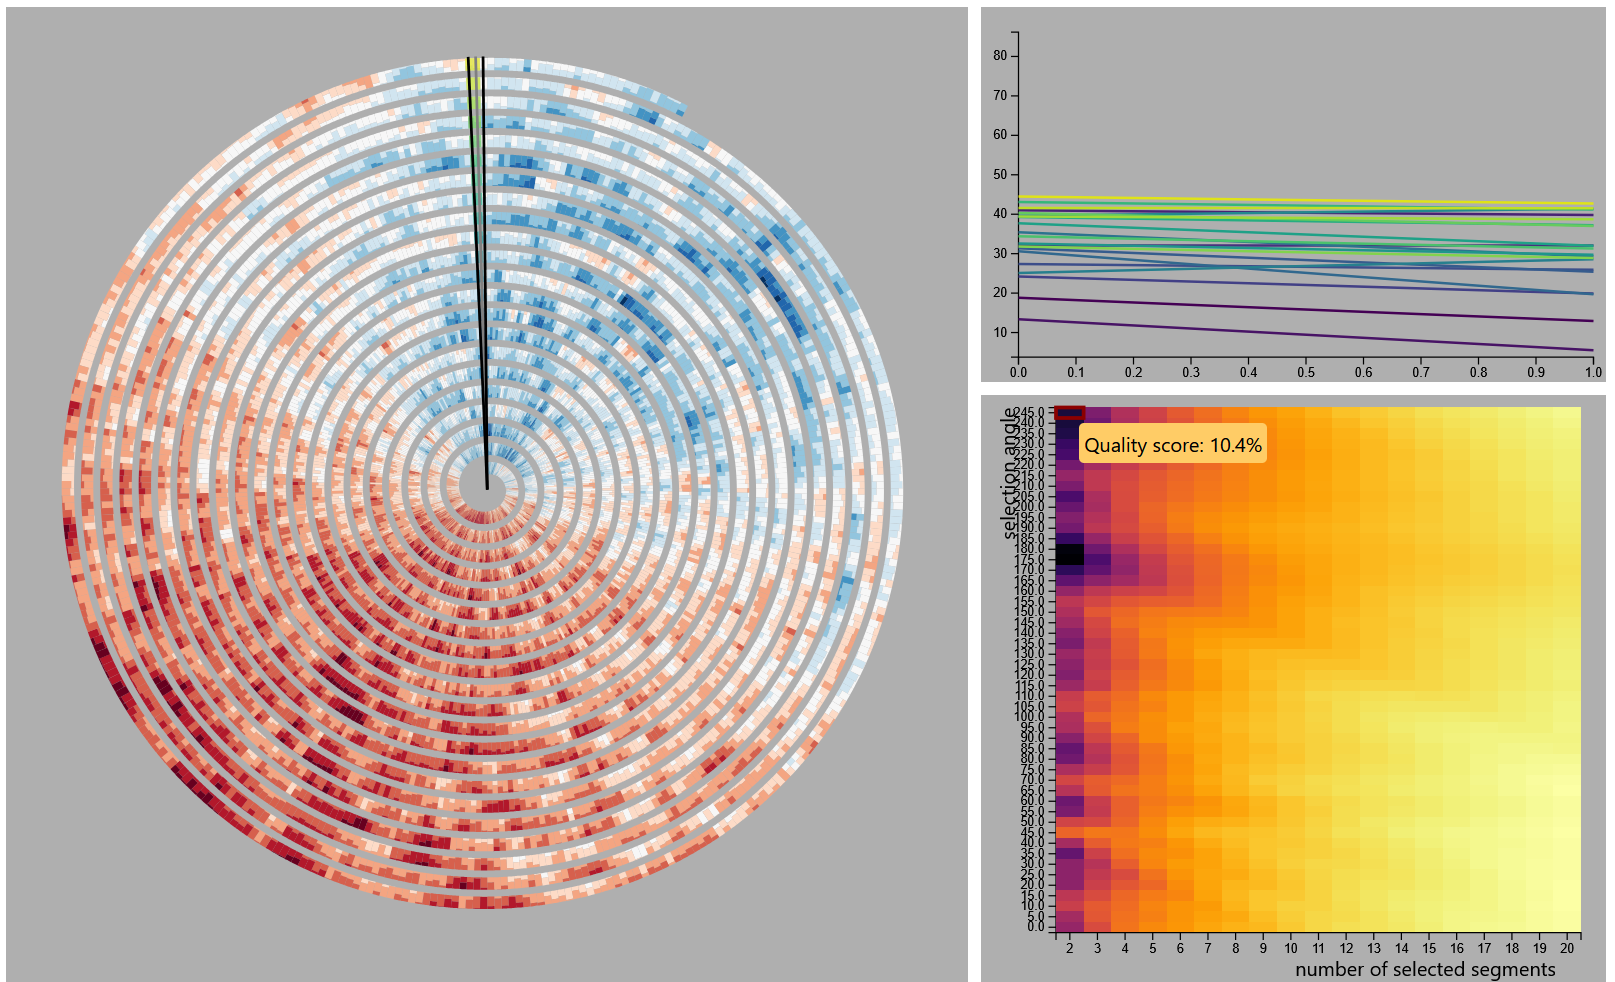
Daily temperature in Vienna over 20 years
Conclusion
Providing guidance on time series spirals may provide additional value
Our interface provides a framework for future extensions
Future Works
- Additional quality measures
- Multivariate time series
- Searching for further use cases
Questions?
Slides:

Corresponding Author: Julian Rakuschek
julian.rakuschek@tugraz.at