How to read these slides?


 Overview
Click on the menu bar items to navigate to chapters
Click here for PDF versionNote: No videos in PDF version!


Progressive Visual Segmentation of
Vibration Signals to Detect Change Points
Julian Rakuschek, Johanna Schmidt, Udo Schlegel, Michèle Posch, Jutta Isopp, Tobias Schreck
VMV 2026 - 25.09.2026
All about vibrations
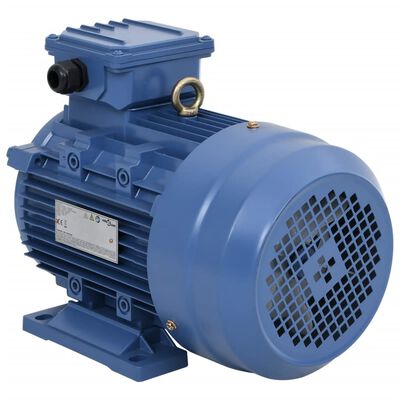
Engine
+
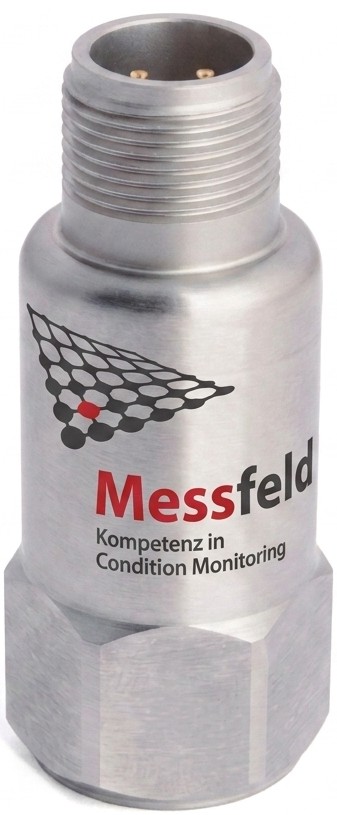
Sensor
=
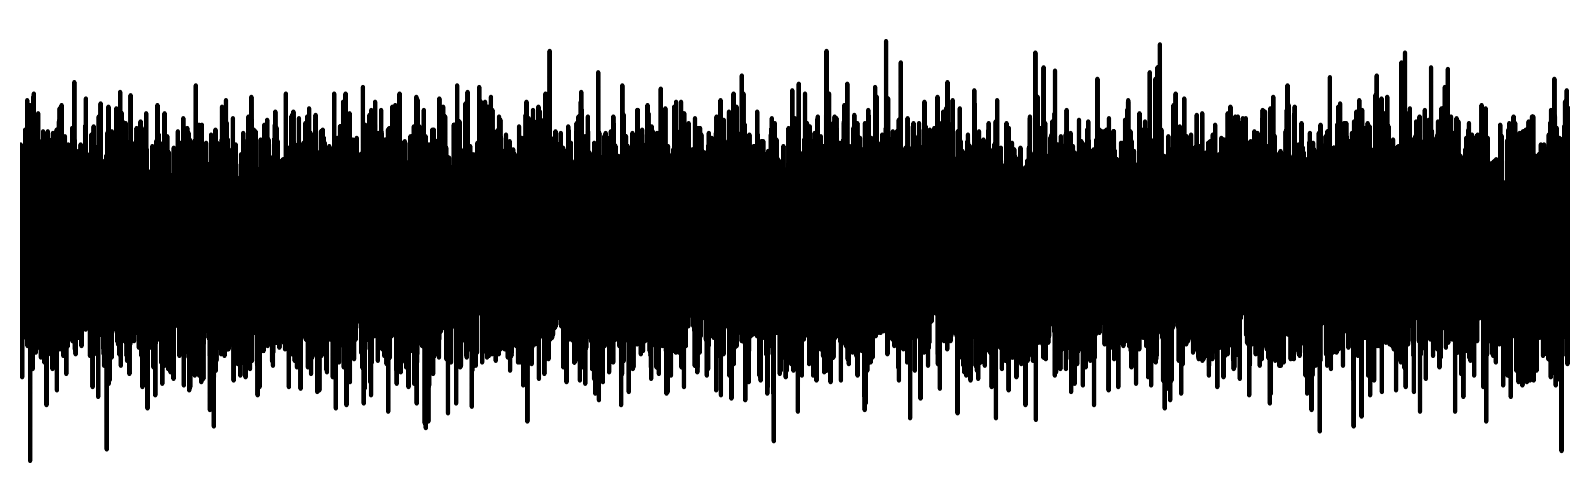
Vibration signal
Why analyze vibrations?
Find long-term deviations
Why analyze vibrations?
Find long-term deviations
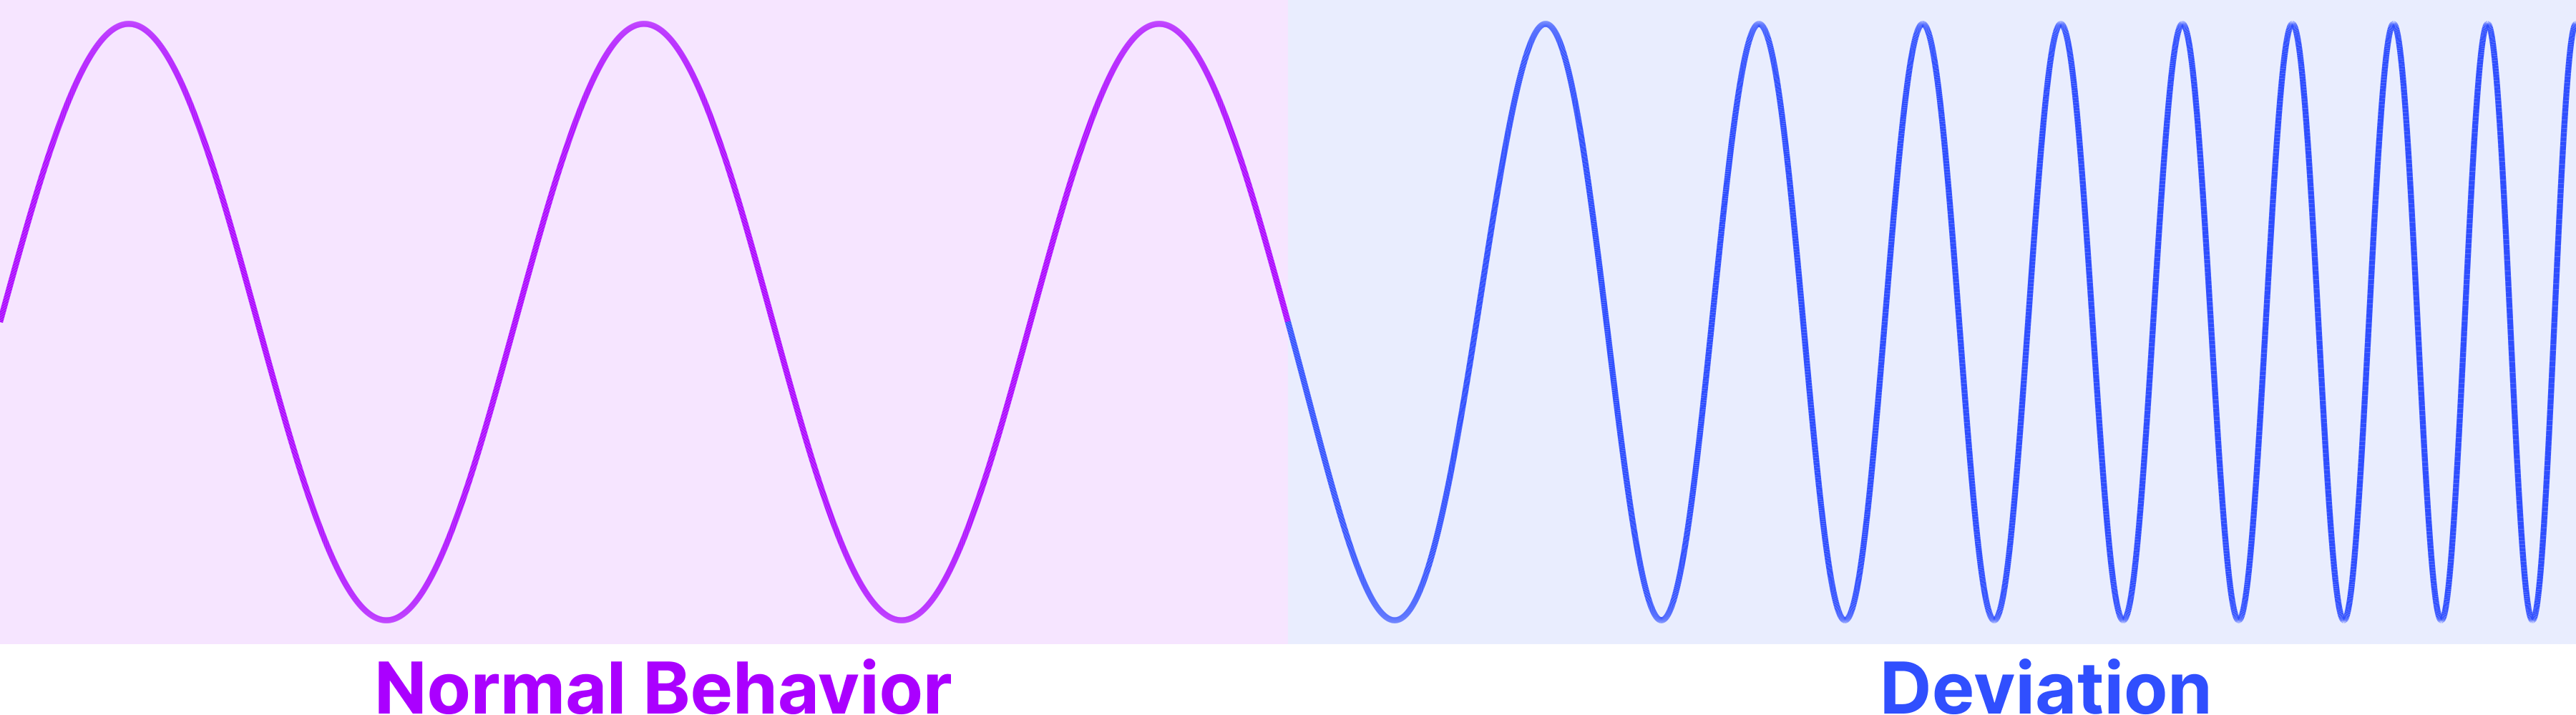
Why analyze vibrations?
Find anomalies (short-term, unexpected)
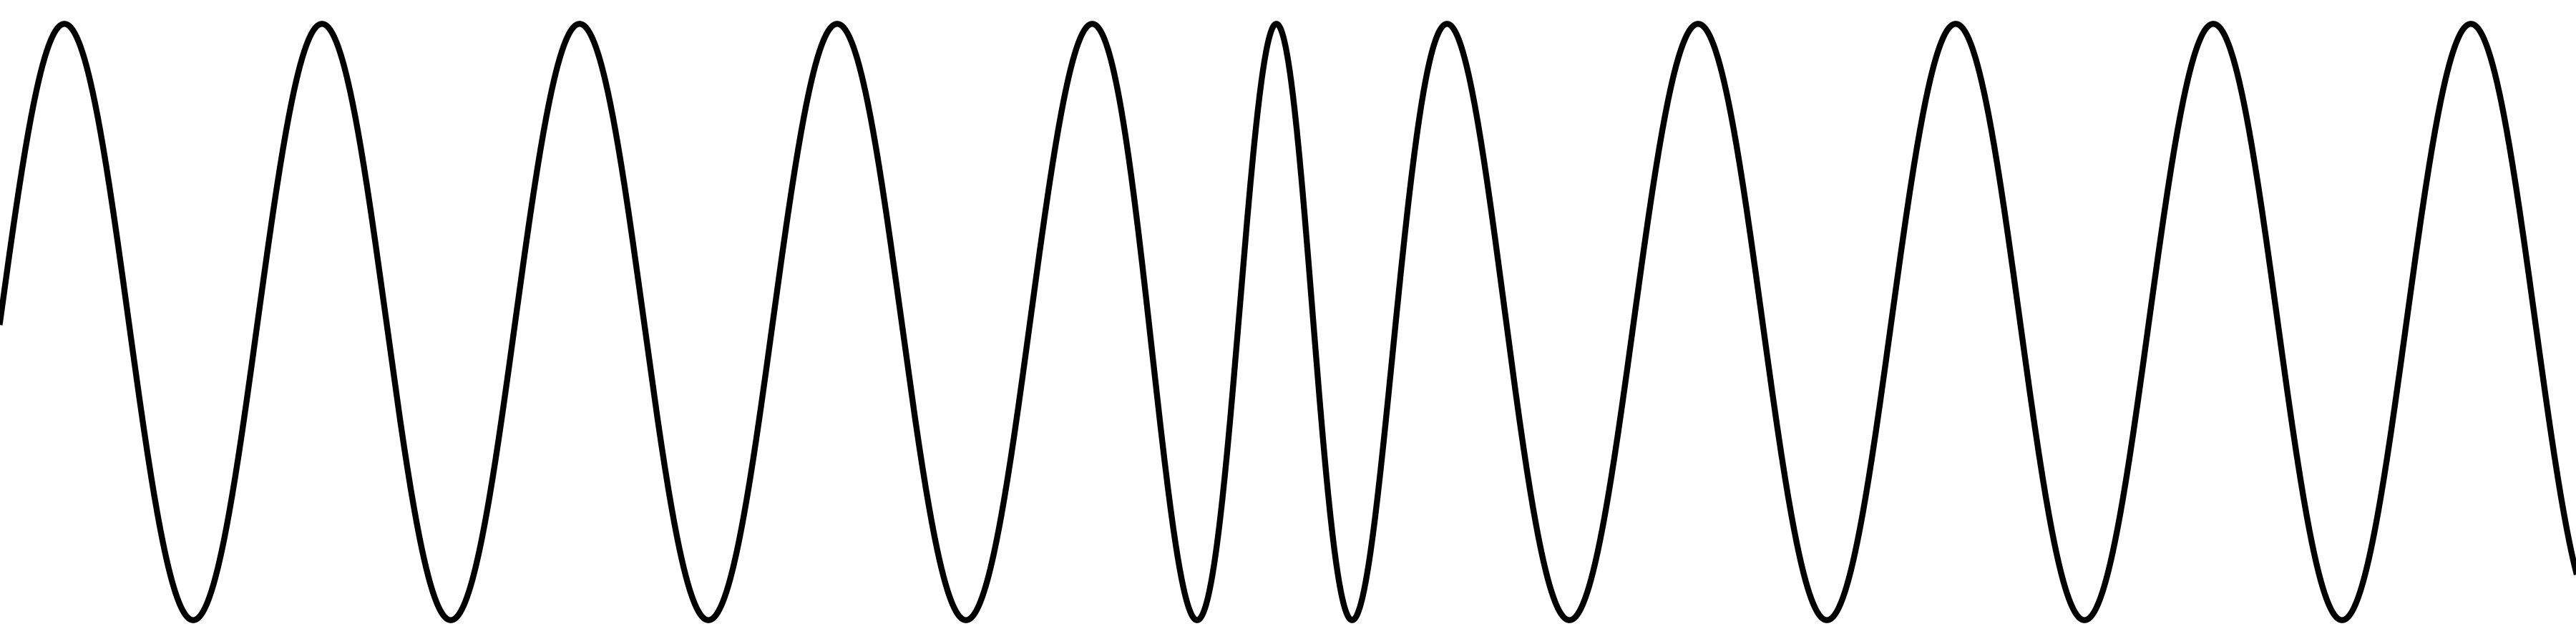
Why analyze vibrations?
Find anomalies (short-term, unexpected)
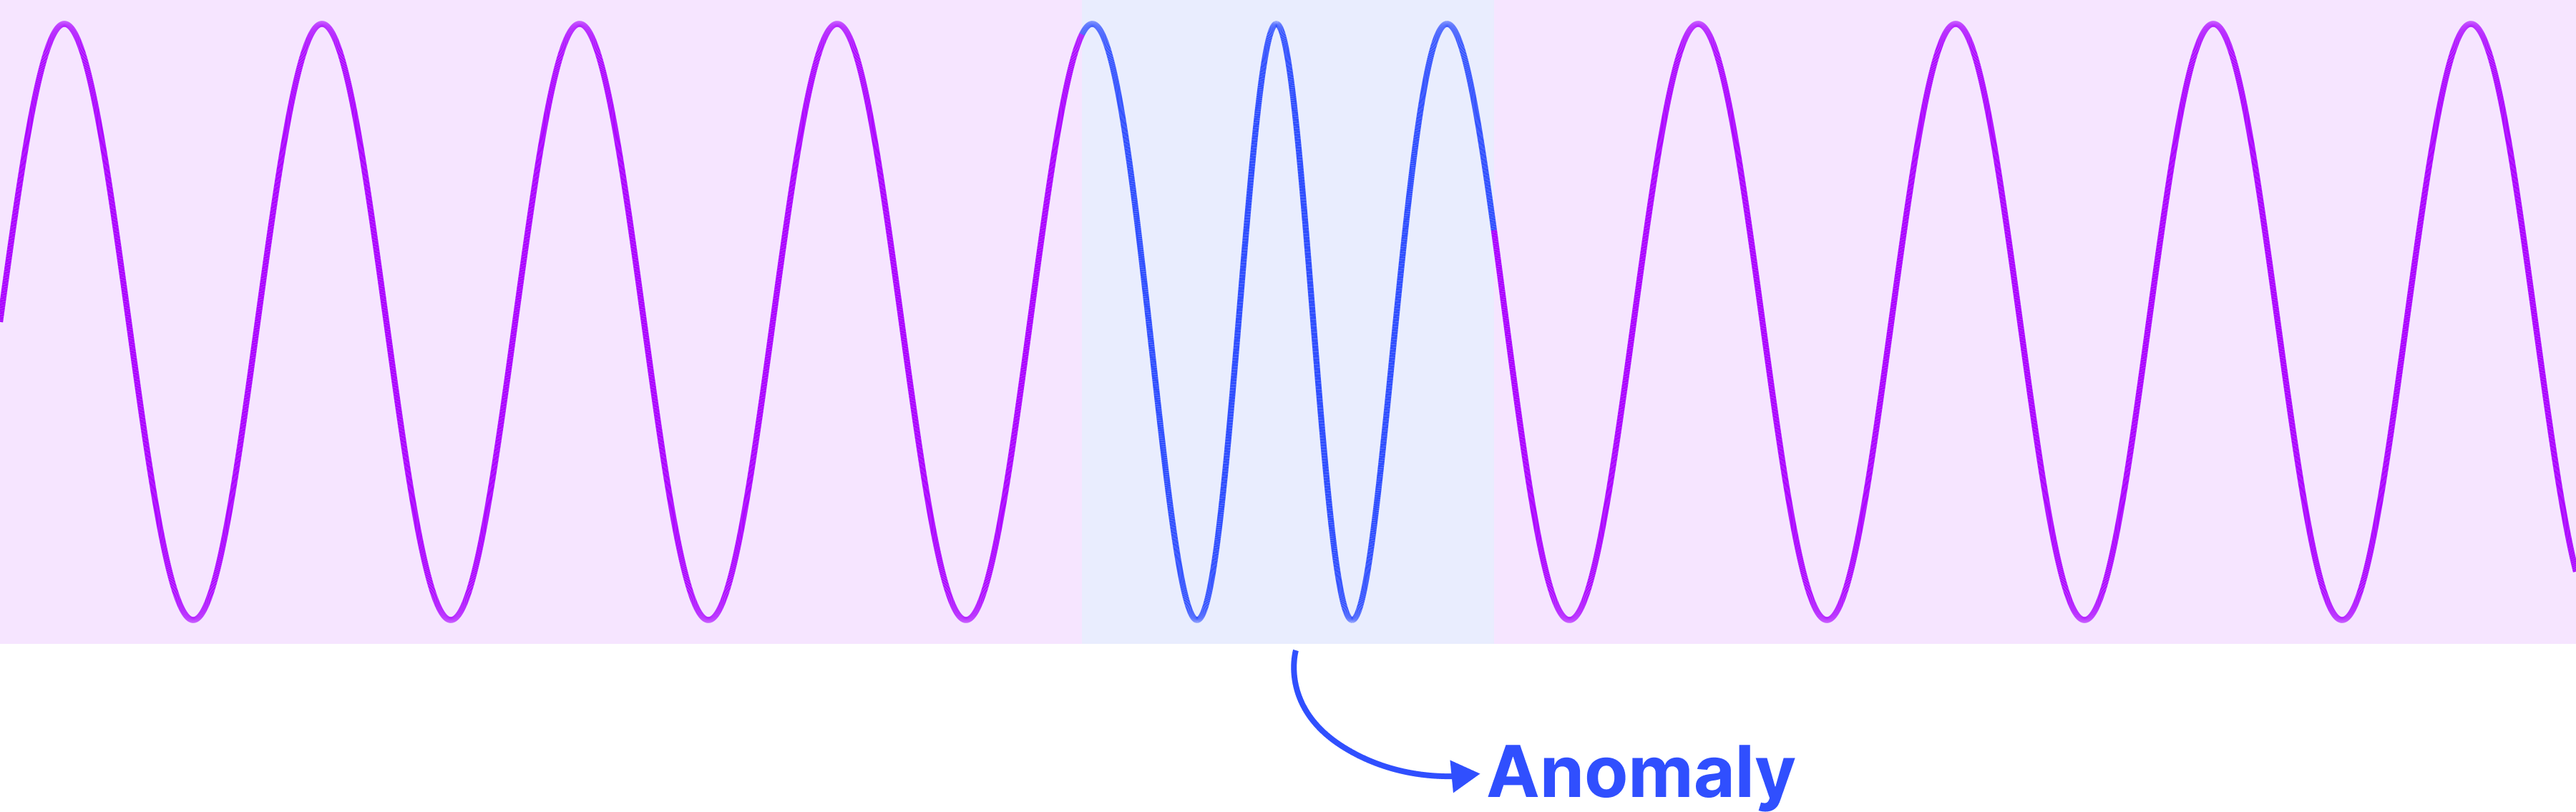
Why analyze vibrations?
Predict faults
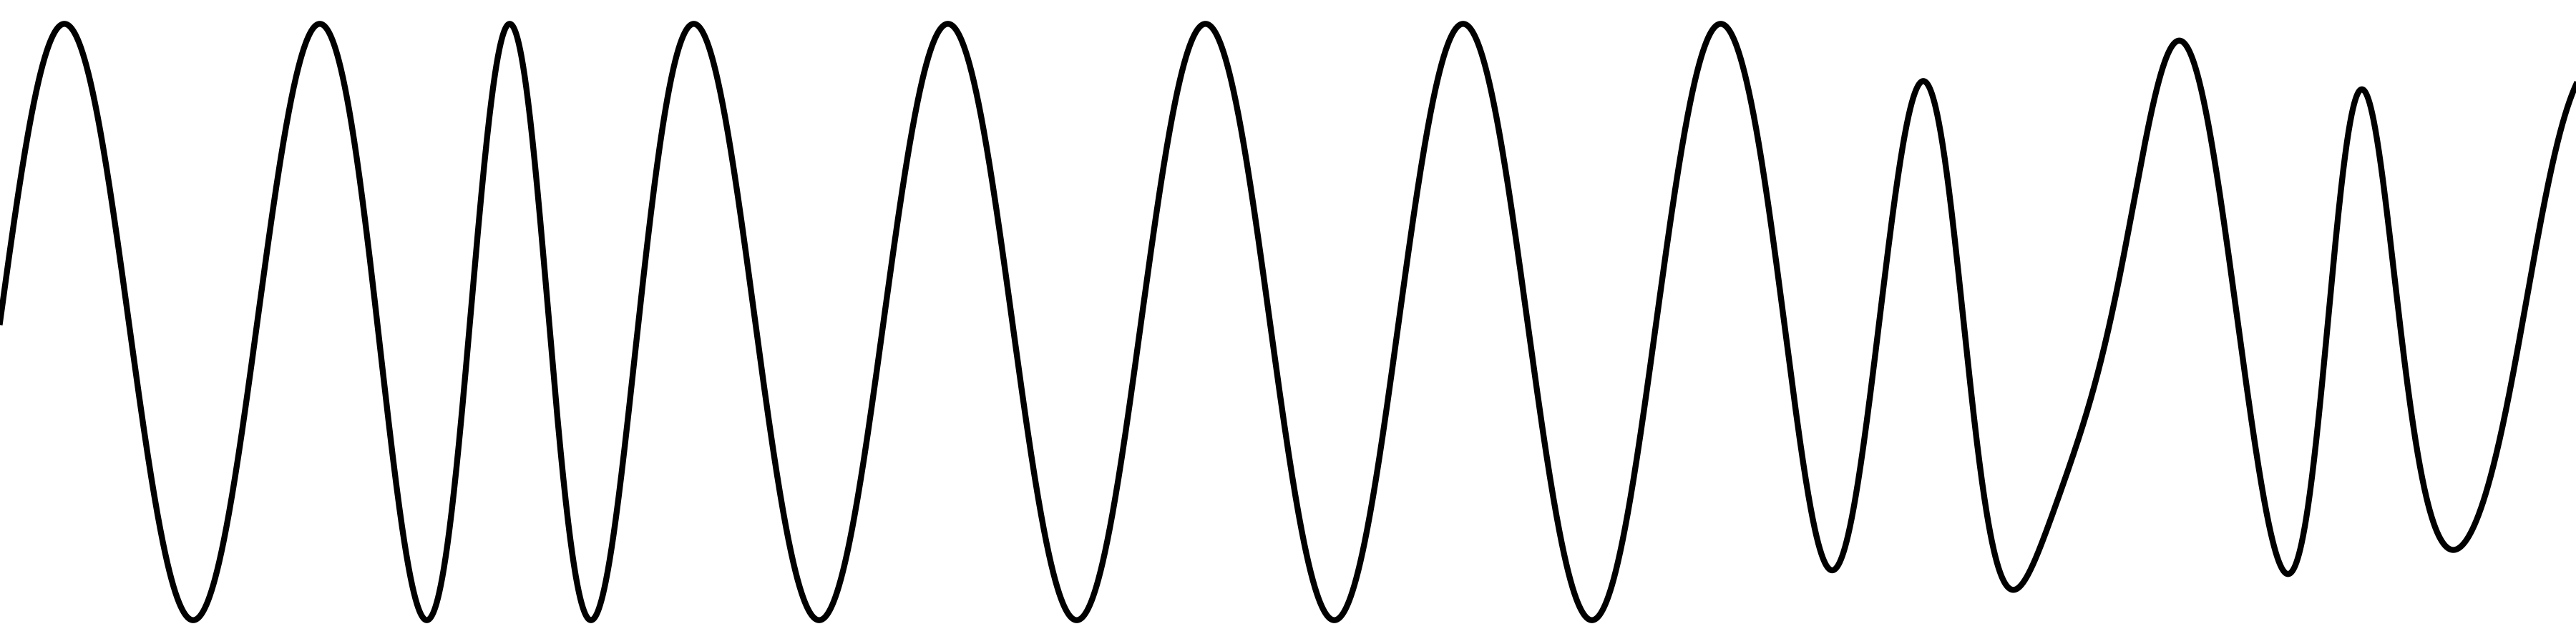
Why analyze vibrations?
Predict faults
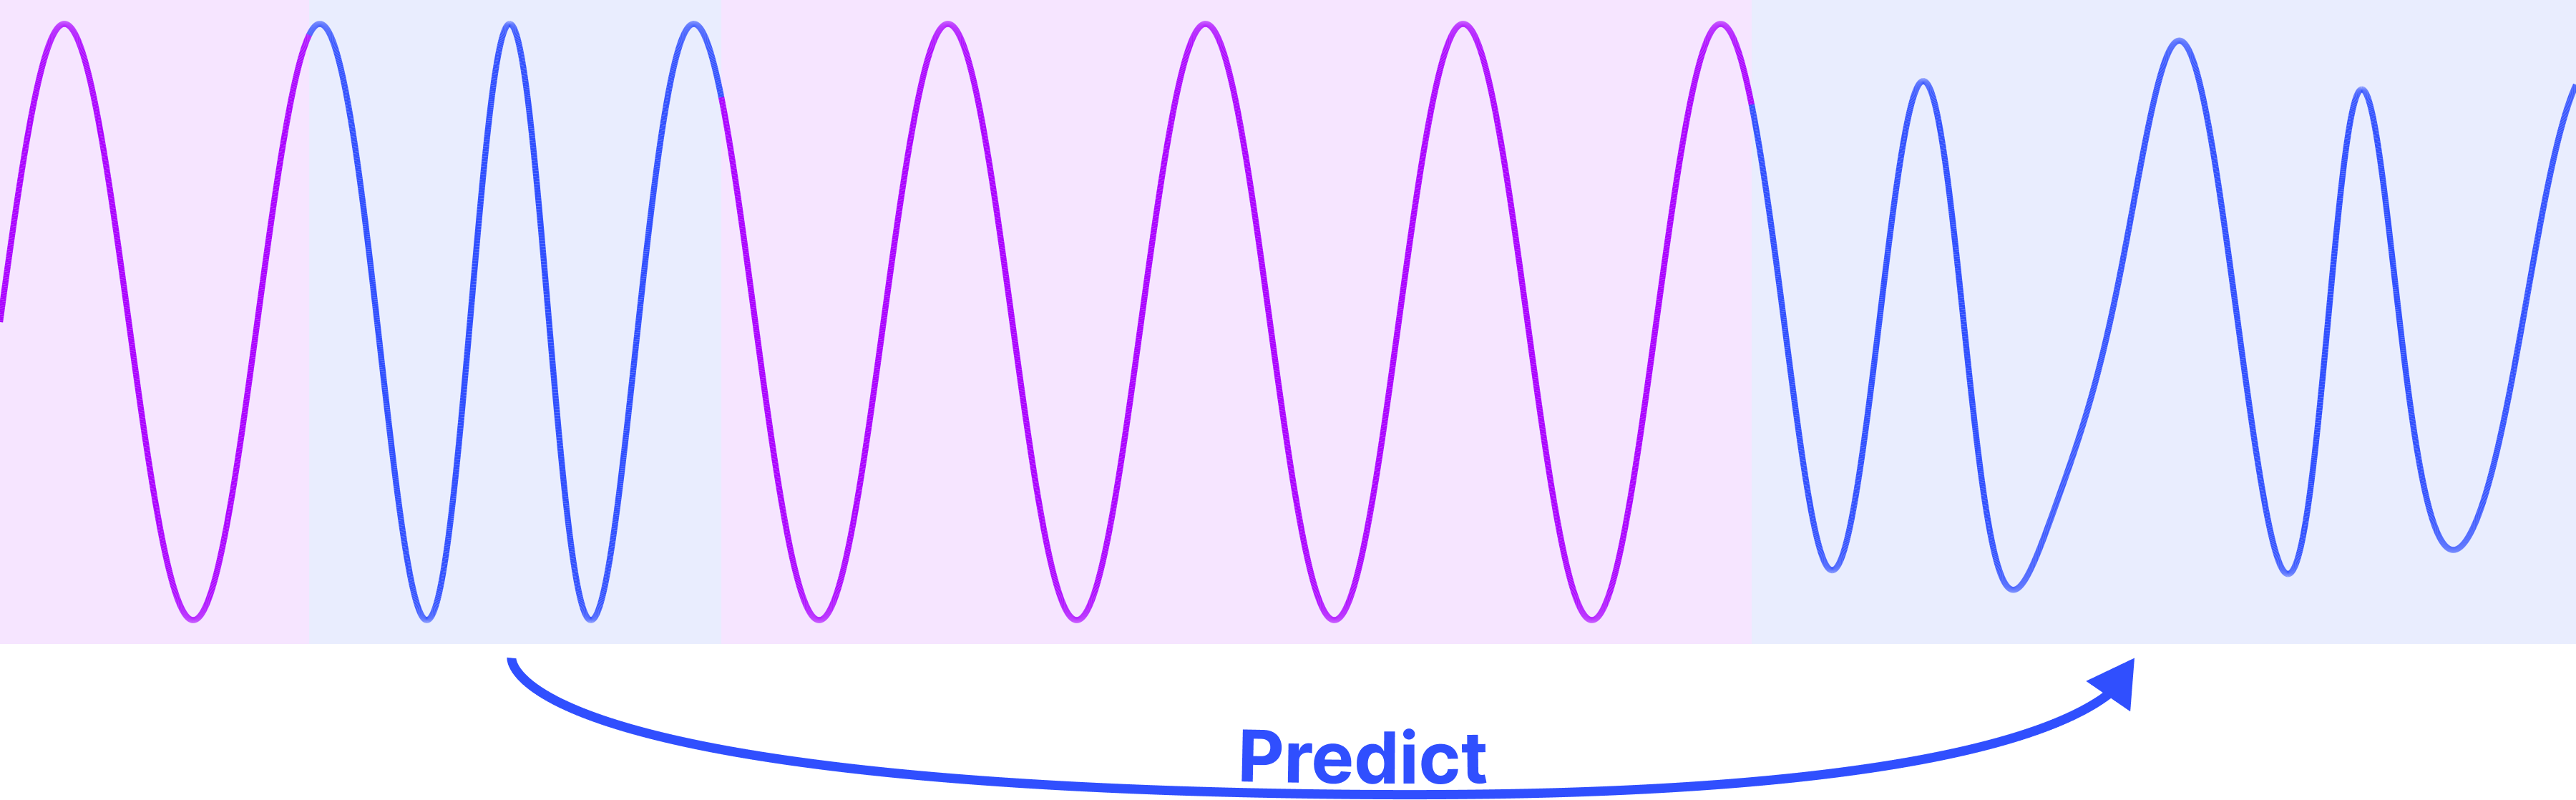
A good segmentation can help solve these tasks!
Condition Monitoring
Predictive Maintenance
Anomaly Detection
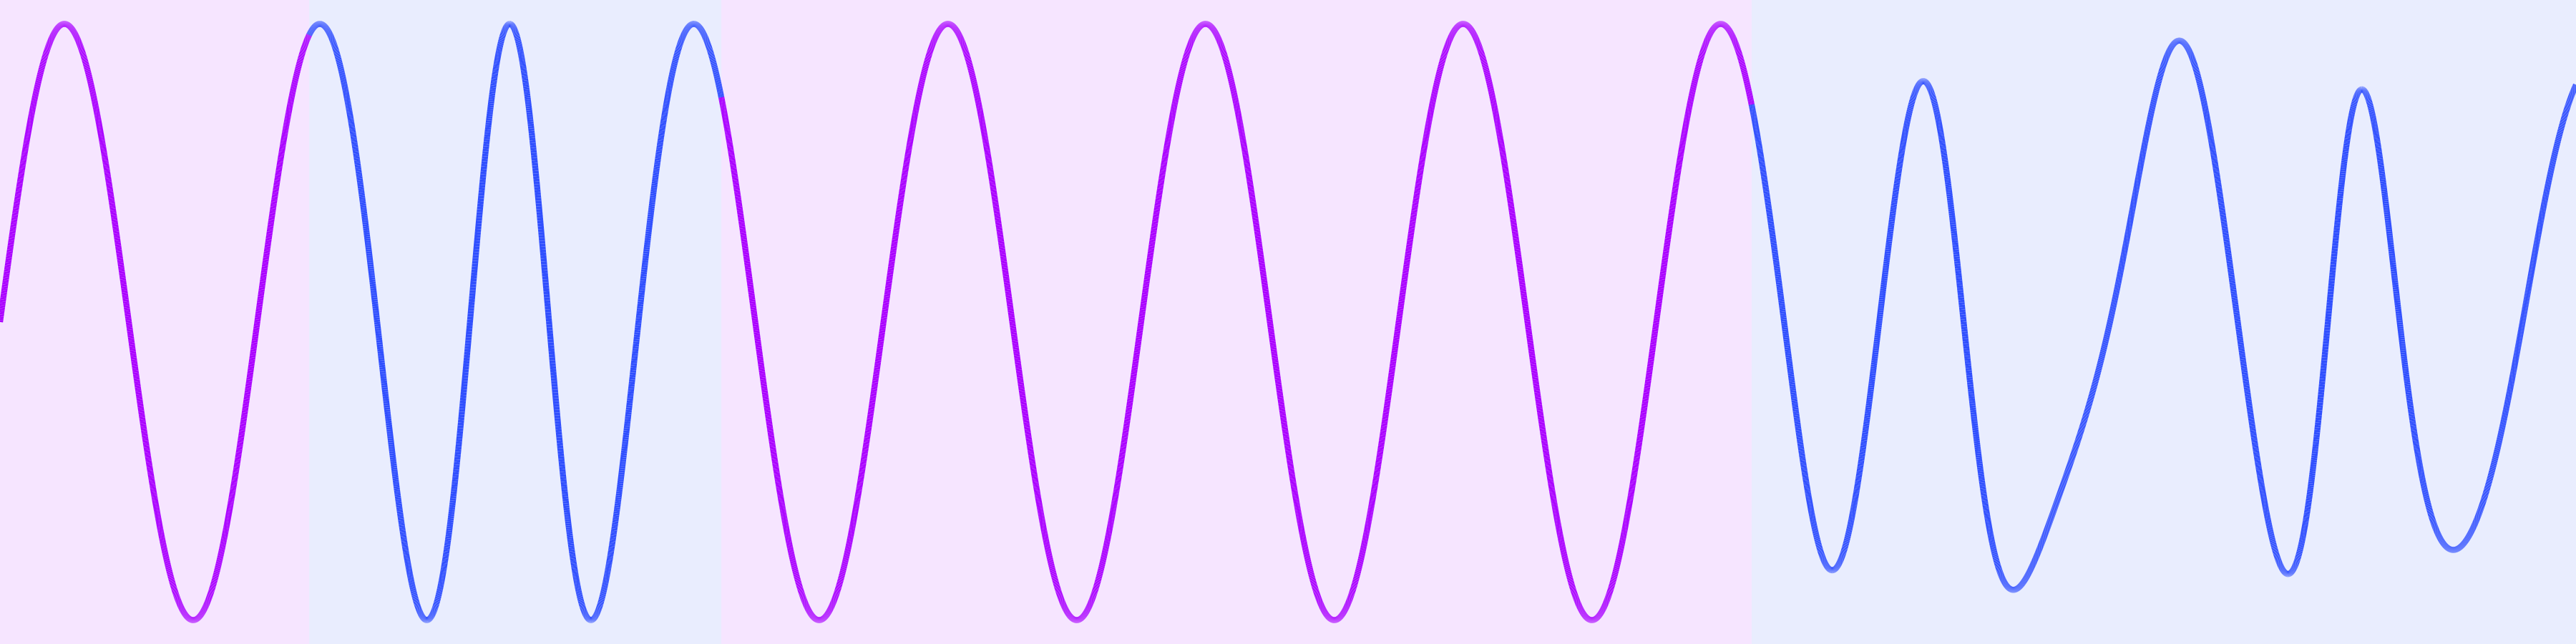
The transitions between segments mark change points
This is hard to read
We transform it to the frequency domain
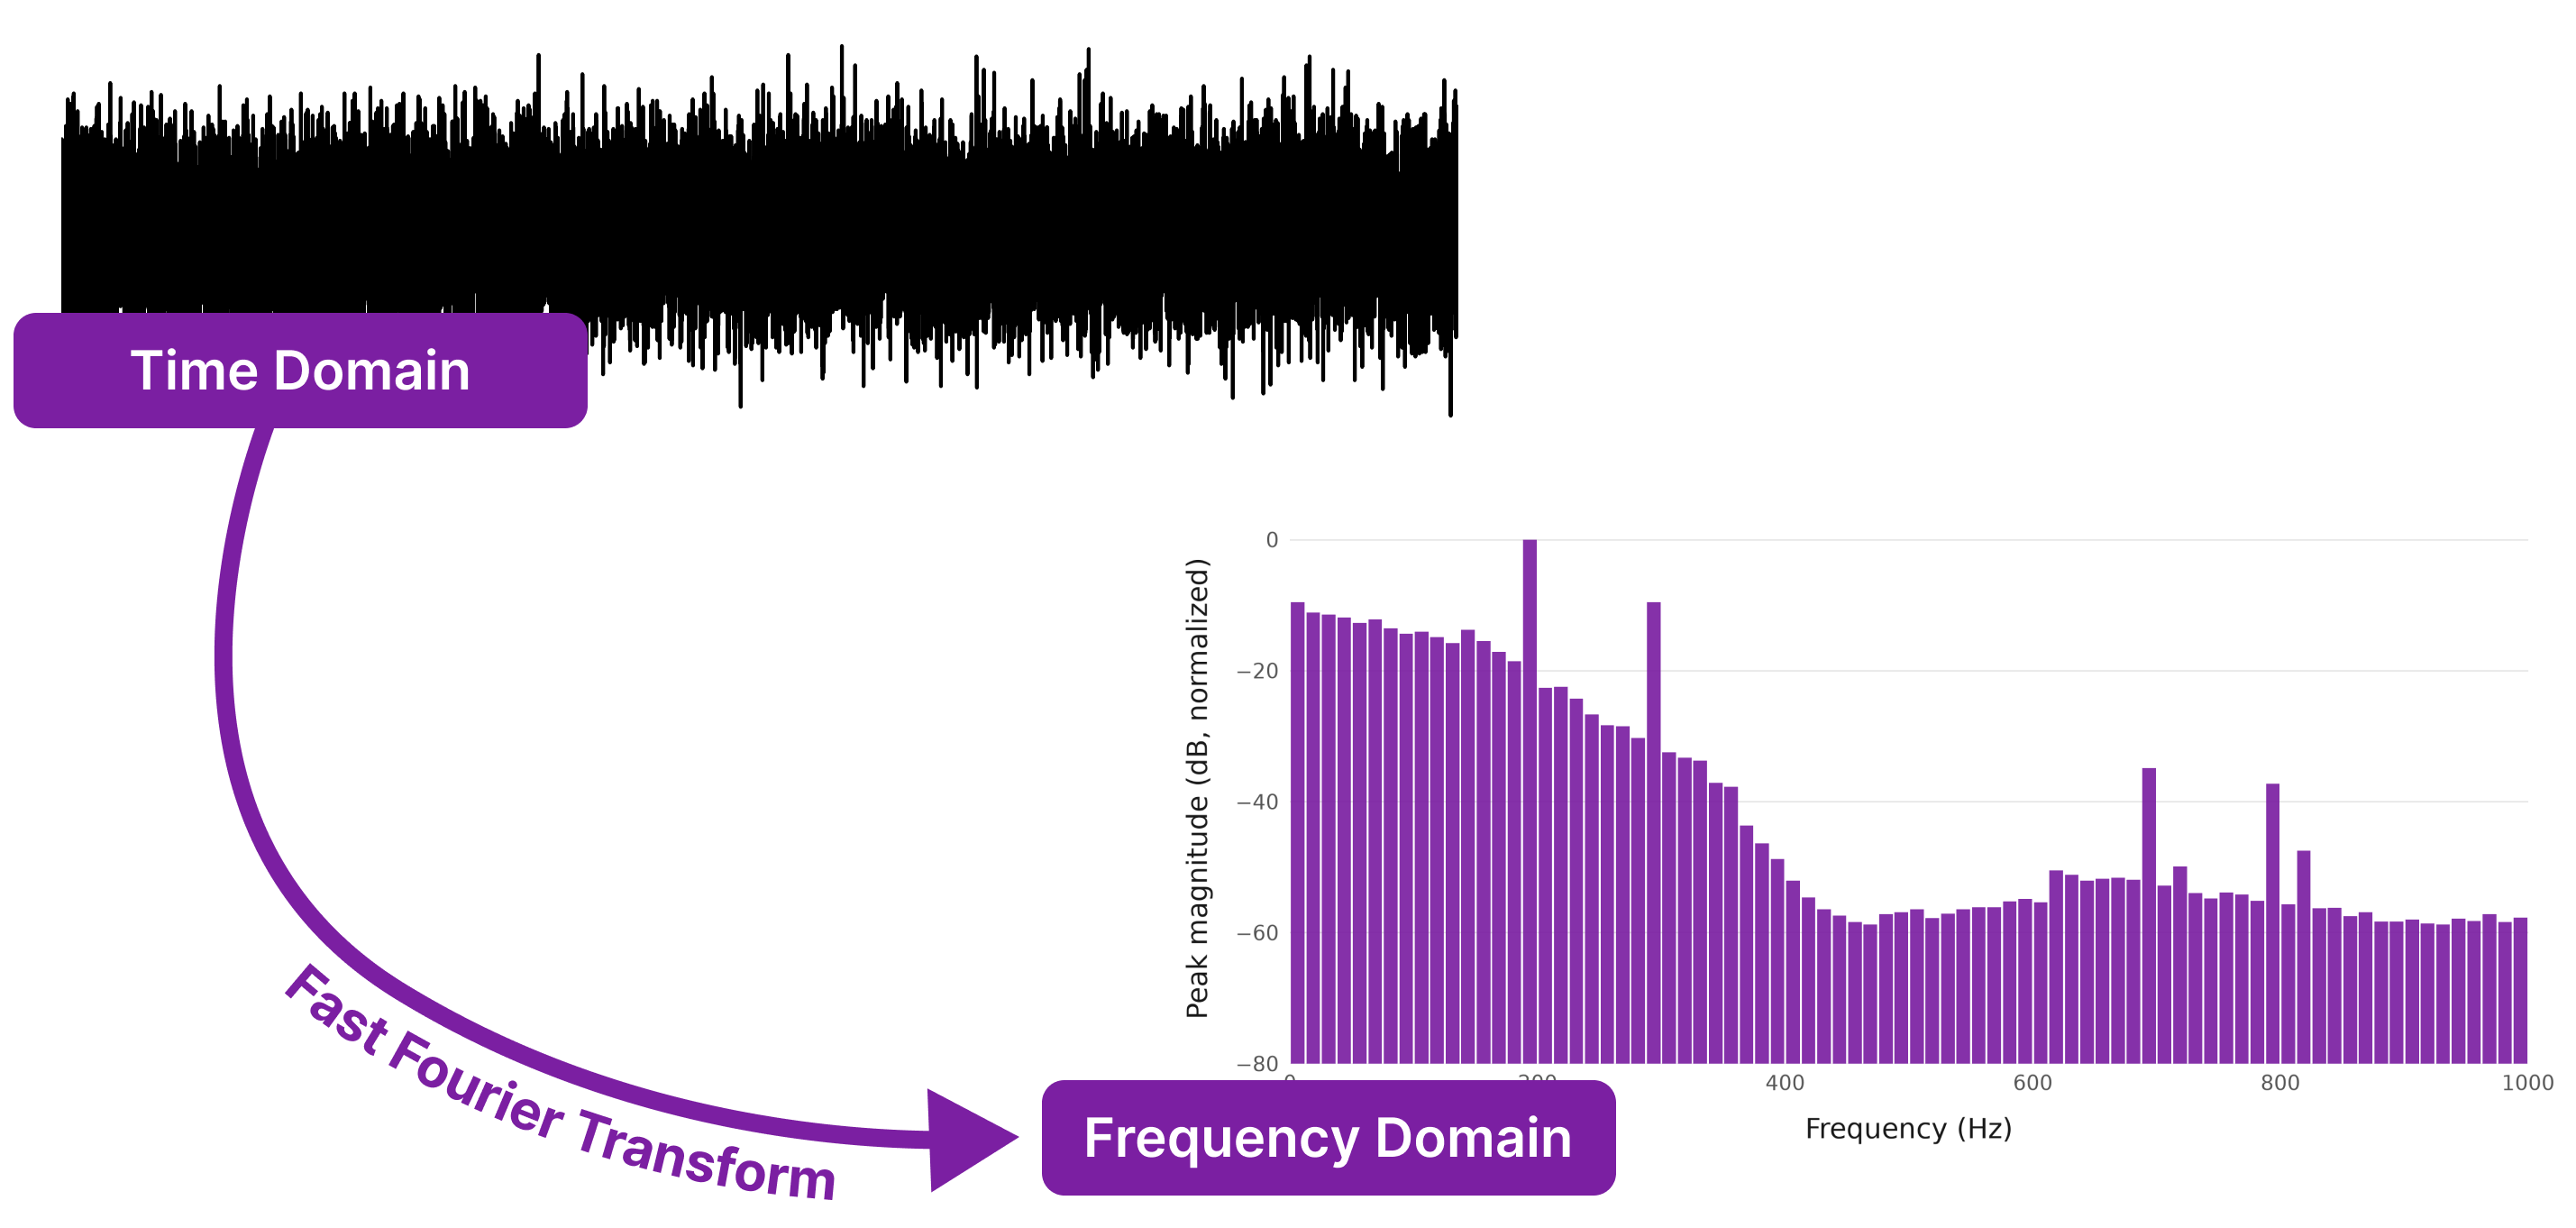
The big problem with vibrations:
Large data volumes
High sampling rate = large data volumes
Example: 30 kHz (30 000 samples per second)
Assumption: 8 byte per sample
How do domain experts approach this?
Signal Analysis via Manual Window Positioning
How about 10TB?
Manual scanning is tedious!
Our Method: Sampling
Our approach: Sampling
We iteratively construct an overview
In many cases a small fraction of the data suffices!
Do we need to save the full signal?
No!
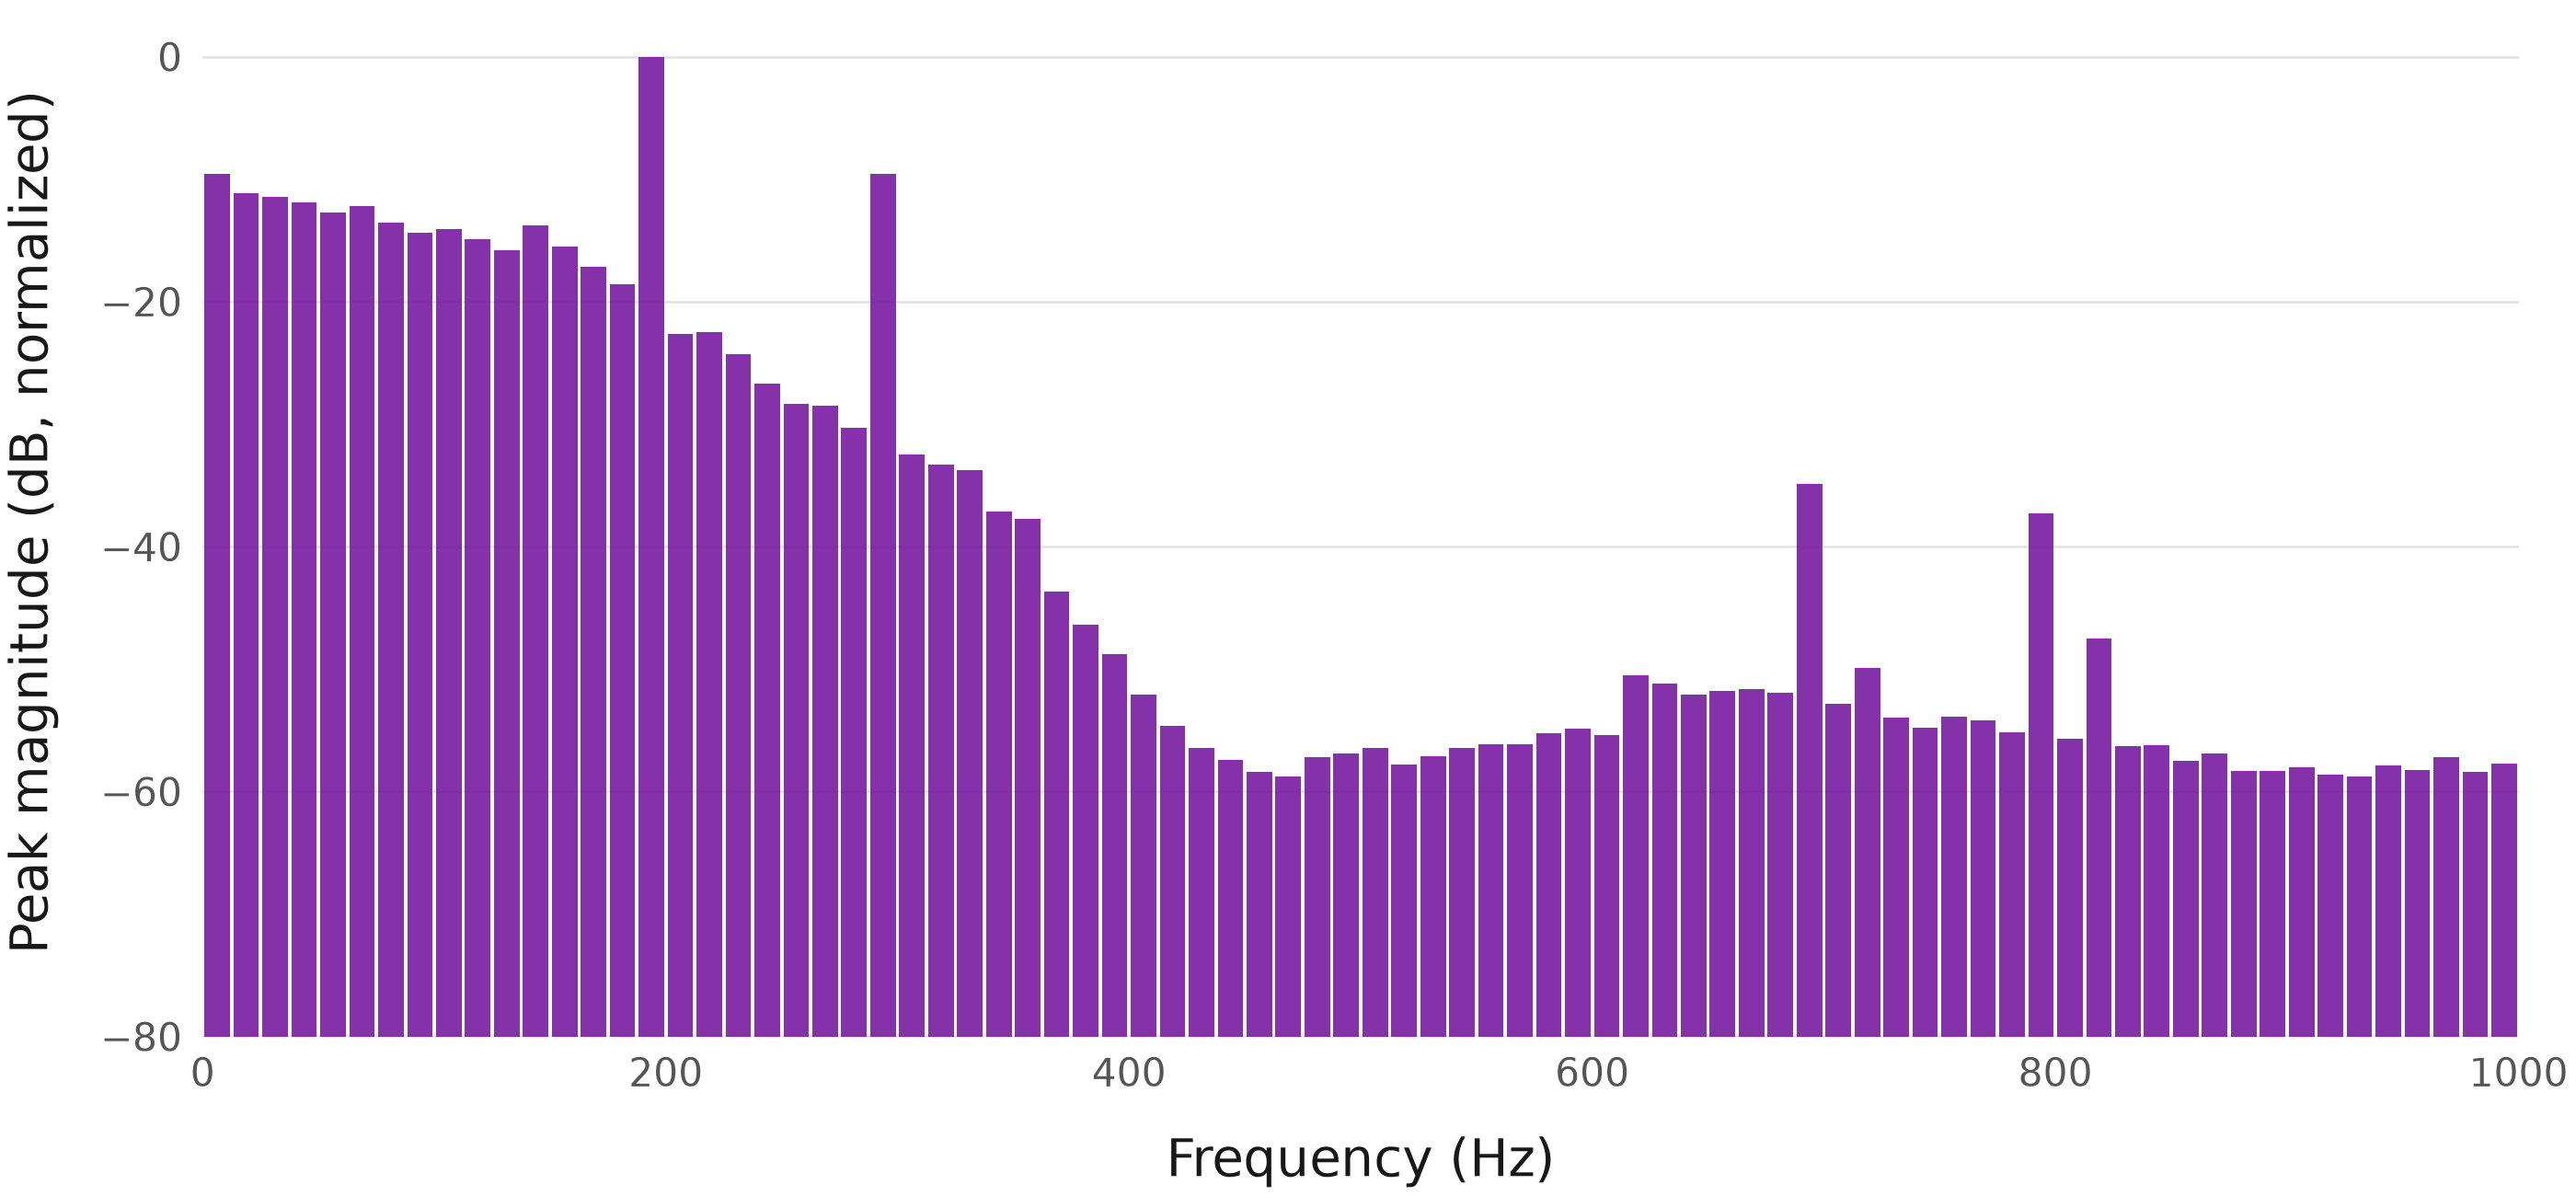
We only save a FFT histogram per sample into the database.
Further representations possible
Time Series Projections
We start with an empty timeline

Next we randomly draw samples

The subsequences are grouped by similarity

The background is colored by closest label

The height is adjusted based on the density

For a subset of samples we can show representations as thumbnails.

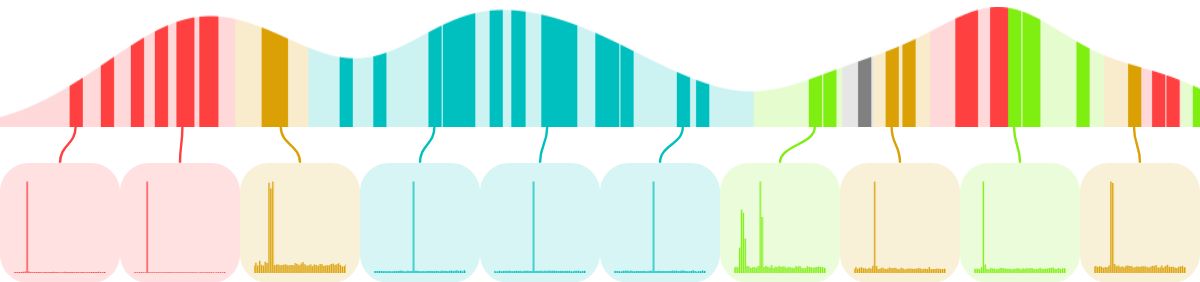
We obtain a segmentation
With more samples, the segmentation becomes more accurate.
5 samples
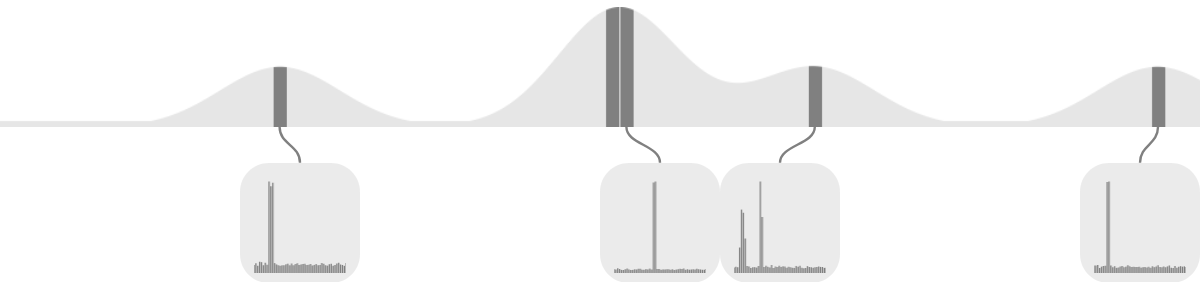
10 samples
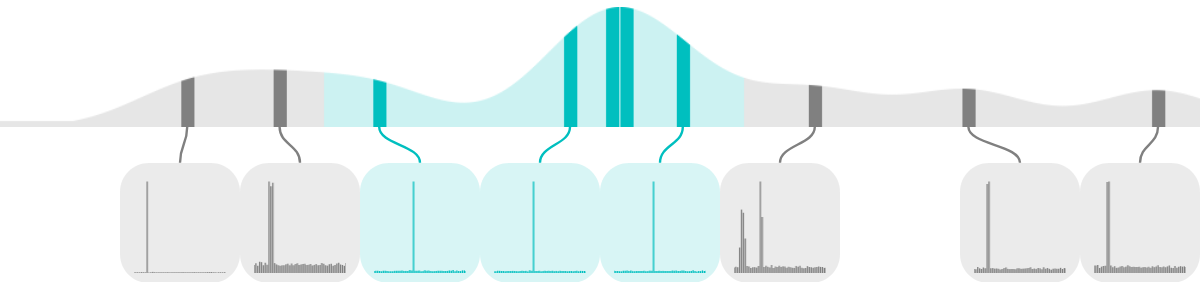
25 samples
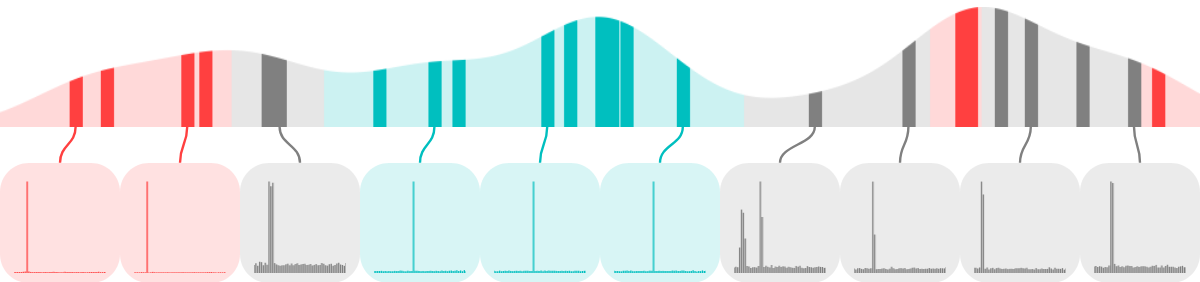
50 samples
How can users steer the sampling?
Defining intervals to constrain the sampling
(Accelerated video footage)
How can users explore the result?
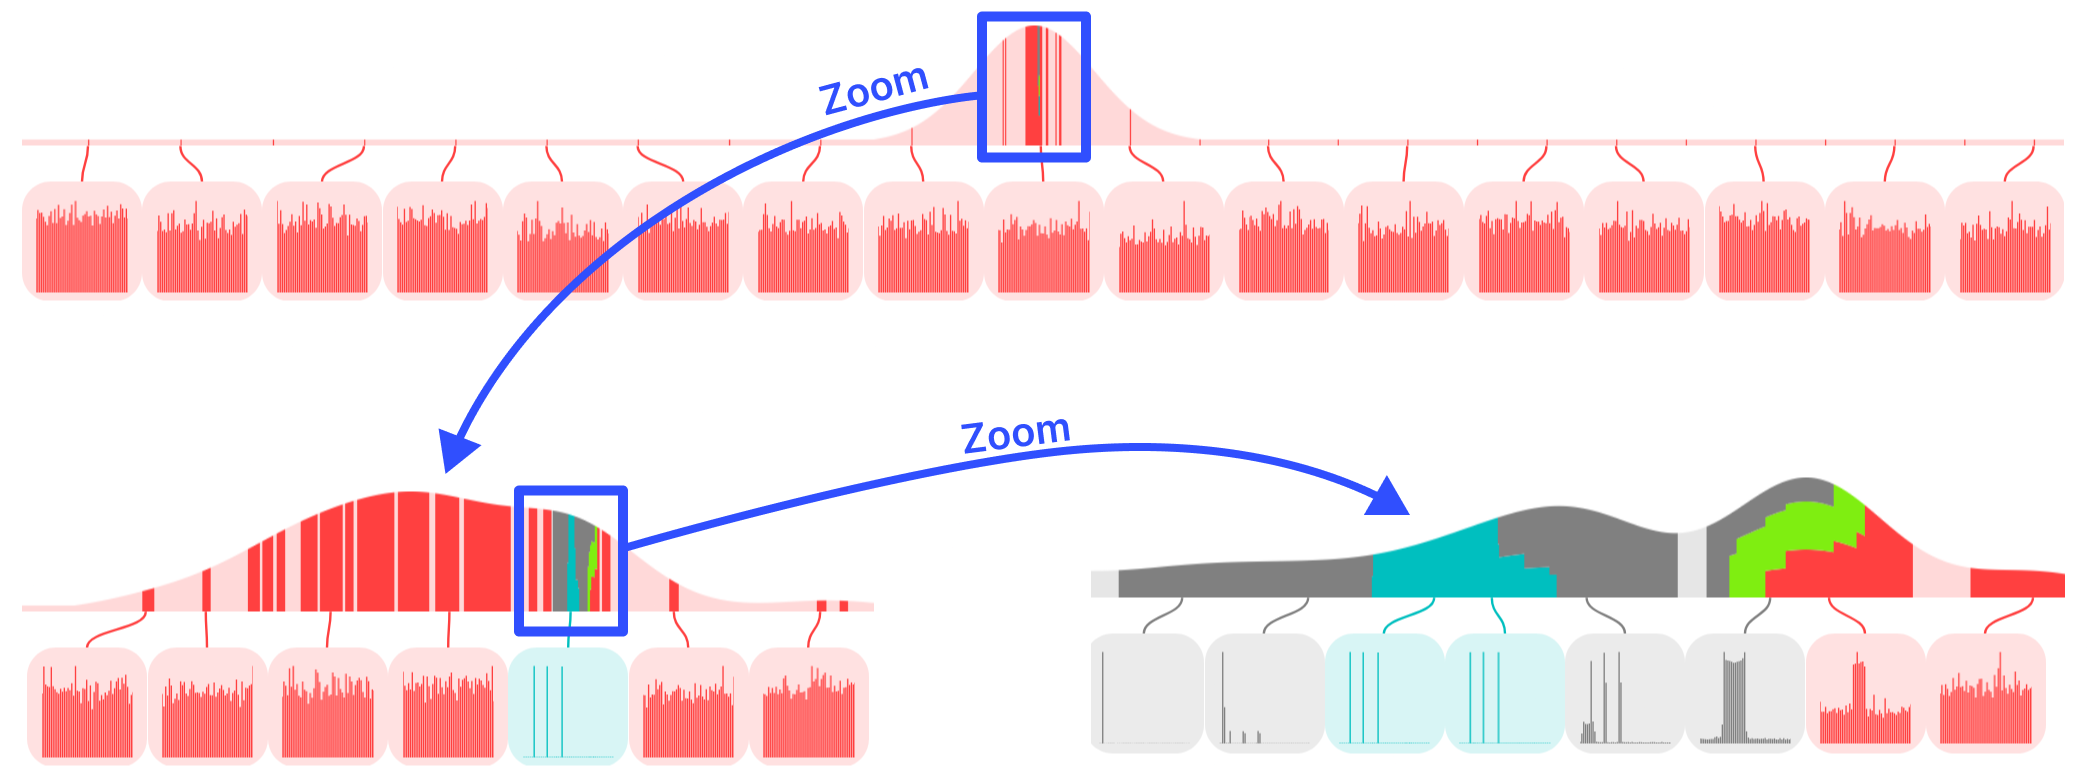
Classic zooming and panning
Inspecting samples in detail
Other sampling strategies
Binary Sampling (1)
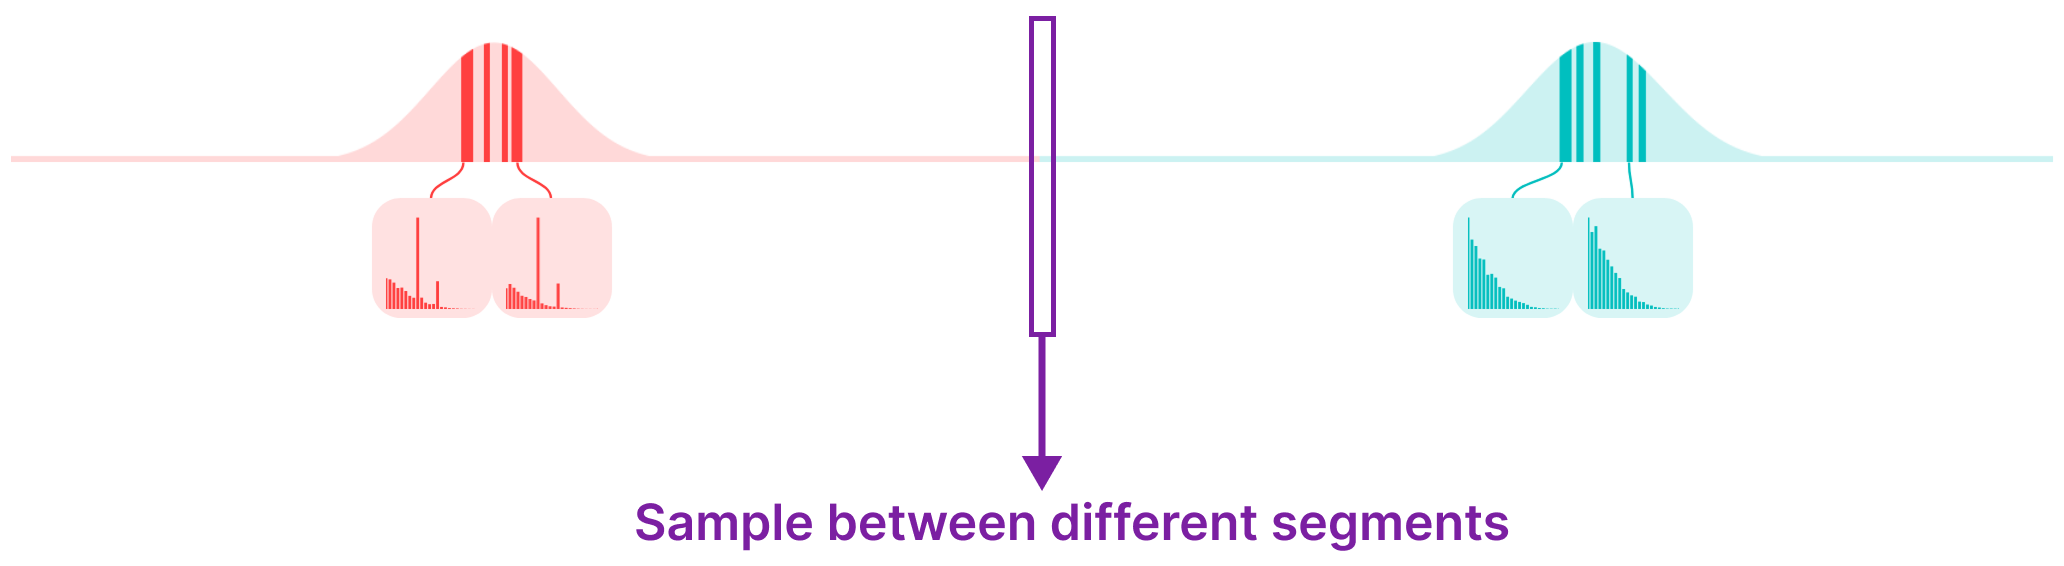
Binary Sampling (2)
The result: Sharp boundaries

Gap Filling (1)
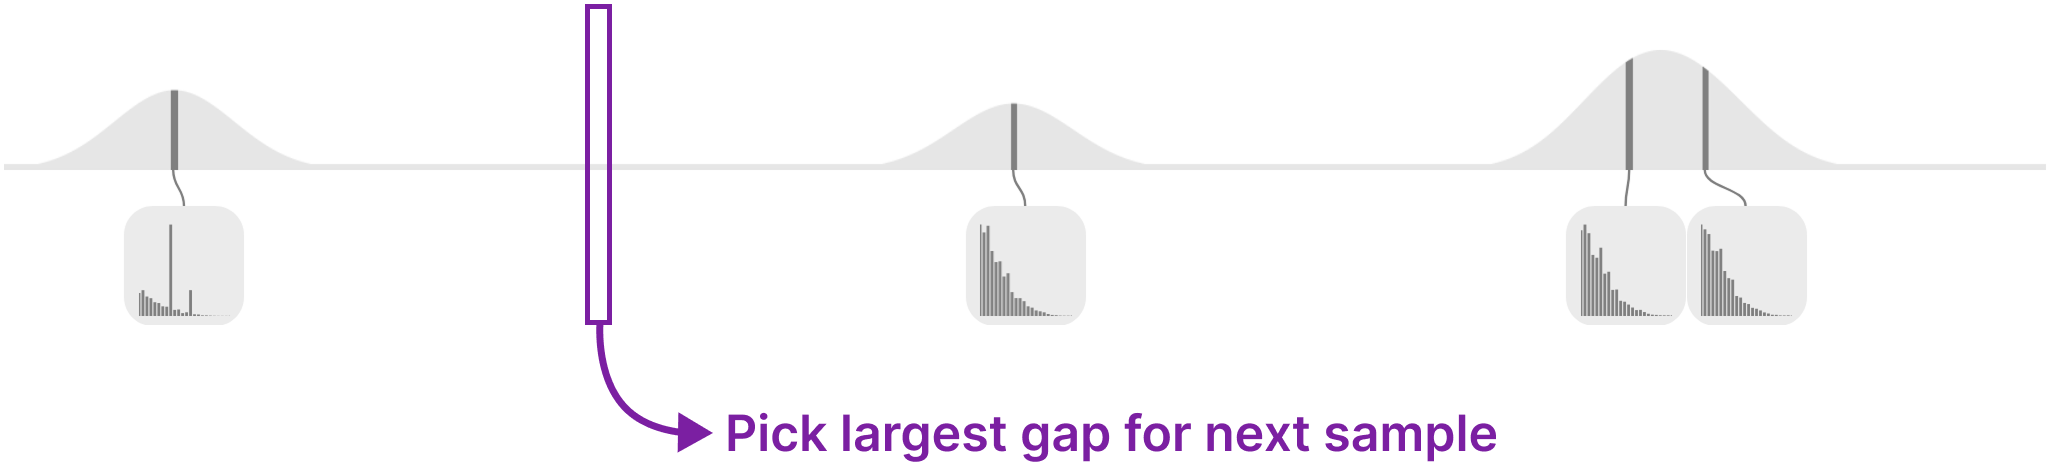
Gap Filling (2)
The result is a uniform distribution of samples

Linear Sampling
Pick samples in chronological order
(Accelerated video footage)
Evaluation
Formative Evaluation (1)
With two domain experts from the field of vibration analysis
Round 1 / 3
Discussion and Requirements
Formative Evaluation (2)
Round 2 / 3
- Experts used the system
- Identify a change point
- Feedback
Formative Evaluation (3)
Round 3 / 3
- Experts used own dataset.
- Tried to replicate a finding.
- Successfully used system to identify leakage in a machine.
Early analysis results:

Final analysis results:

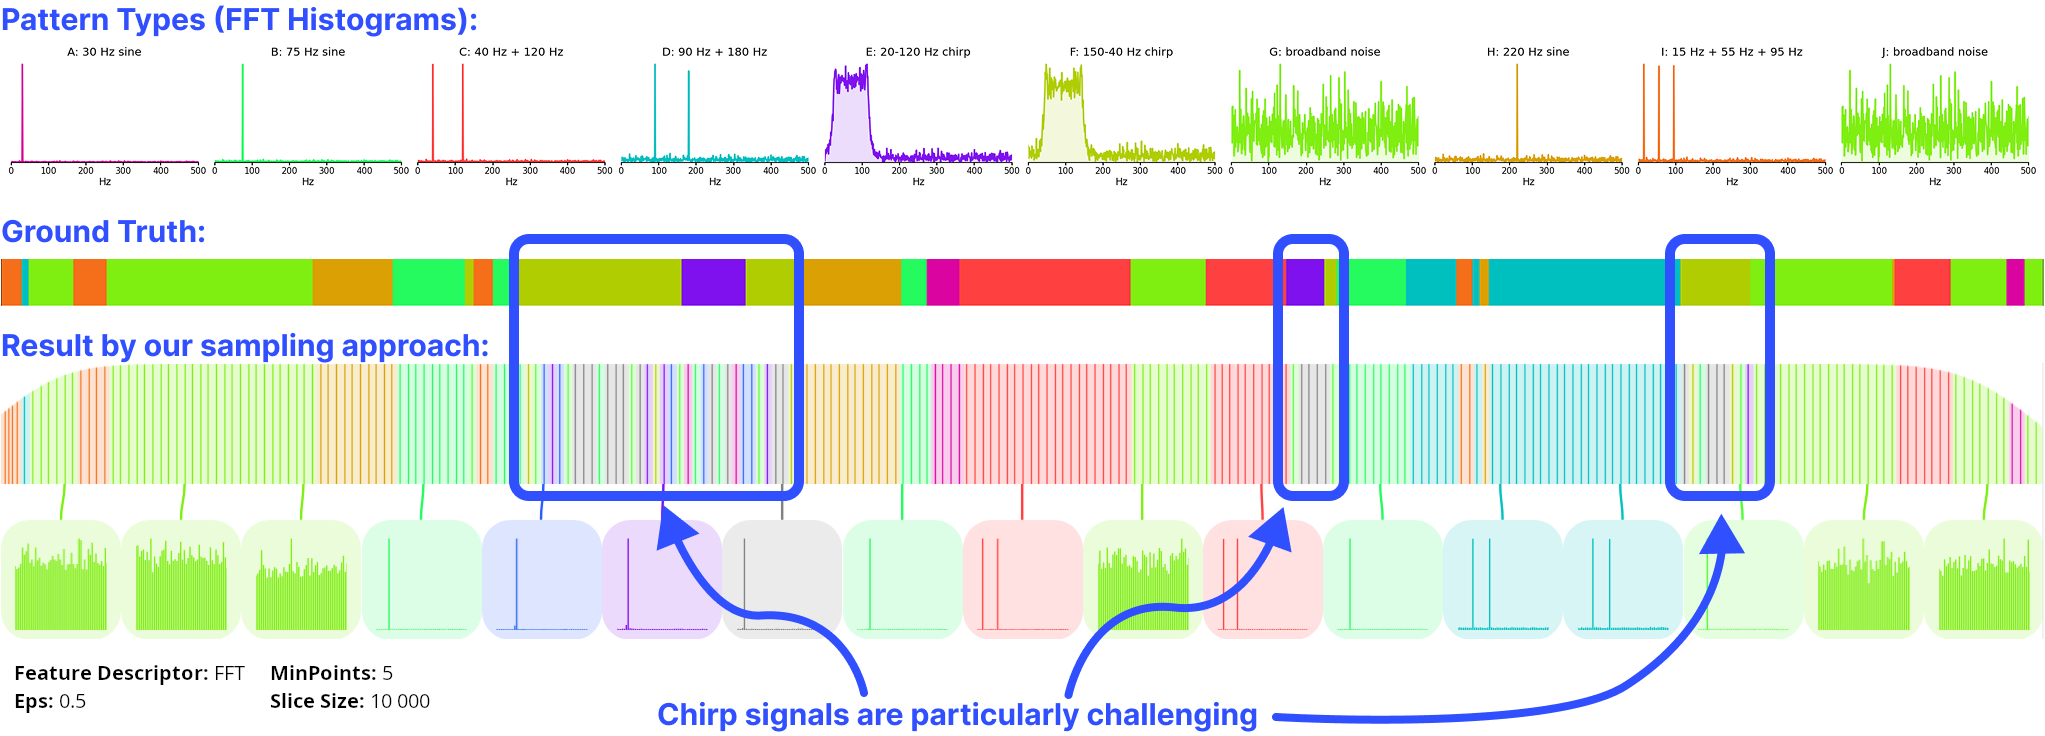
Where does it not work?
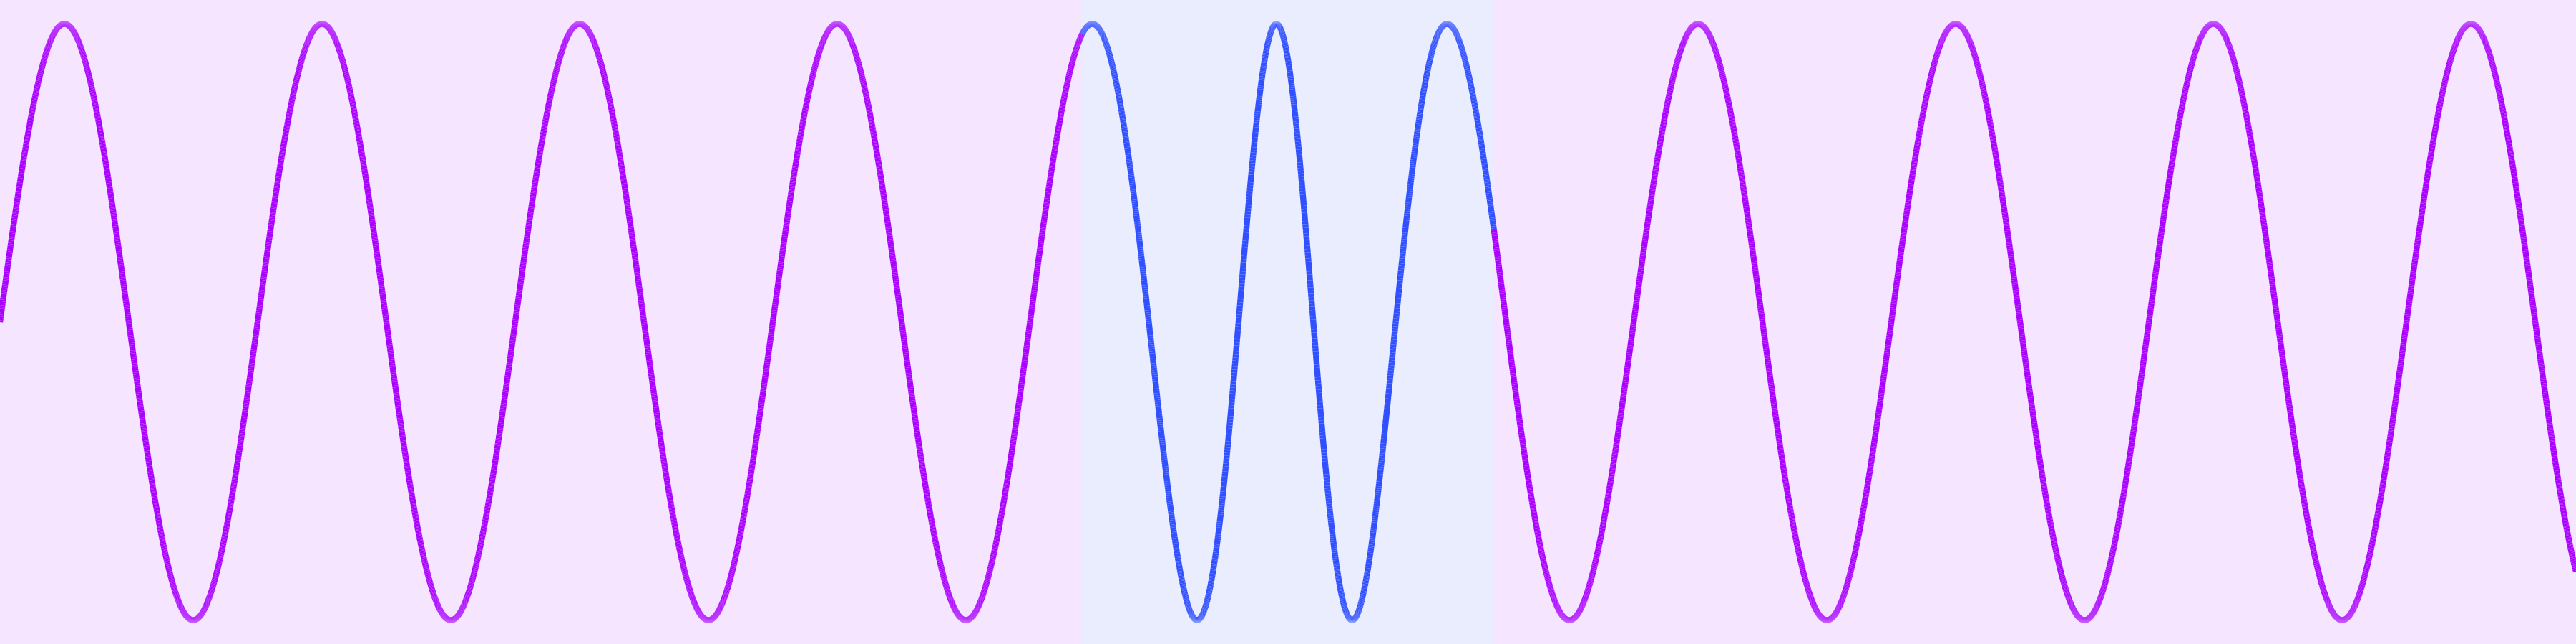
Small patterns (e.g. Anomalies) can be hard to detect
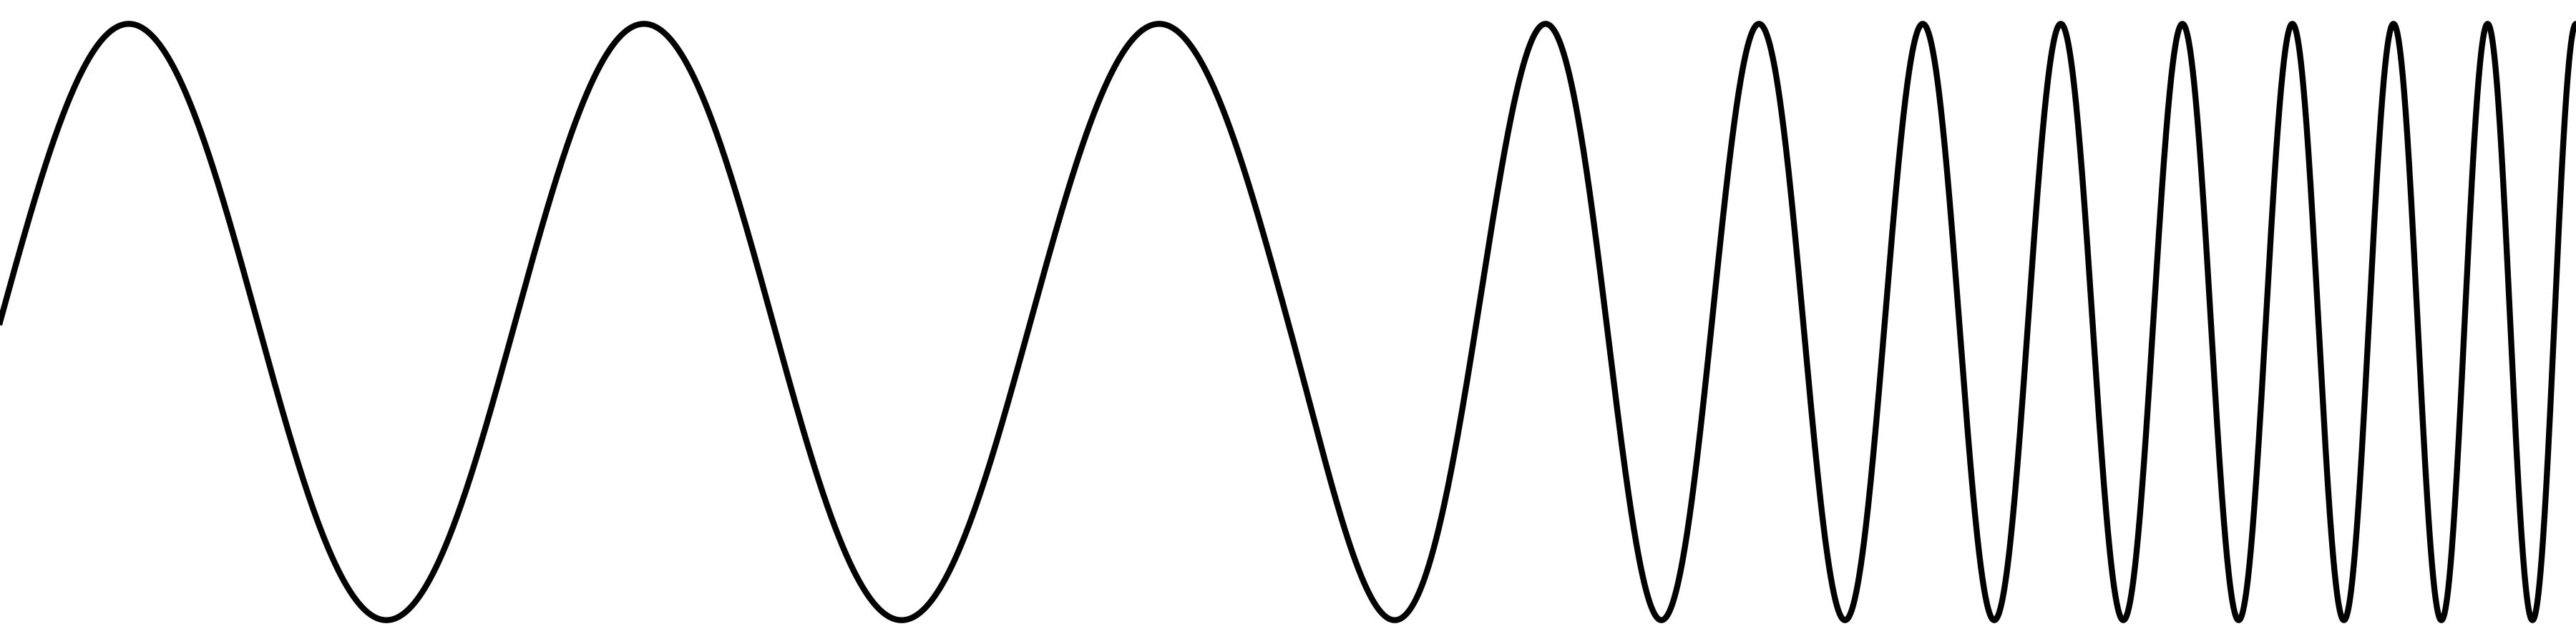
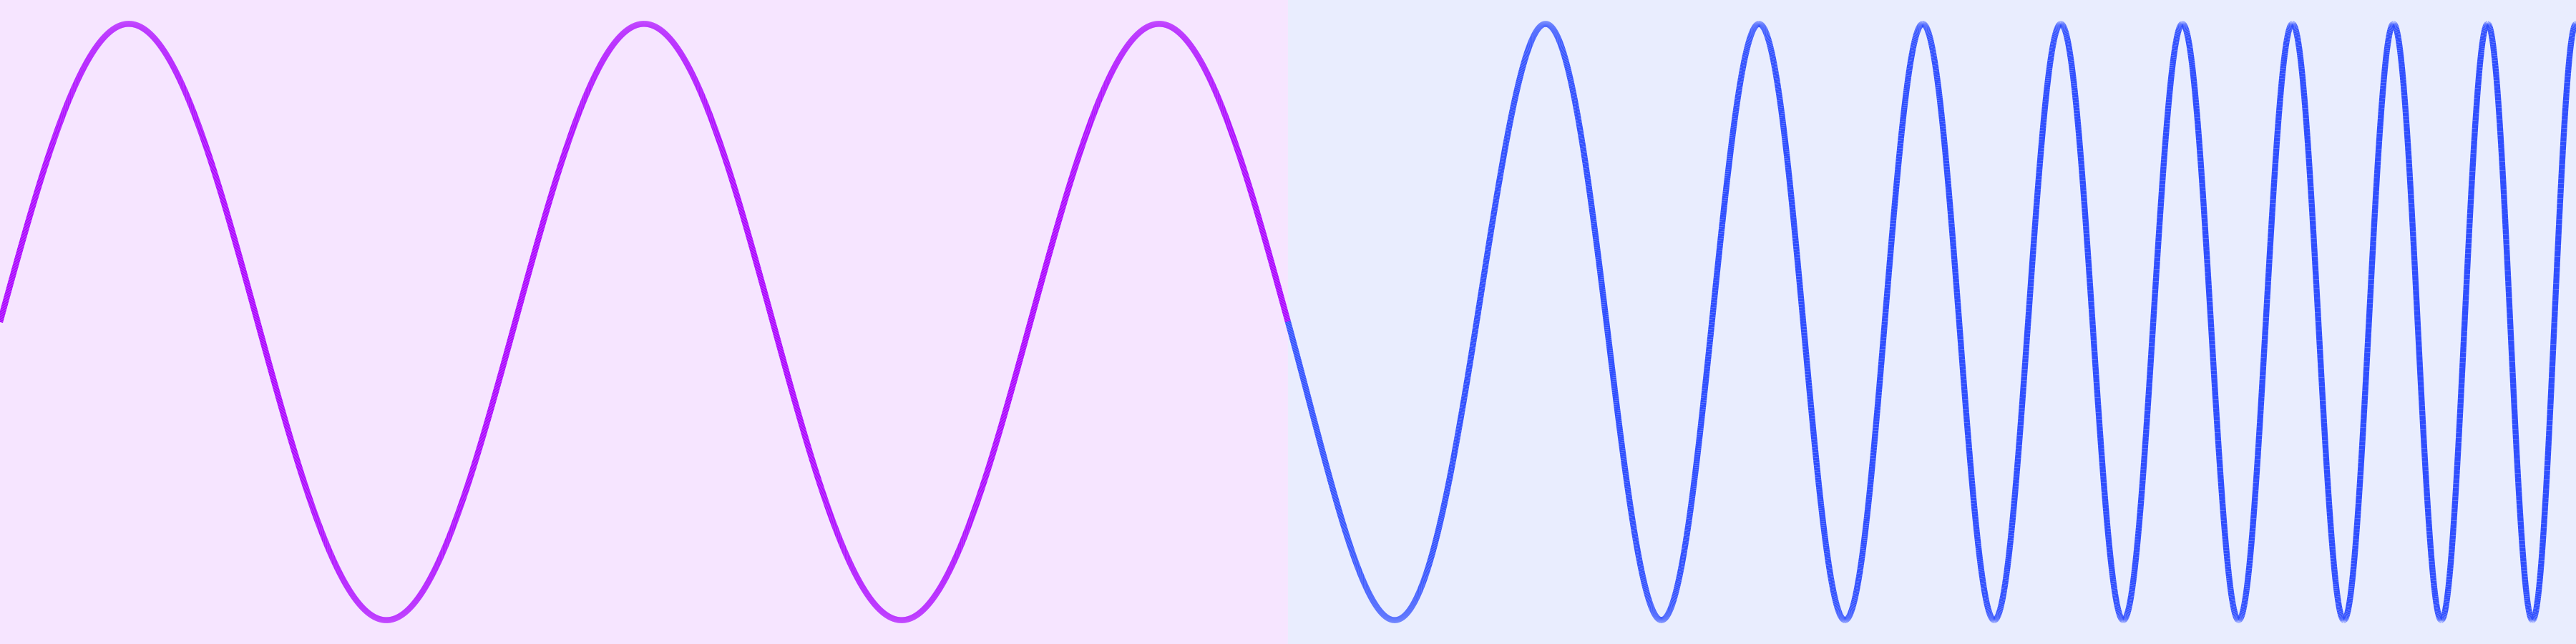
Chirp signals are challenging
Conclusion
Progressive approaches provide quick first insights for large data volumes.
Conclusion
Steering the sampling allows experts to incorporate domain knowledge.
Conclusion
Segmenting the signal helps with pattern discovery.
Vibration Signals to Detect Change Points
Thank you!
 Julian
 Rakuschek
 Johanna
 Schmidt
 Udo
Udo Schlegel
 Michèle
 Posch
 Jutta
Jutta Isopp
 Tobias
 Schreck

Open Source

PRESENT and ENVIRON-HYDRO

Slides
Appendix
Future Work (1)
More screen space for small segments
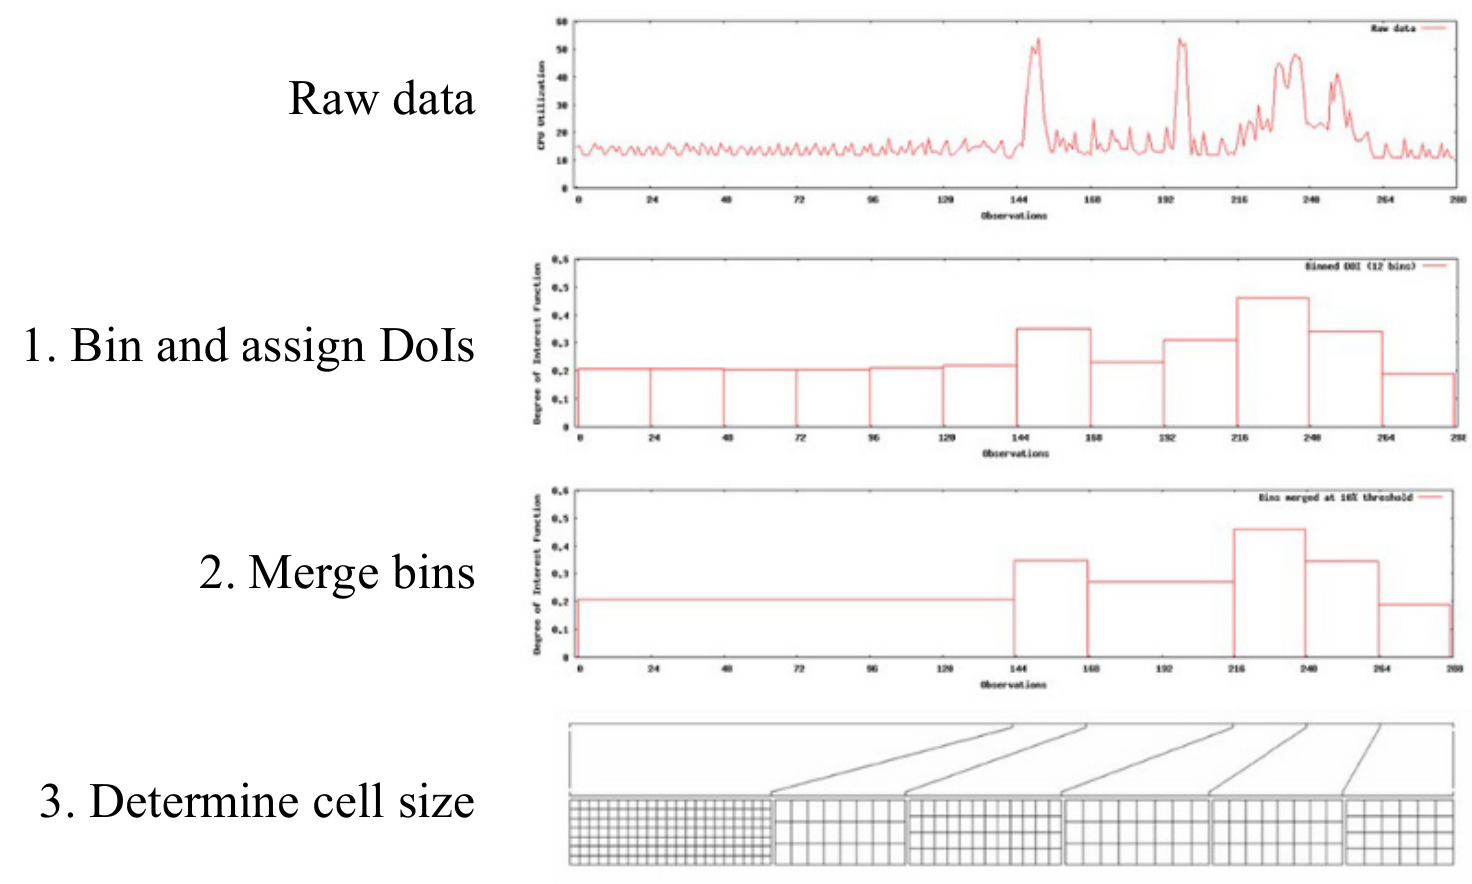
Hao, M., U. Dayal, D. Keim, and T. Schreck (2007). “Multi-Resolution Techniques for Visual Exploration of Large Time-Series Data”.
Future Work (2)
Uncertain boundaries
Instead of hard boundaries
Future Work (3)
Remove excess samples
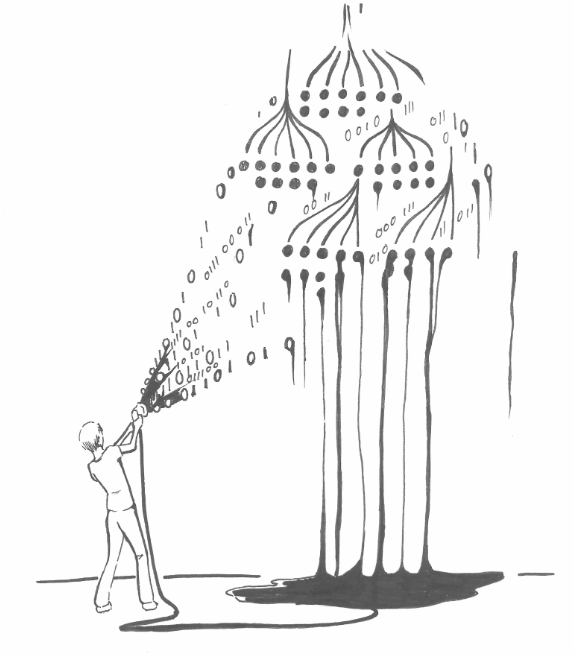
Hans-Jörg Schulz and Chris Weaver (2024). "Transient Visual Analytics".
Related Work (1)
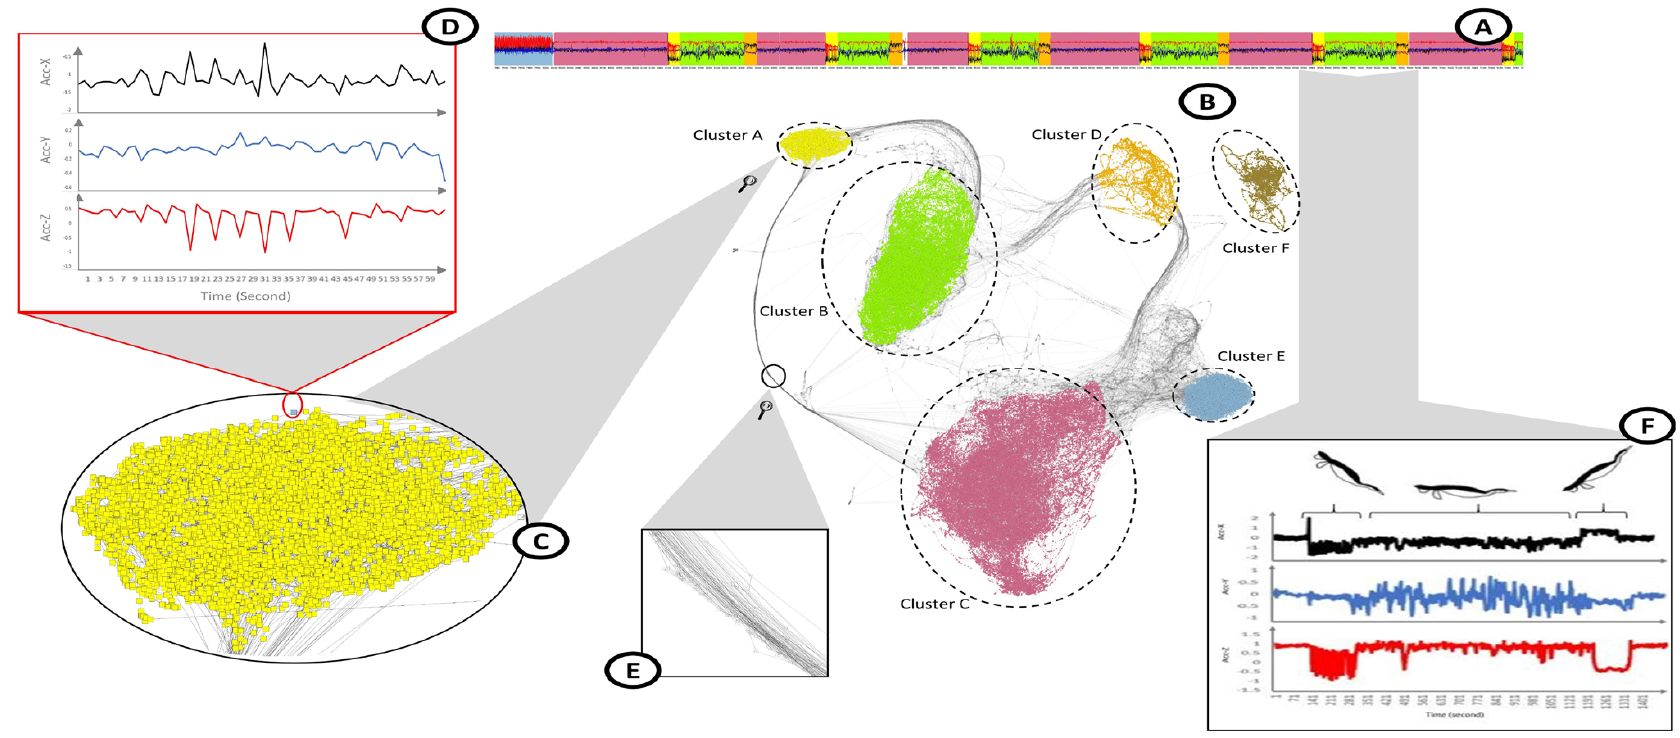
Ali, Mohammed et al. “TimeCluster: dimension reduction applied to temporal data for visual analytics.”
The Visual Computer 35 (2019): 1013 - 1026.
Related Work (2)
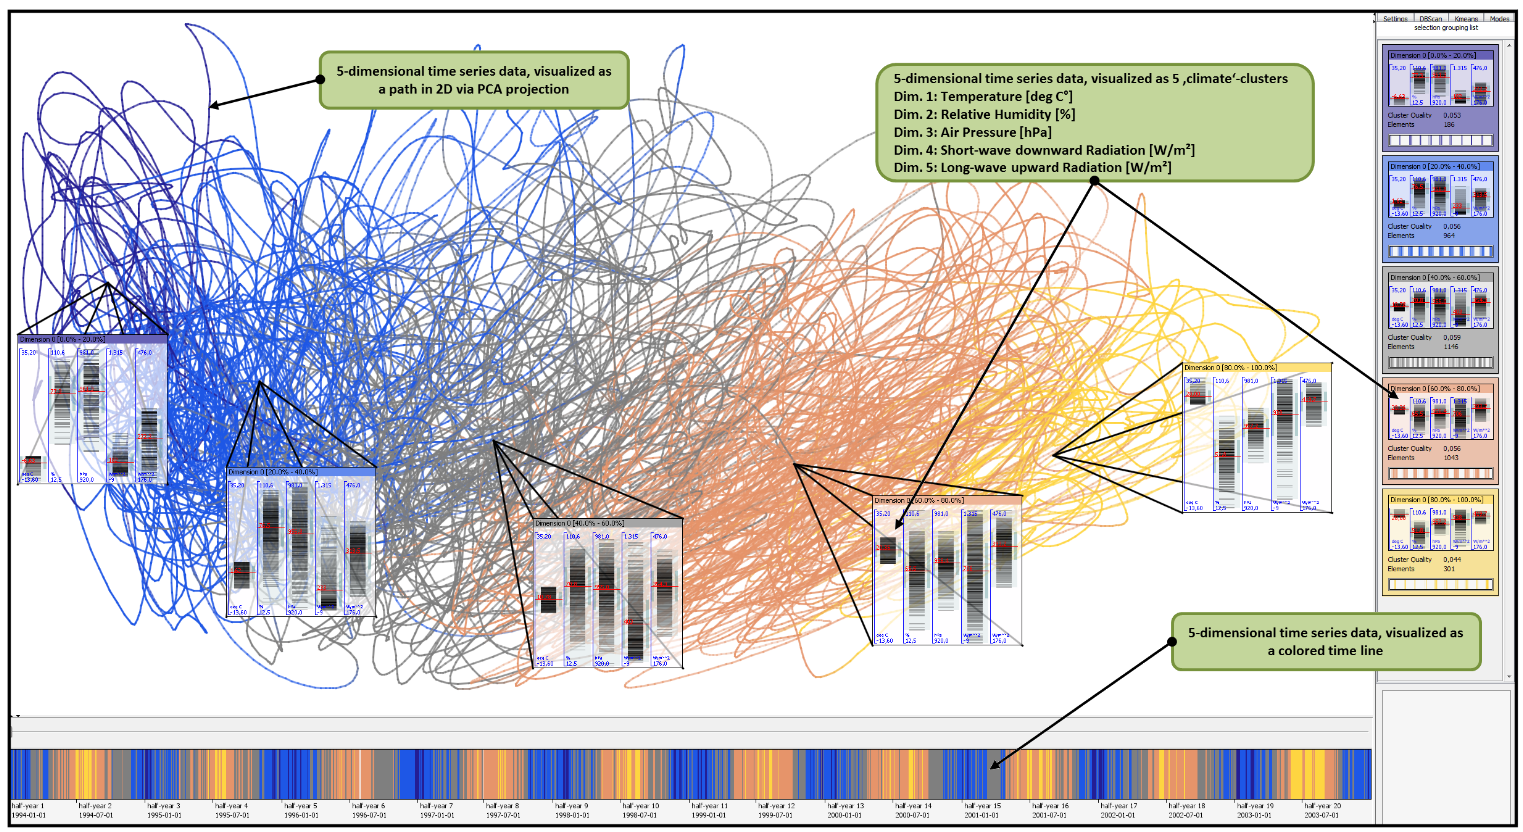
Bernard, J. et al. “TimeSeriesPaths : Projection-Based Explorative Analysis of Multivariate Time Series Data.”
International Conference in Central Europe on Computer Graphics and Visualization (2012).
Related Work (3)
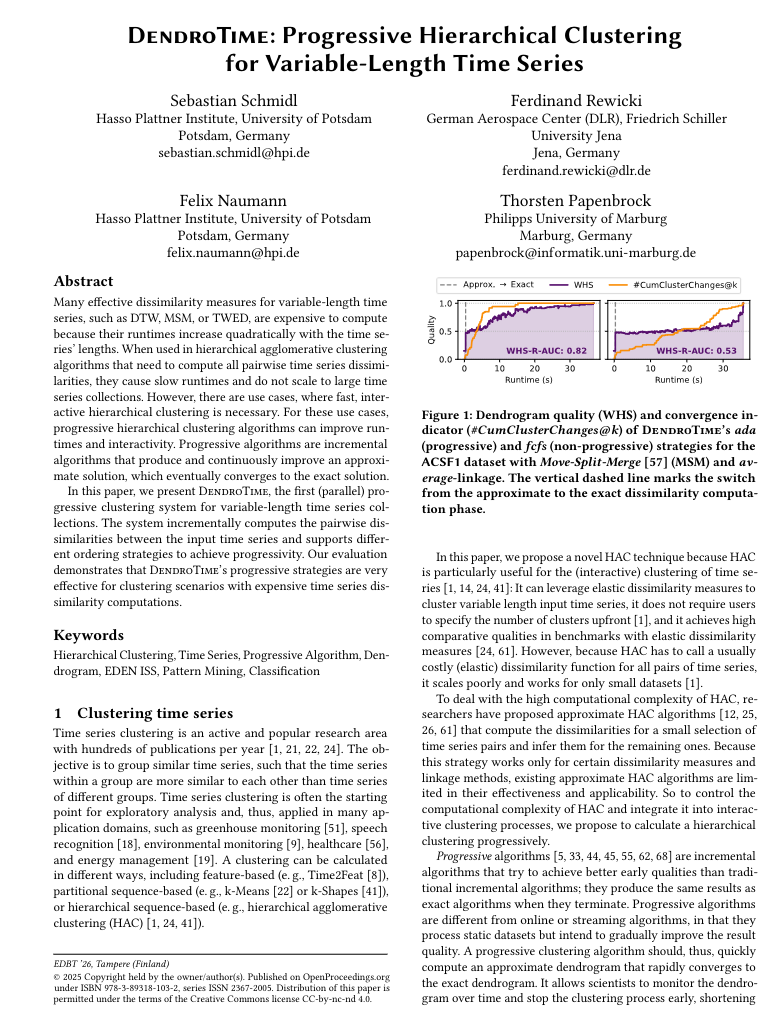
Schmidl, Sebastian et al. “DendroTime: Progressive Hierarchical Clustering for Variable-Length Time Series.” International Conference on Extending Database Technology (2026).