How to read these slides?
 Overview
Click on the menu bar items to navigate to chapters
Click here for PDF version
WP2 Prototypes
Julian Rakuschek
16.01.2025
Our Main Quest
D2.2 Visualizations for AI results and for AI explainability
Task 2.4 Development of a web-based visualization including domain-specific visualizations
Task 2.5 Development of visual explanations for AI results
Currently four prototypes:
Cluster and Search

Anomalies
Forecasting
Vibrations
All are meant for Task 2.4, Task 2.5 is WIP
The Prototypes are Task-Oriented
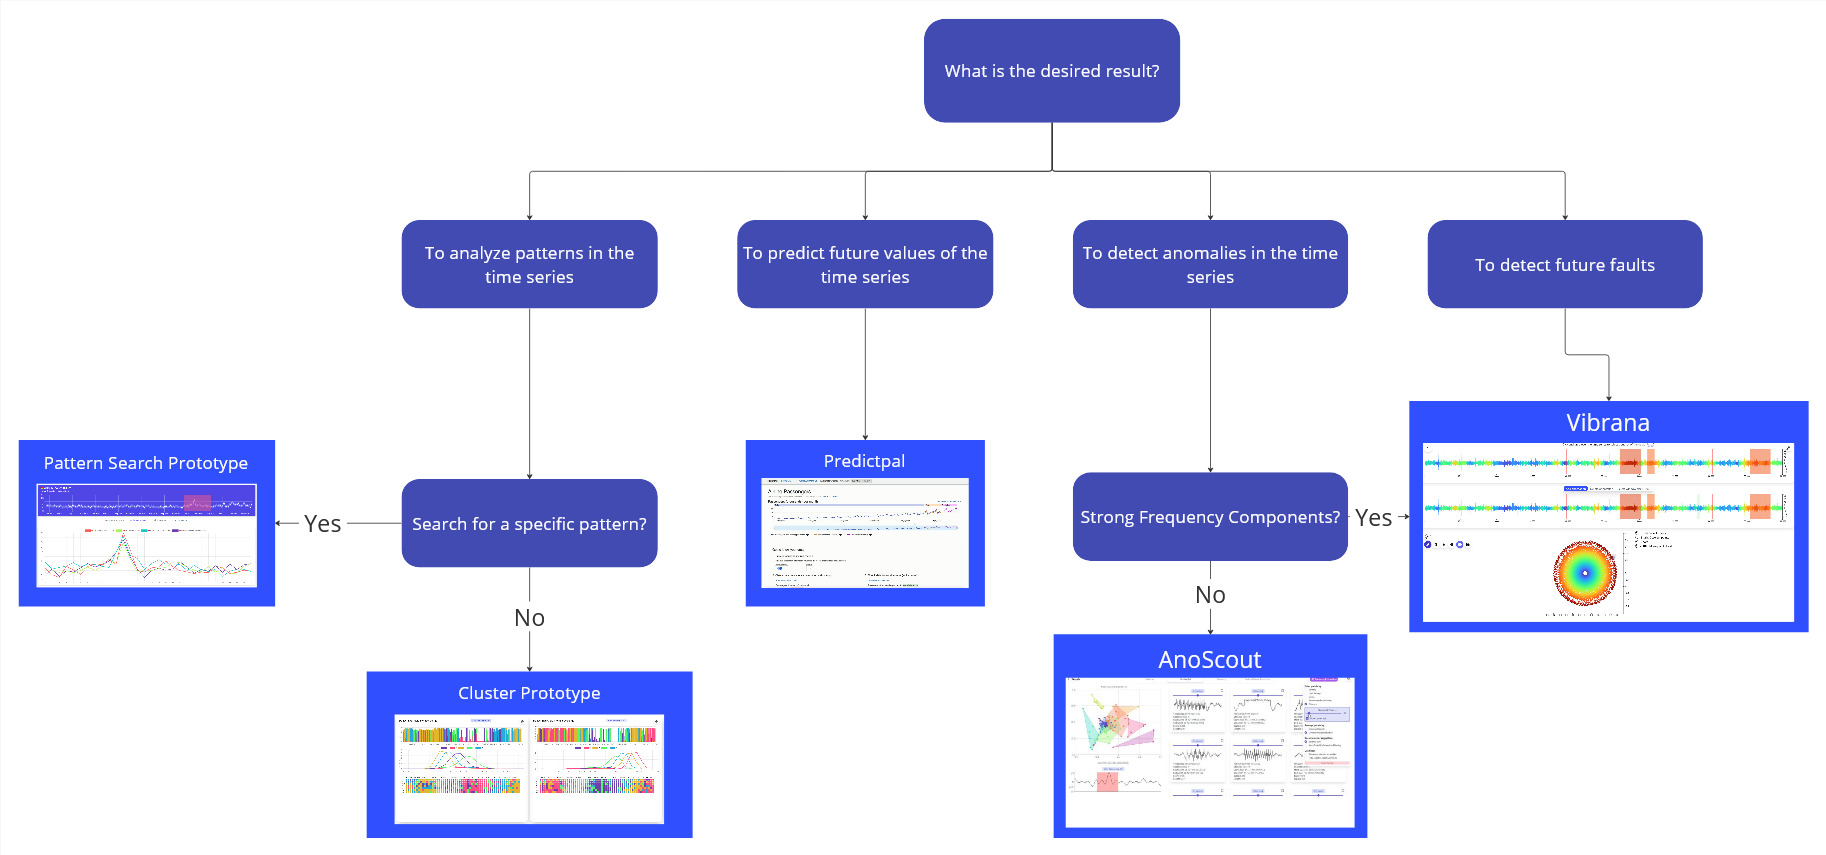
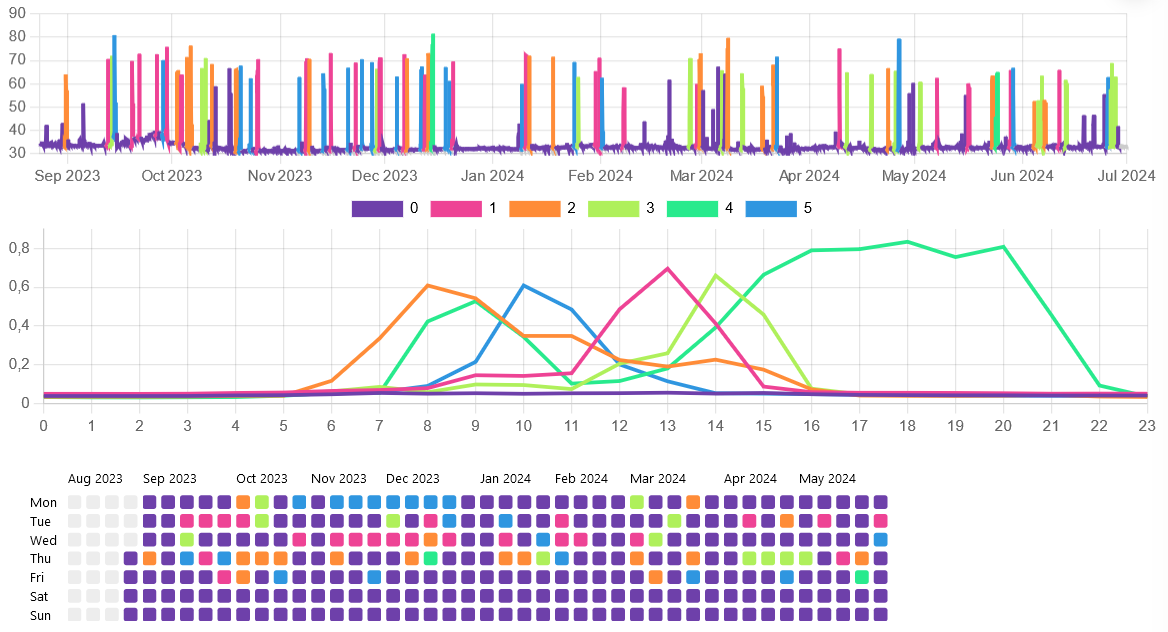
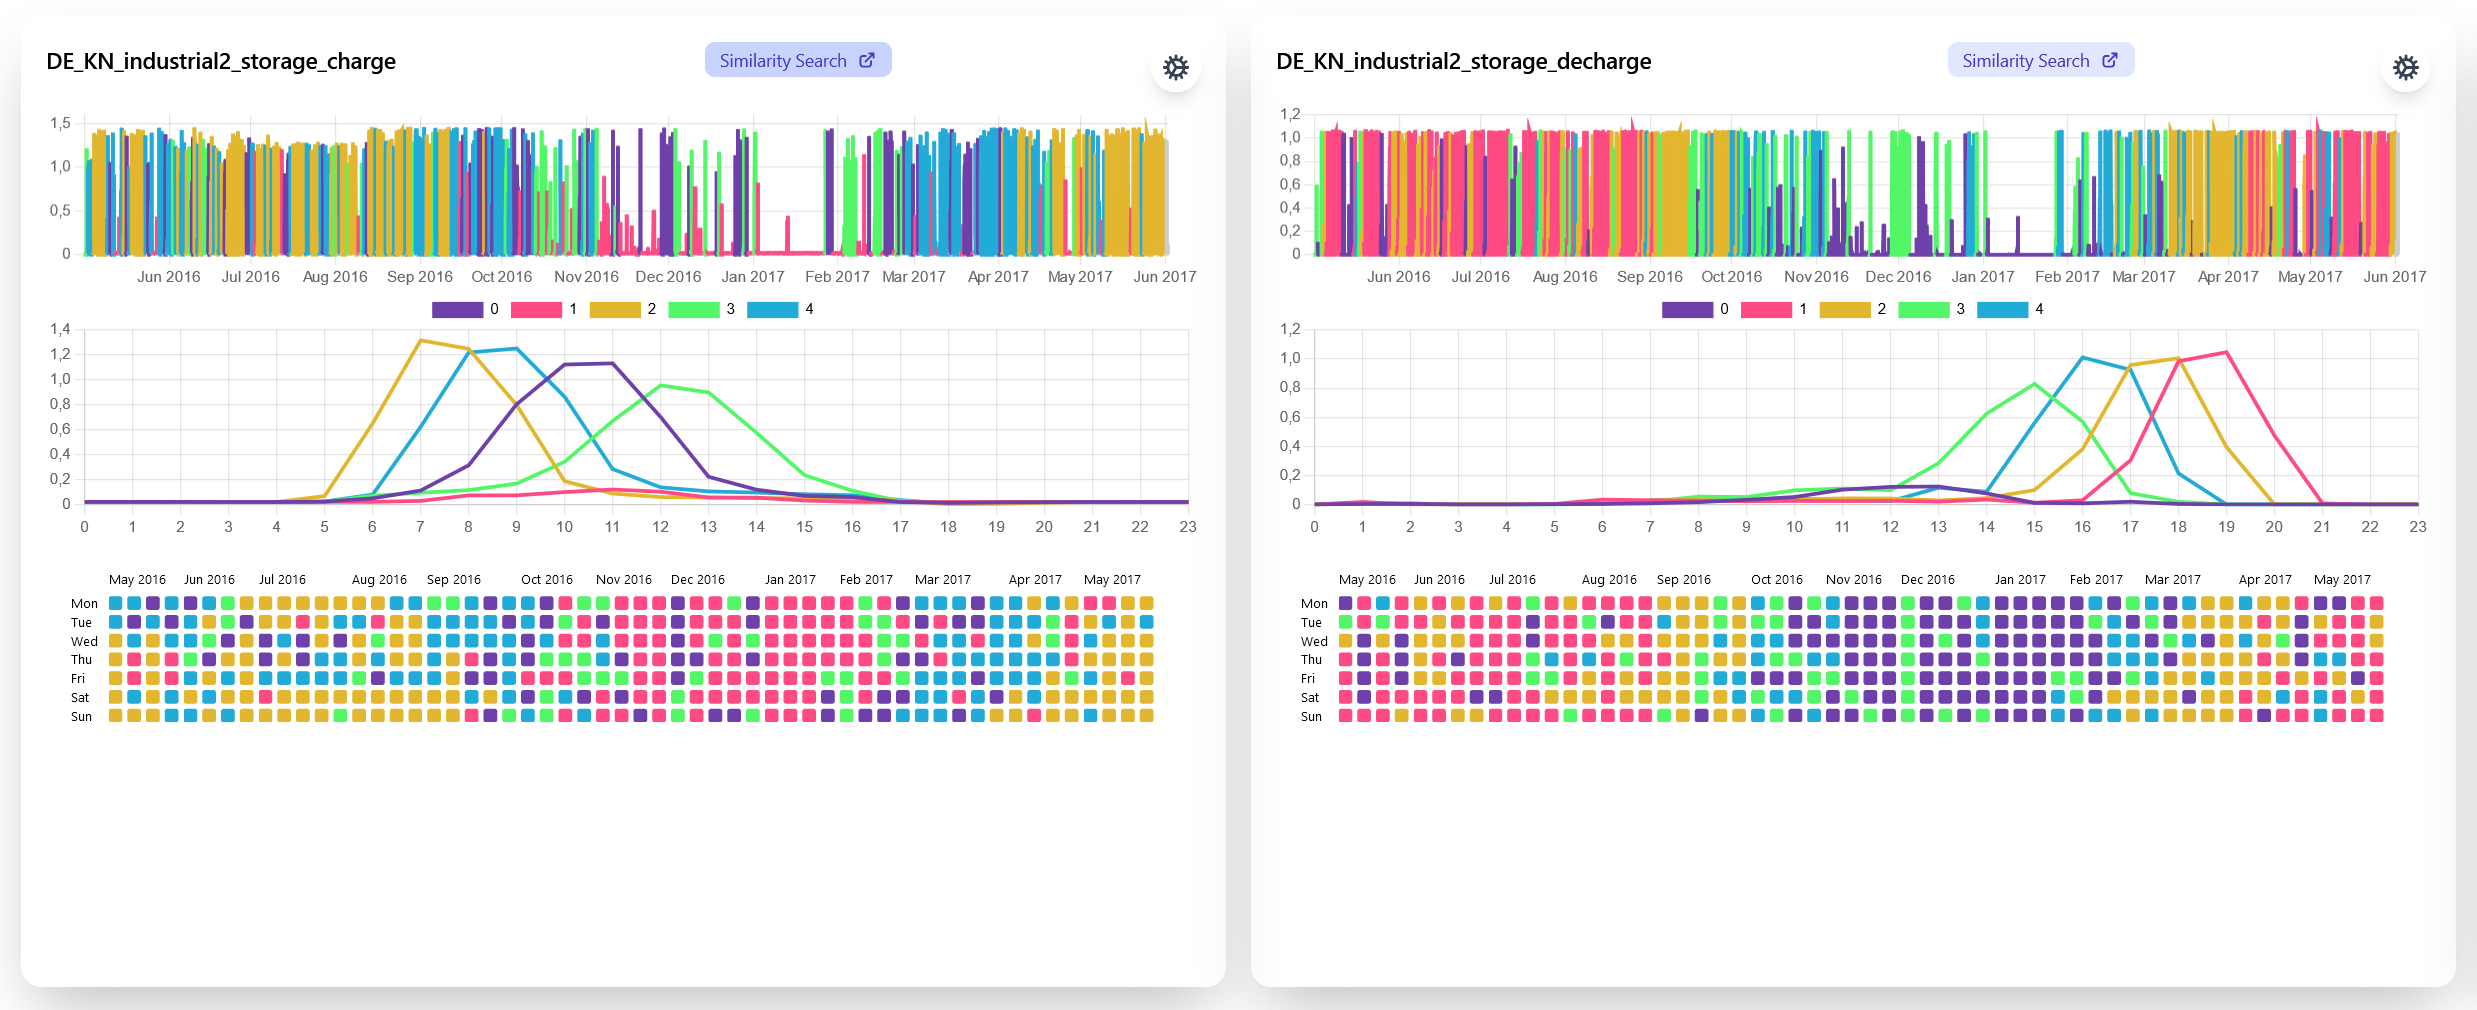
Cluster & Search
Cluster & Search Prototype Goals
- Find pattern groups and compare across seasons
- Find anomalies
- Compare channels
Clustering Recorded Noise Level from a Seminar Room
PV Energy Production of Households
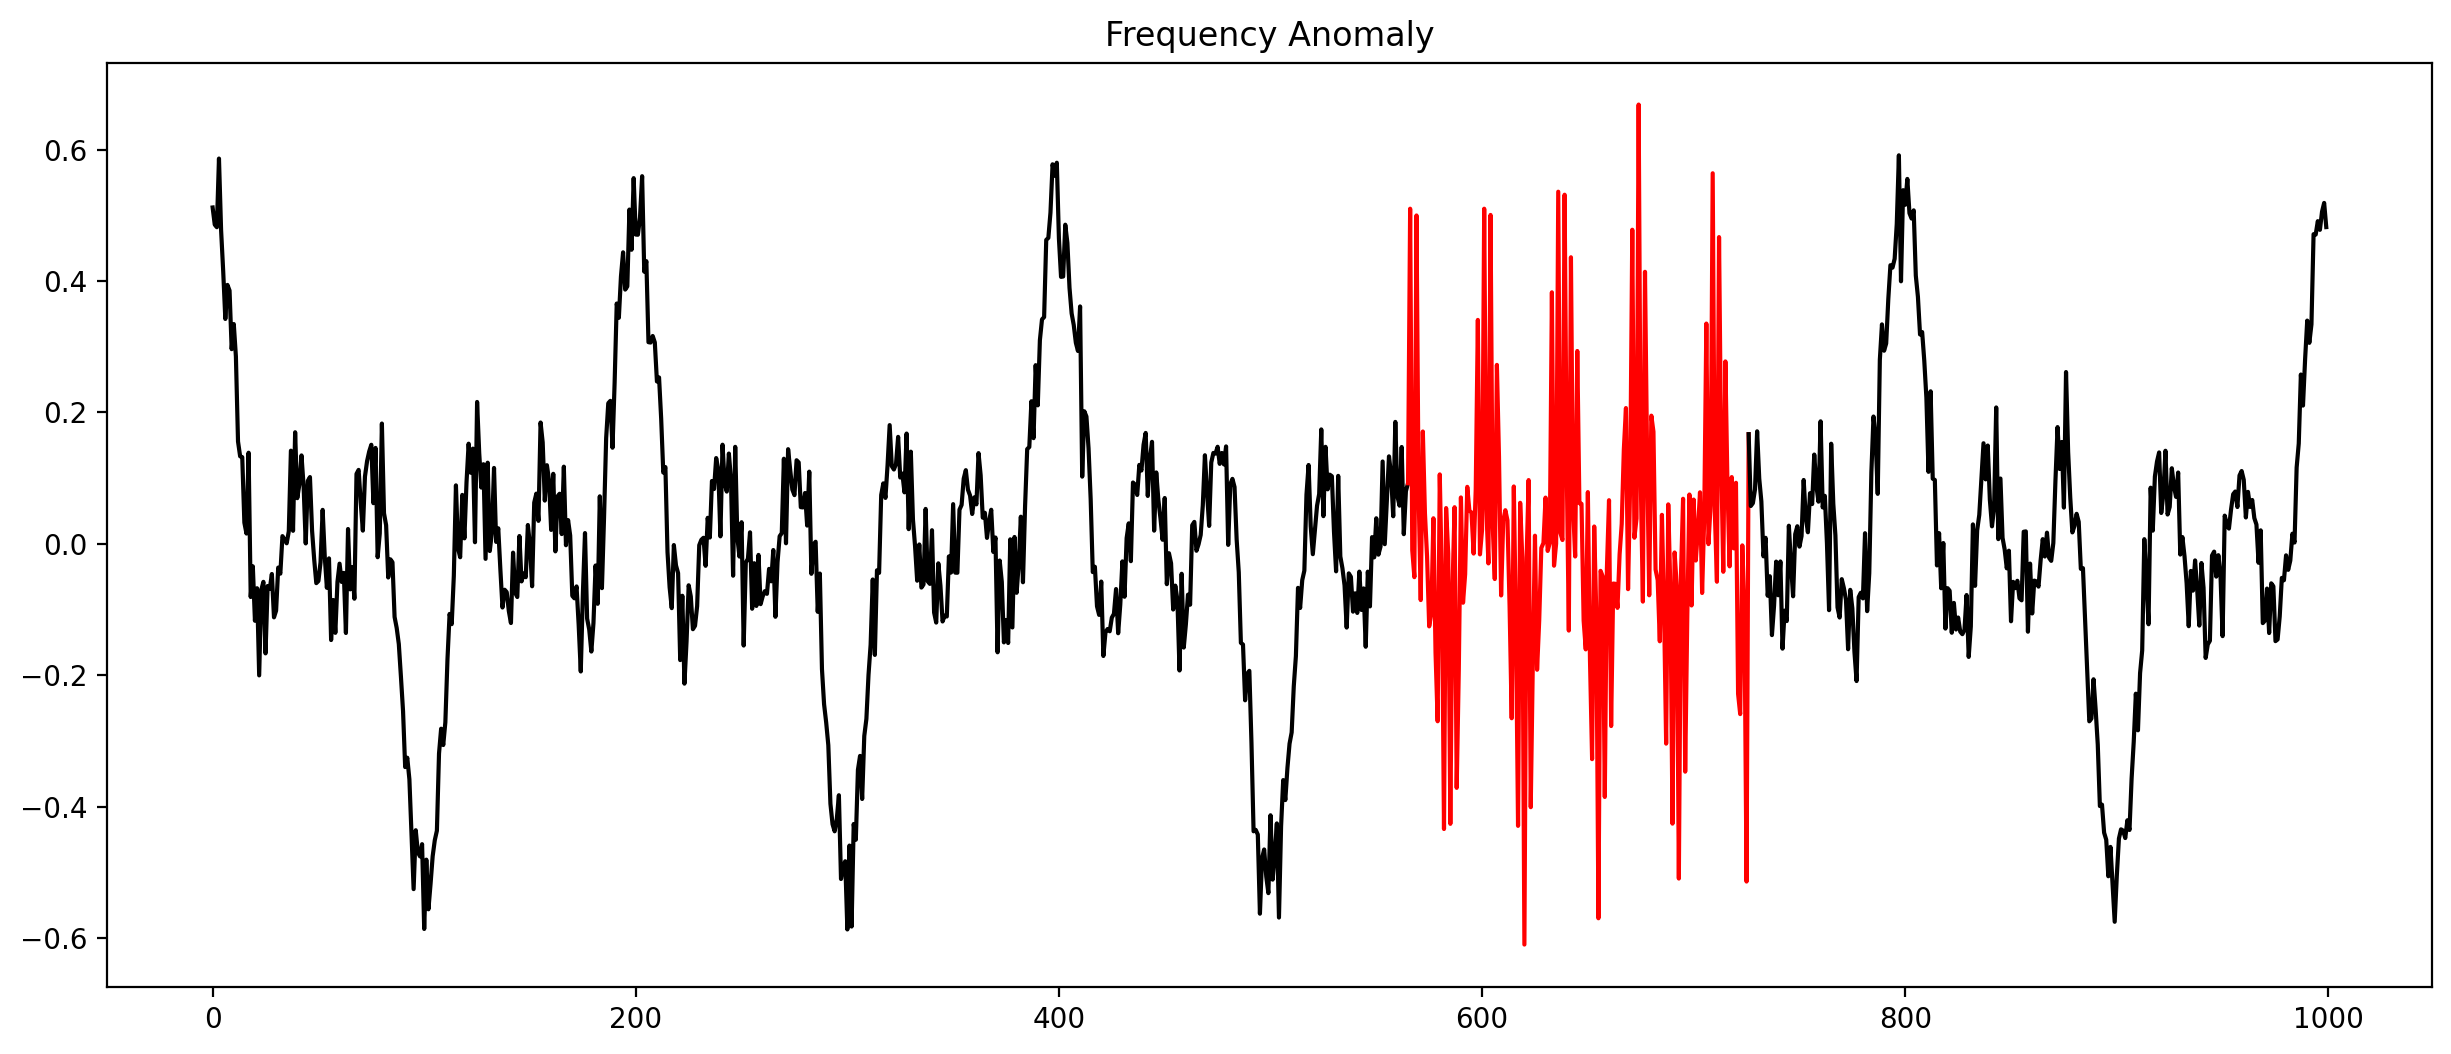
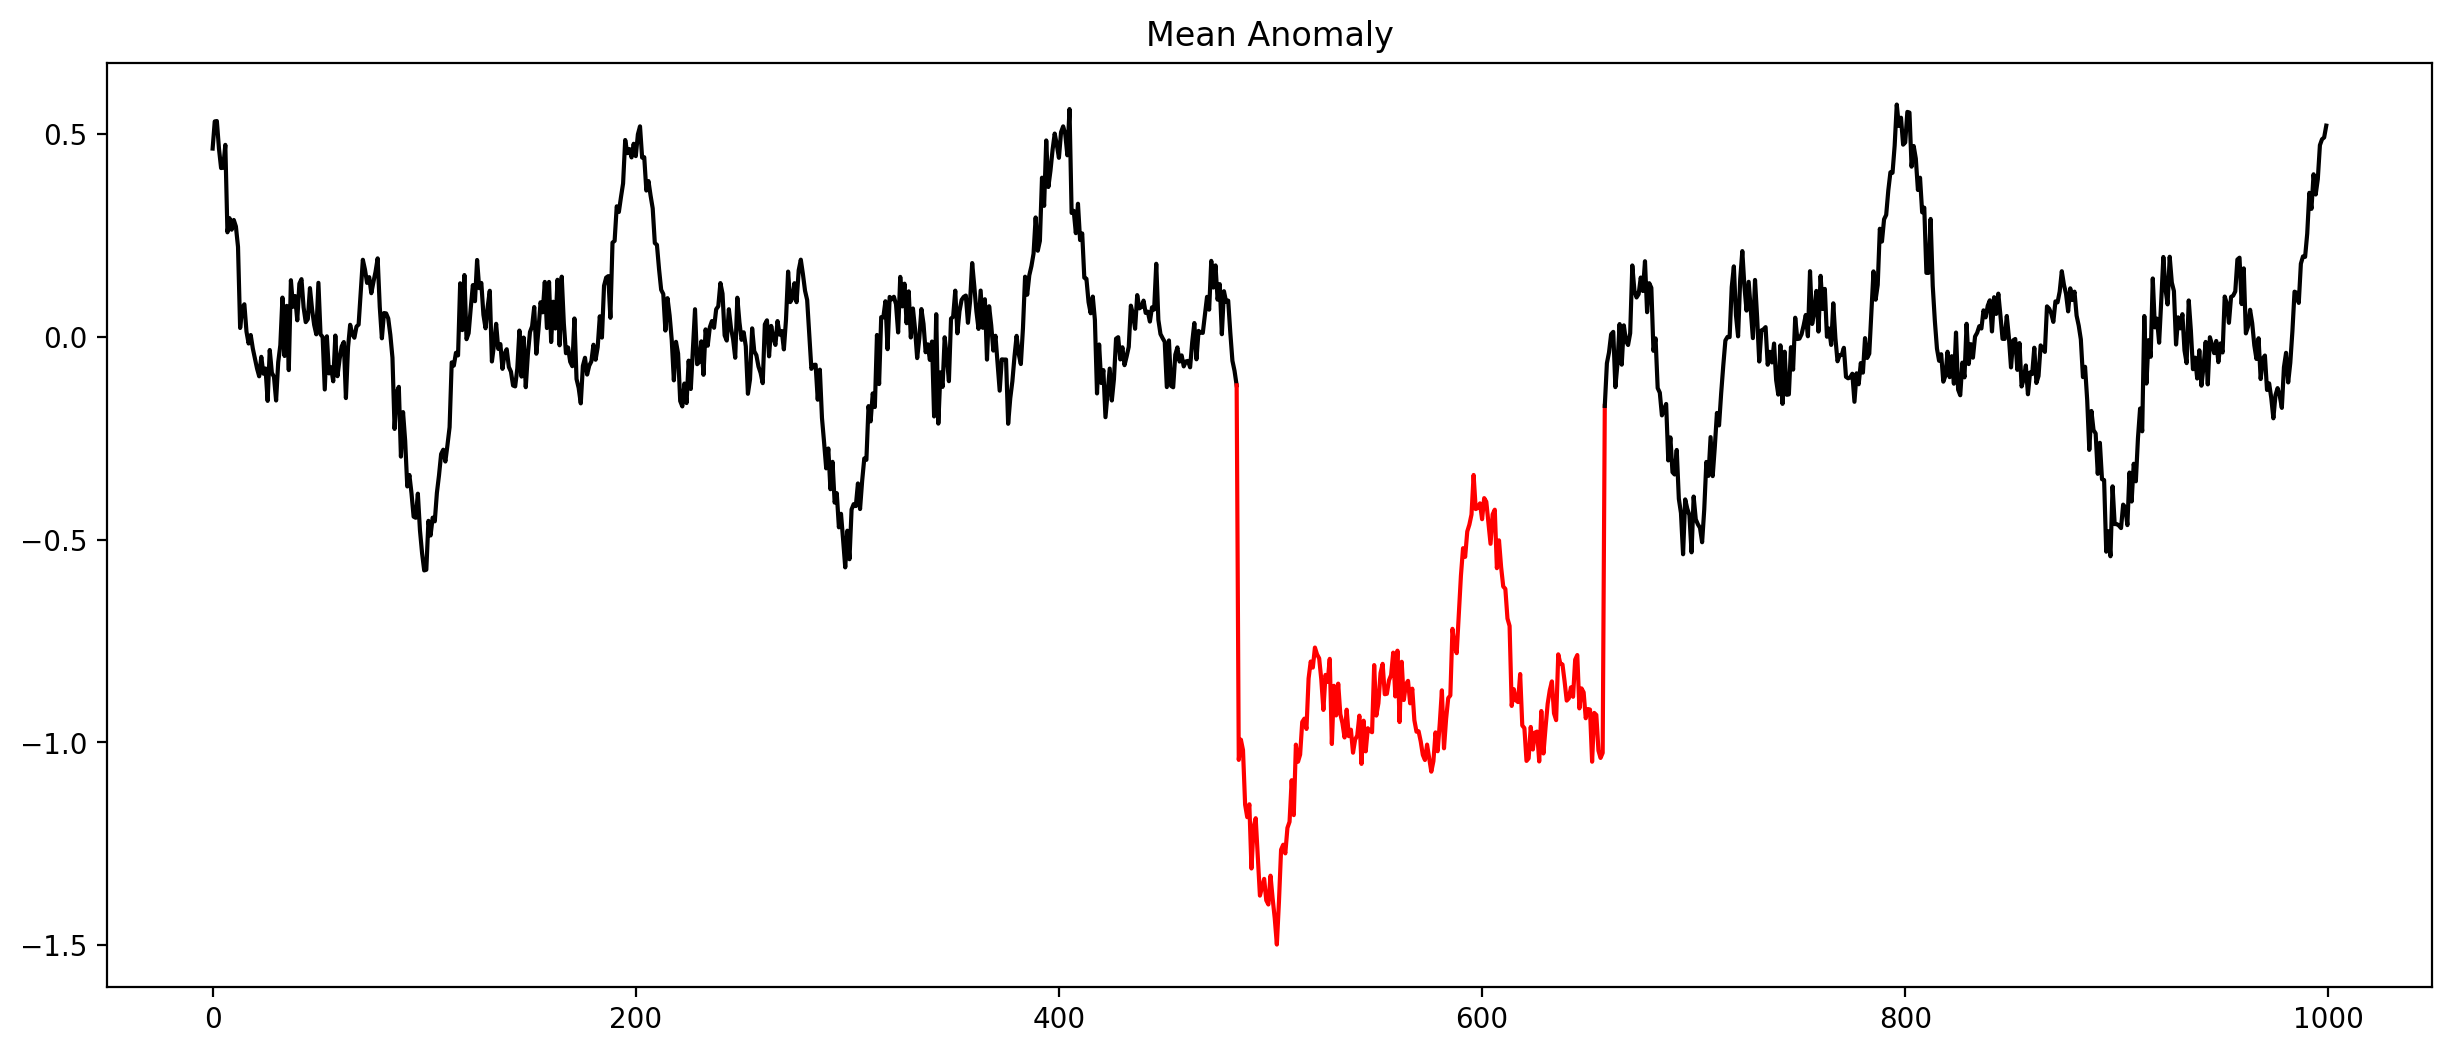
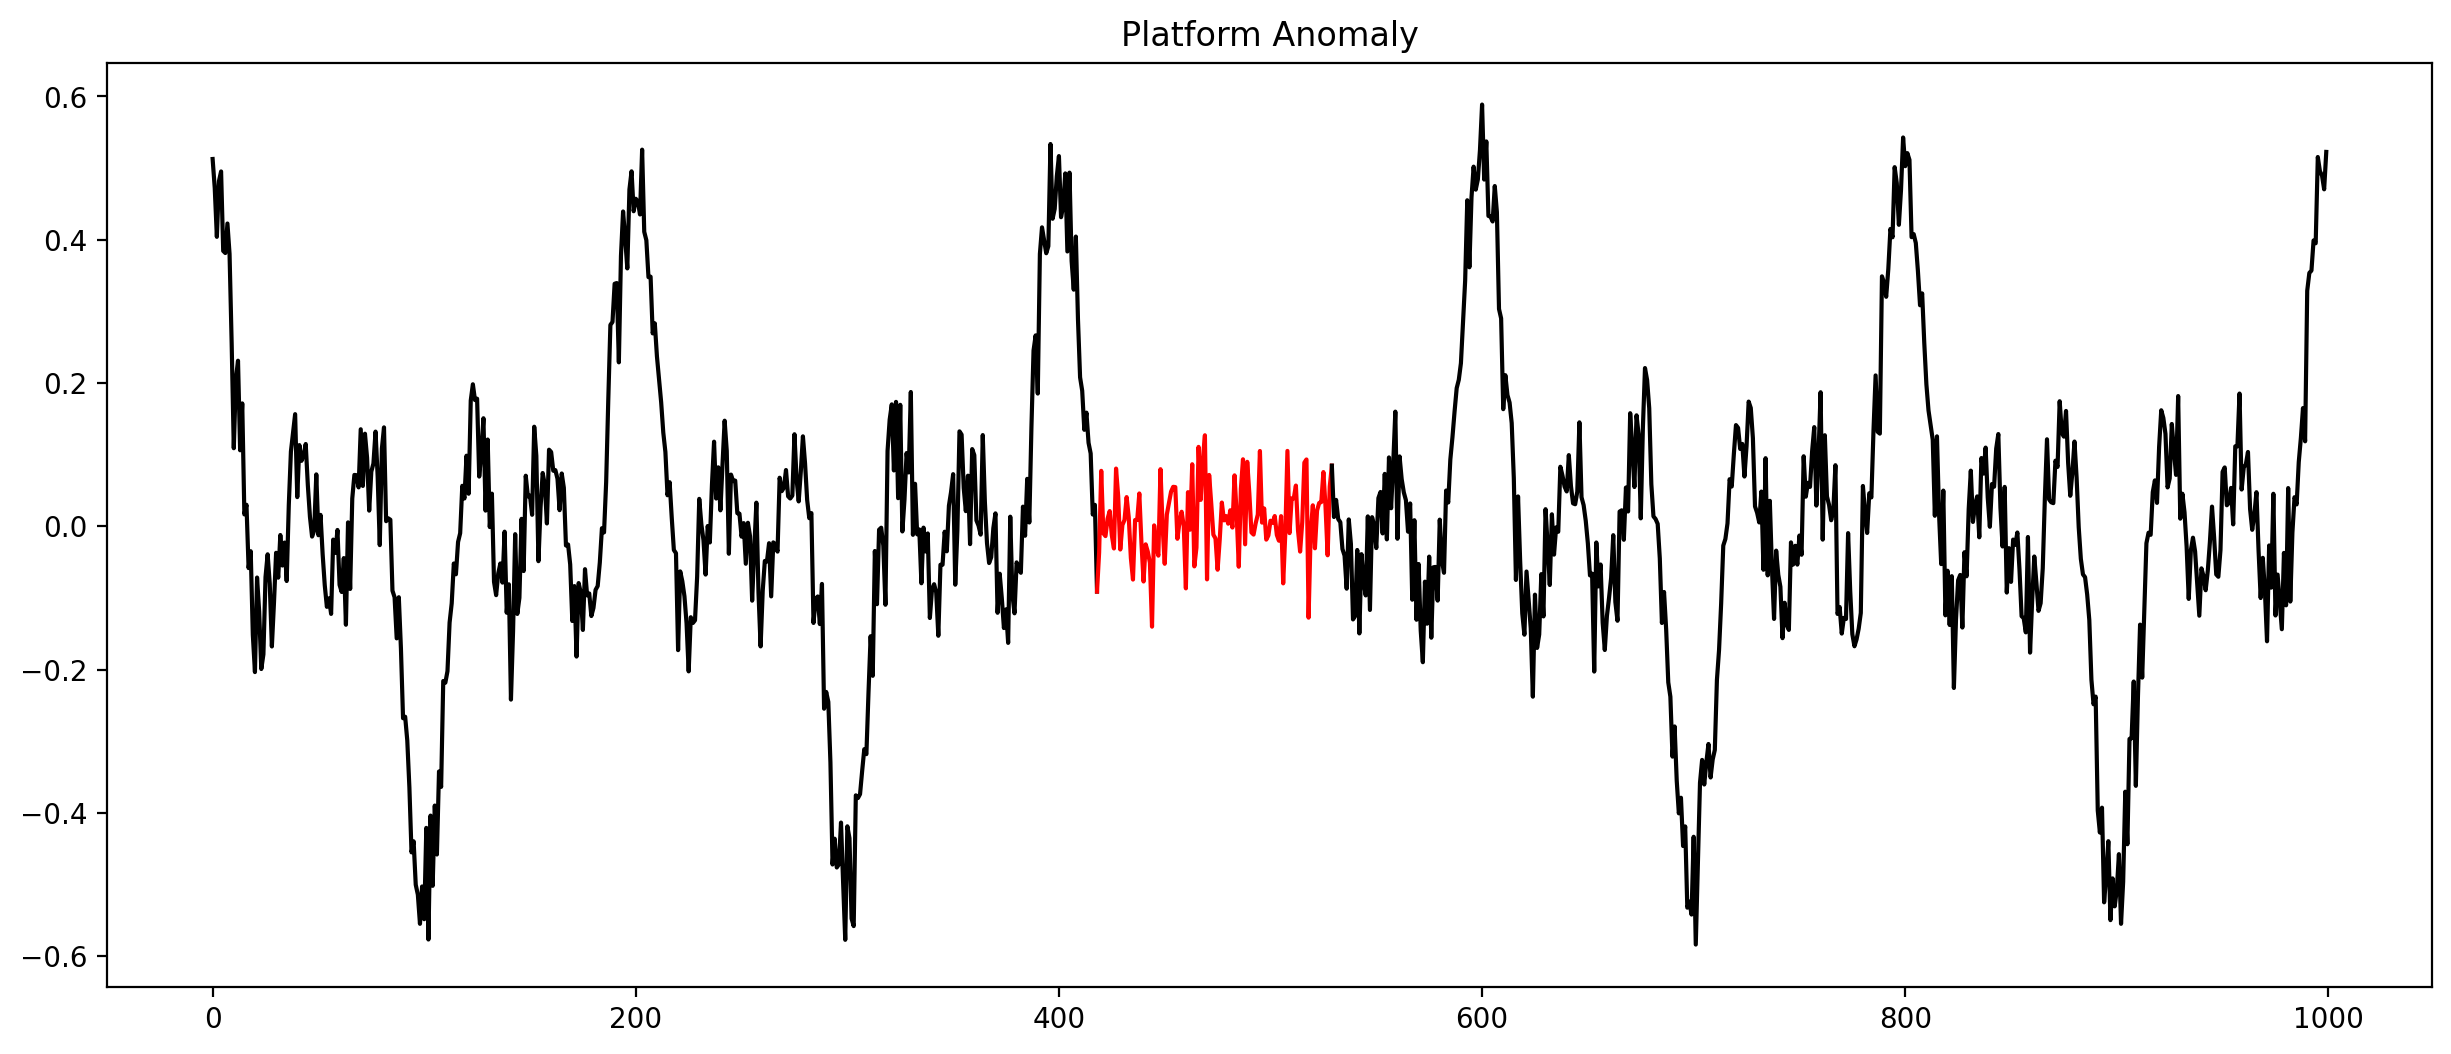
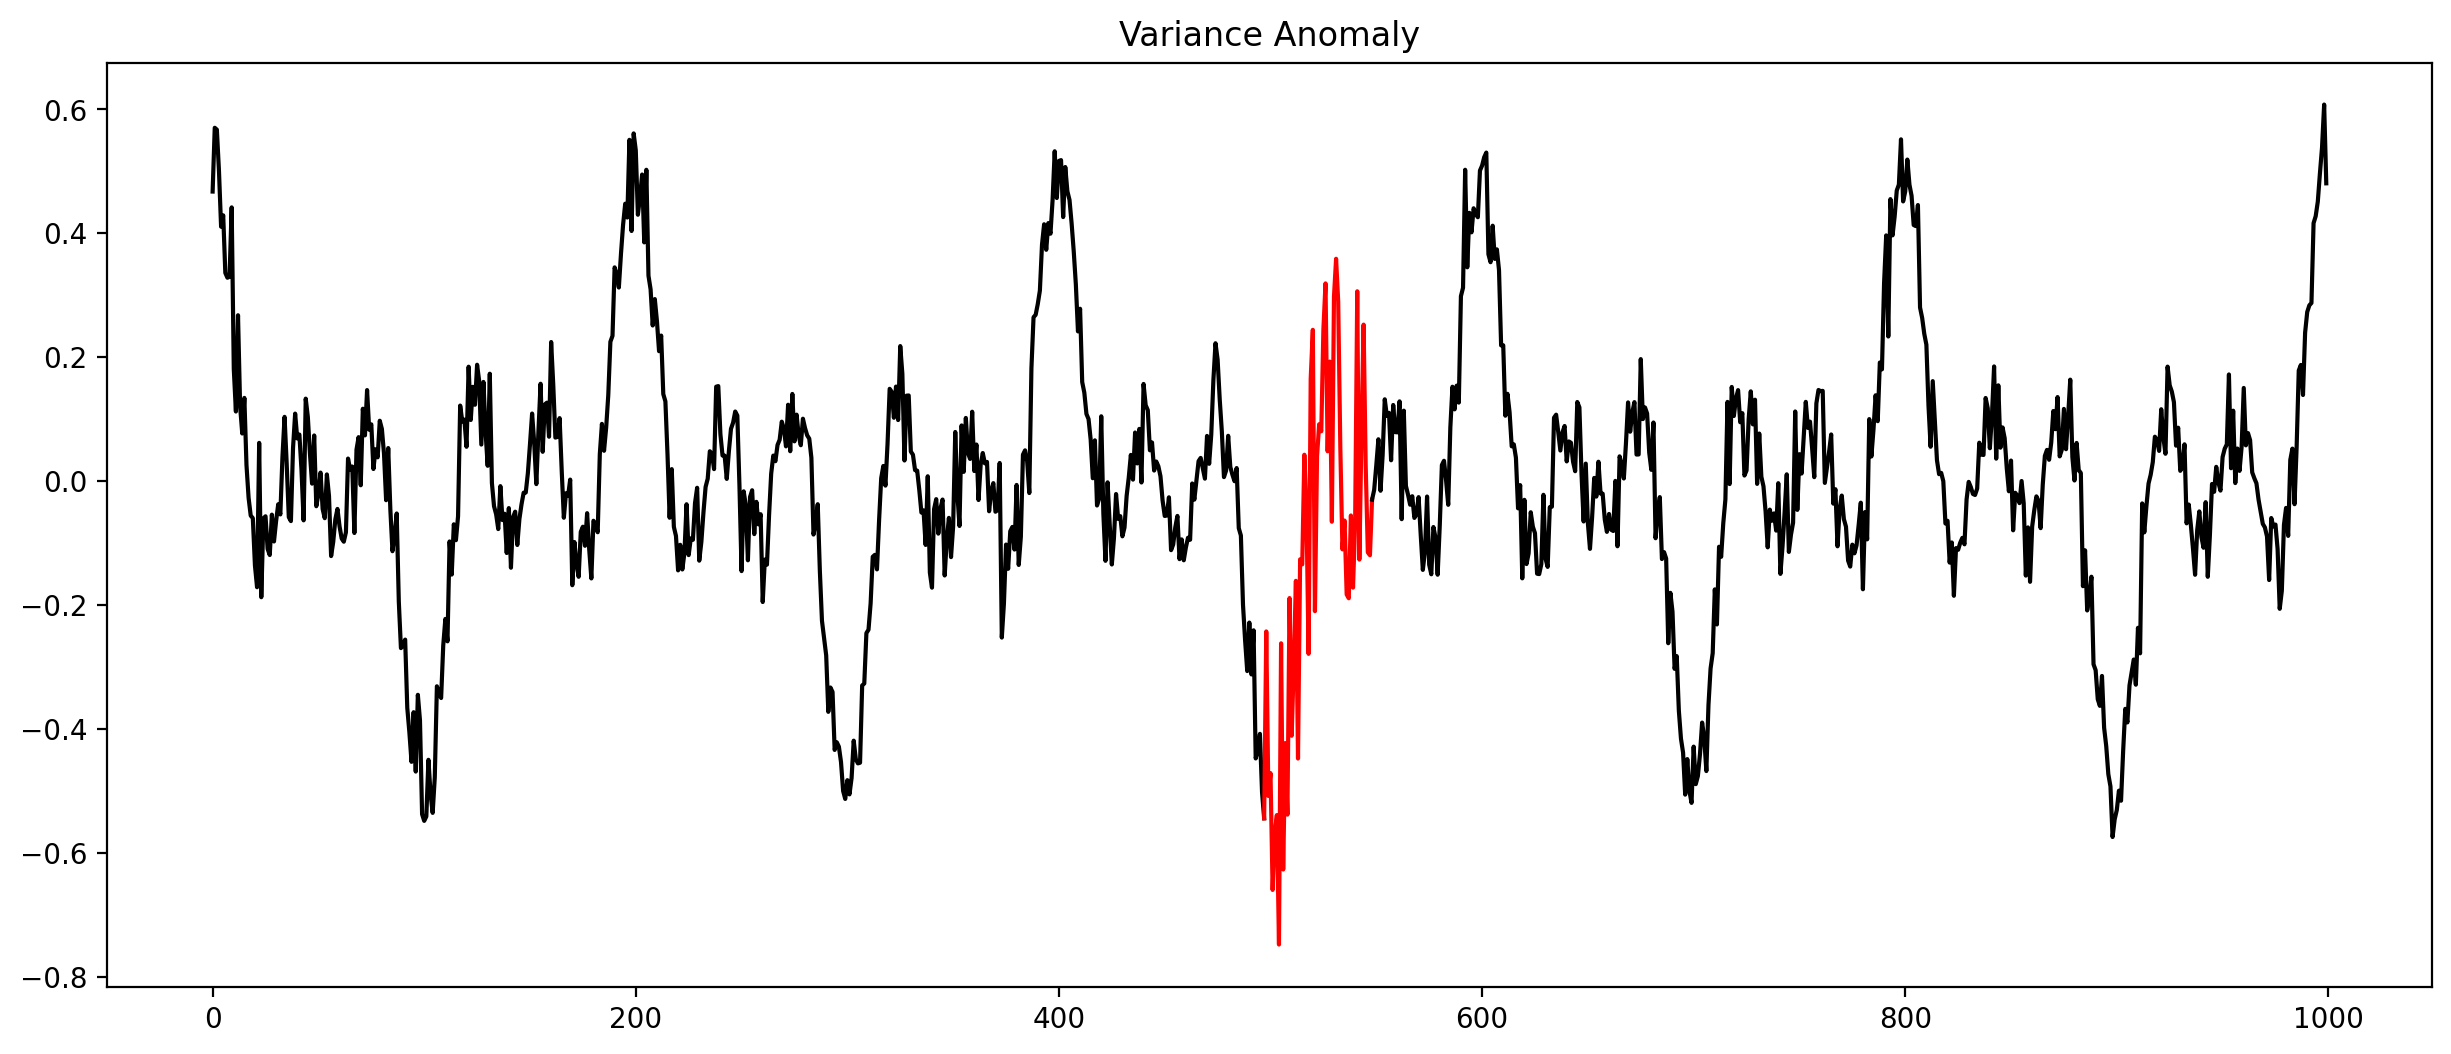
Anomalies
Anomalies in time series (Selection)
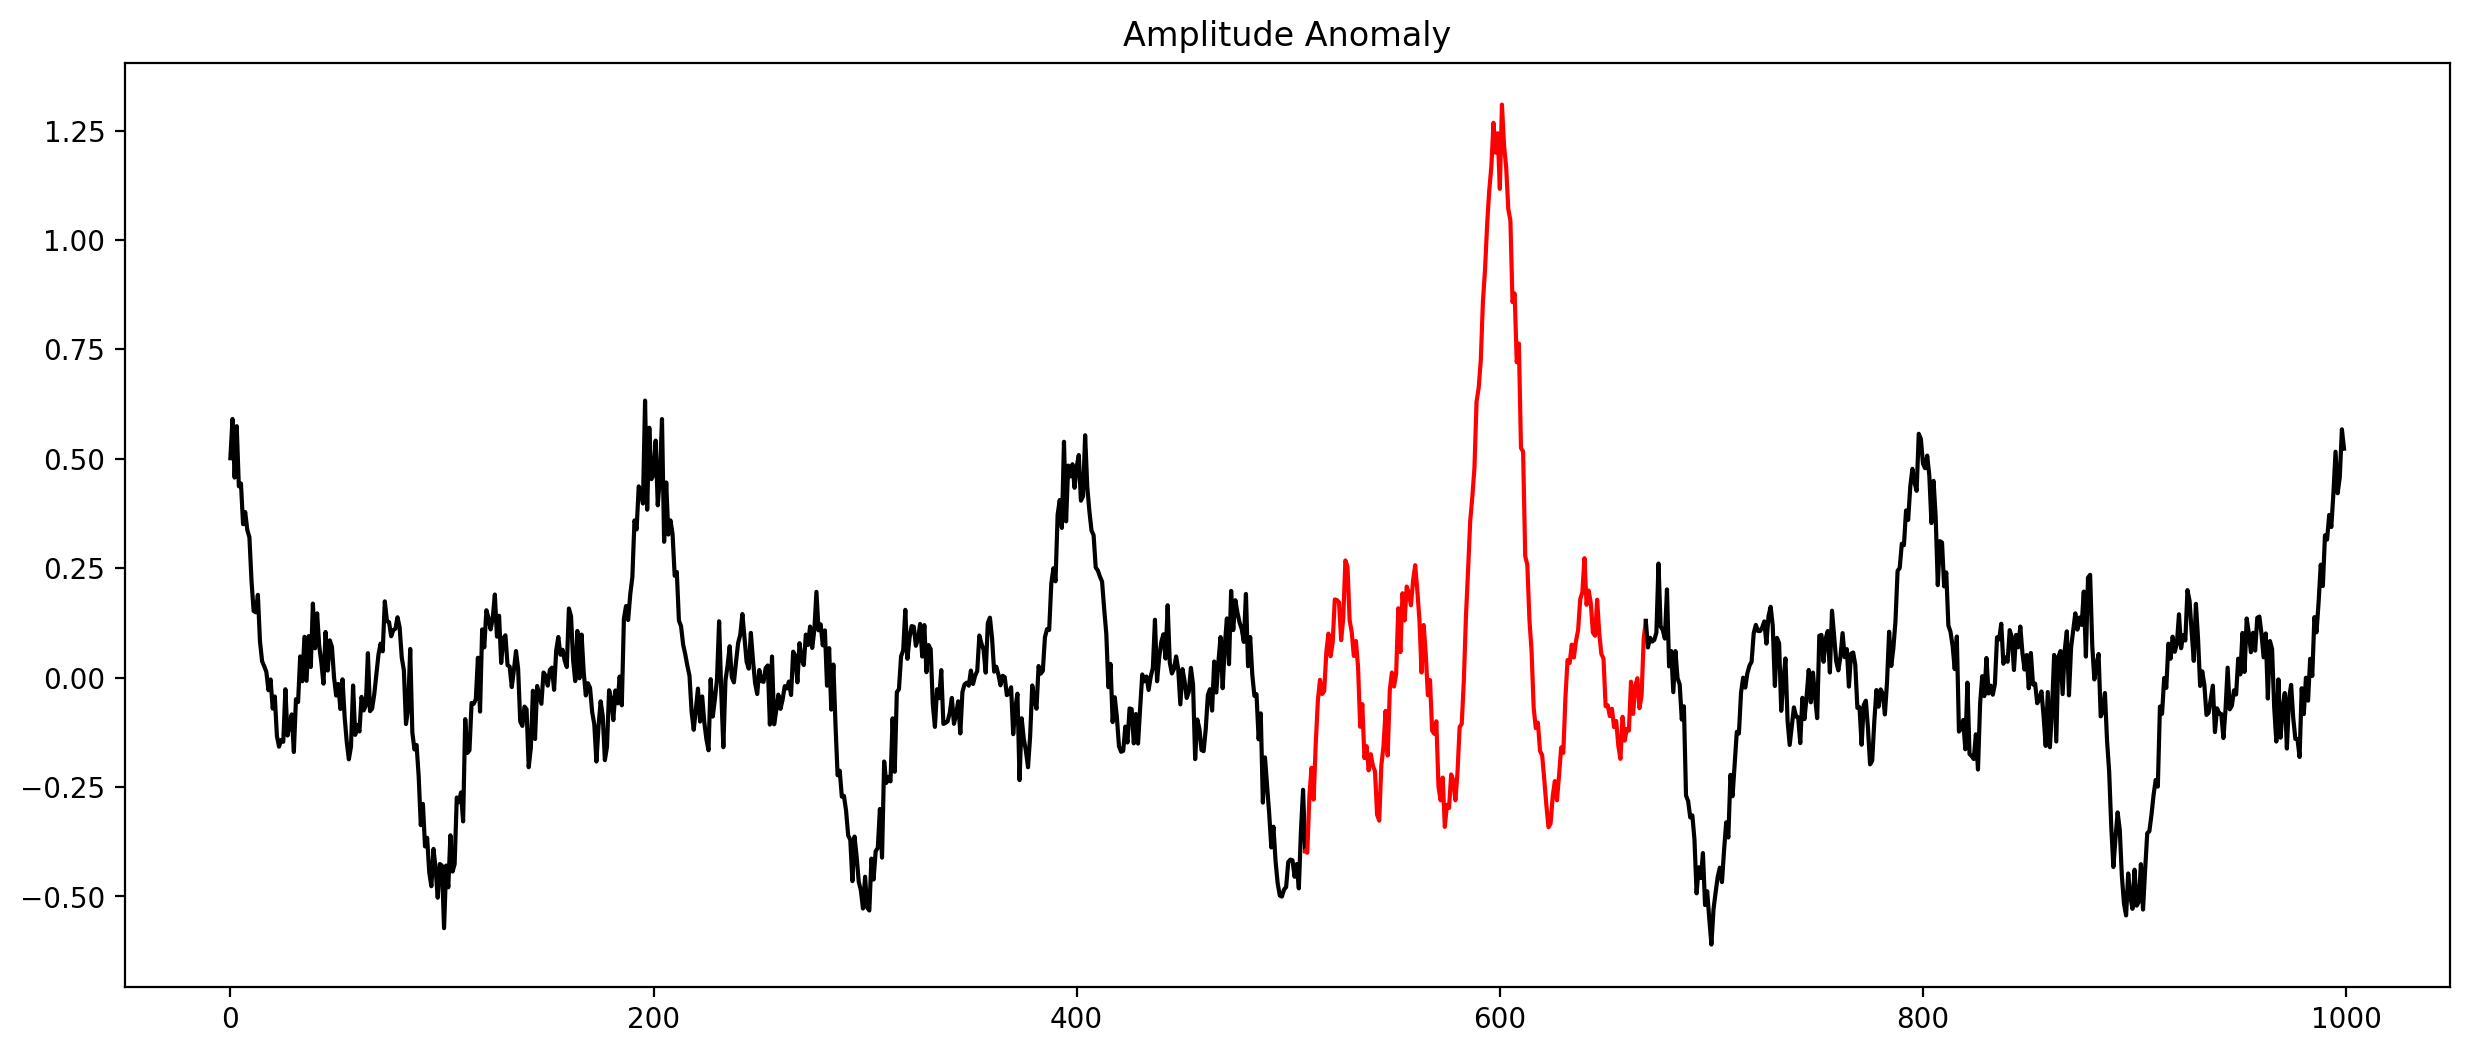
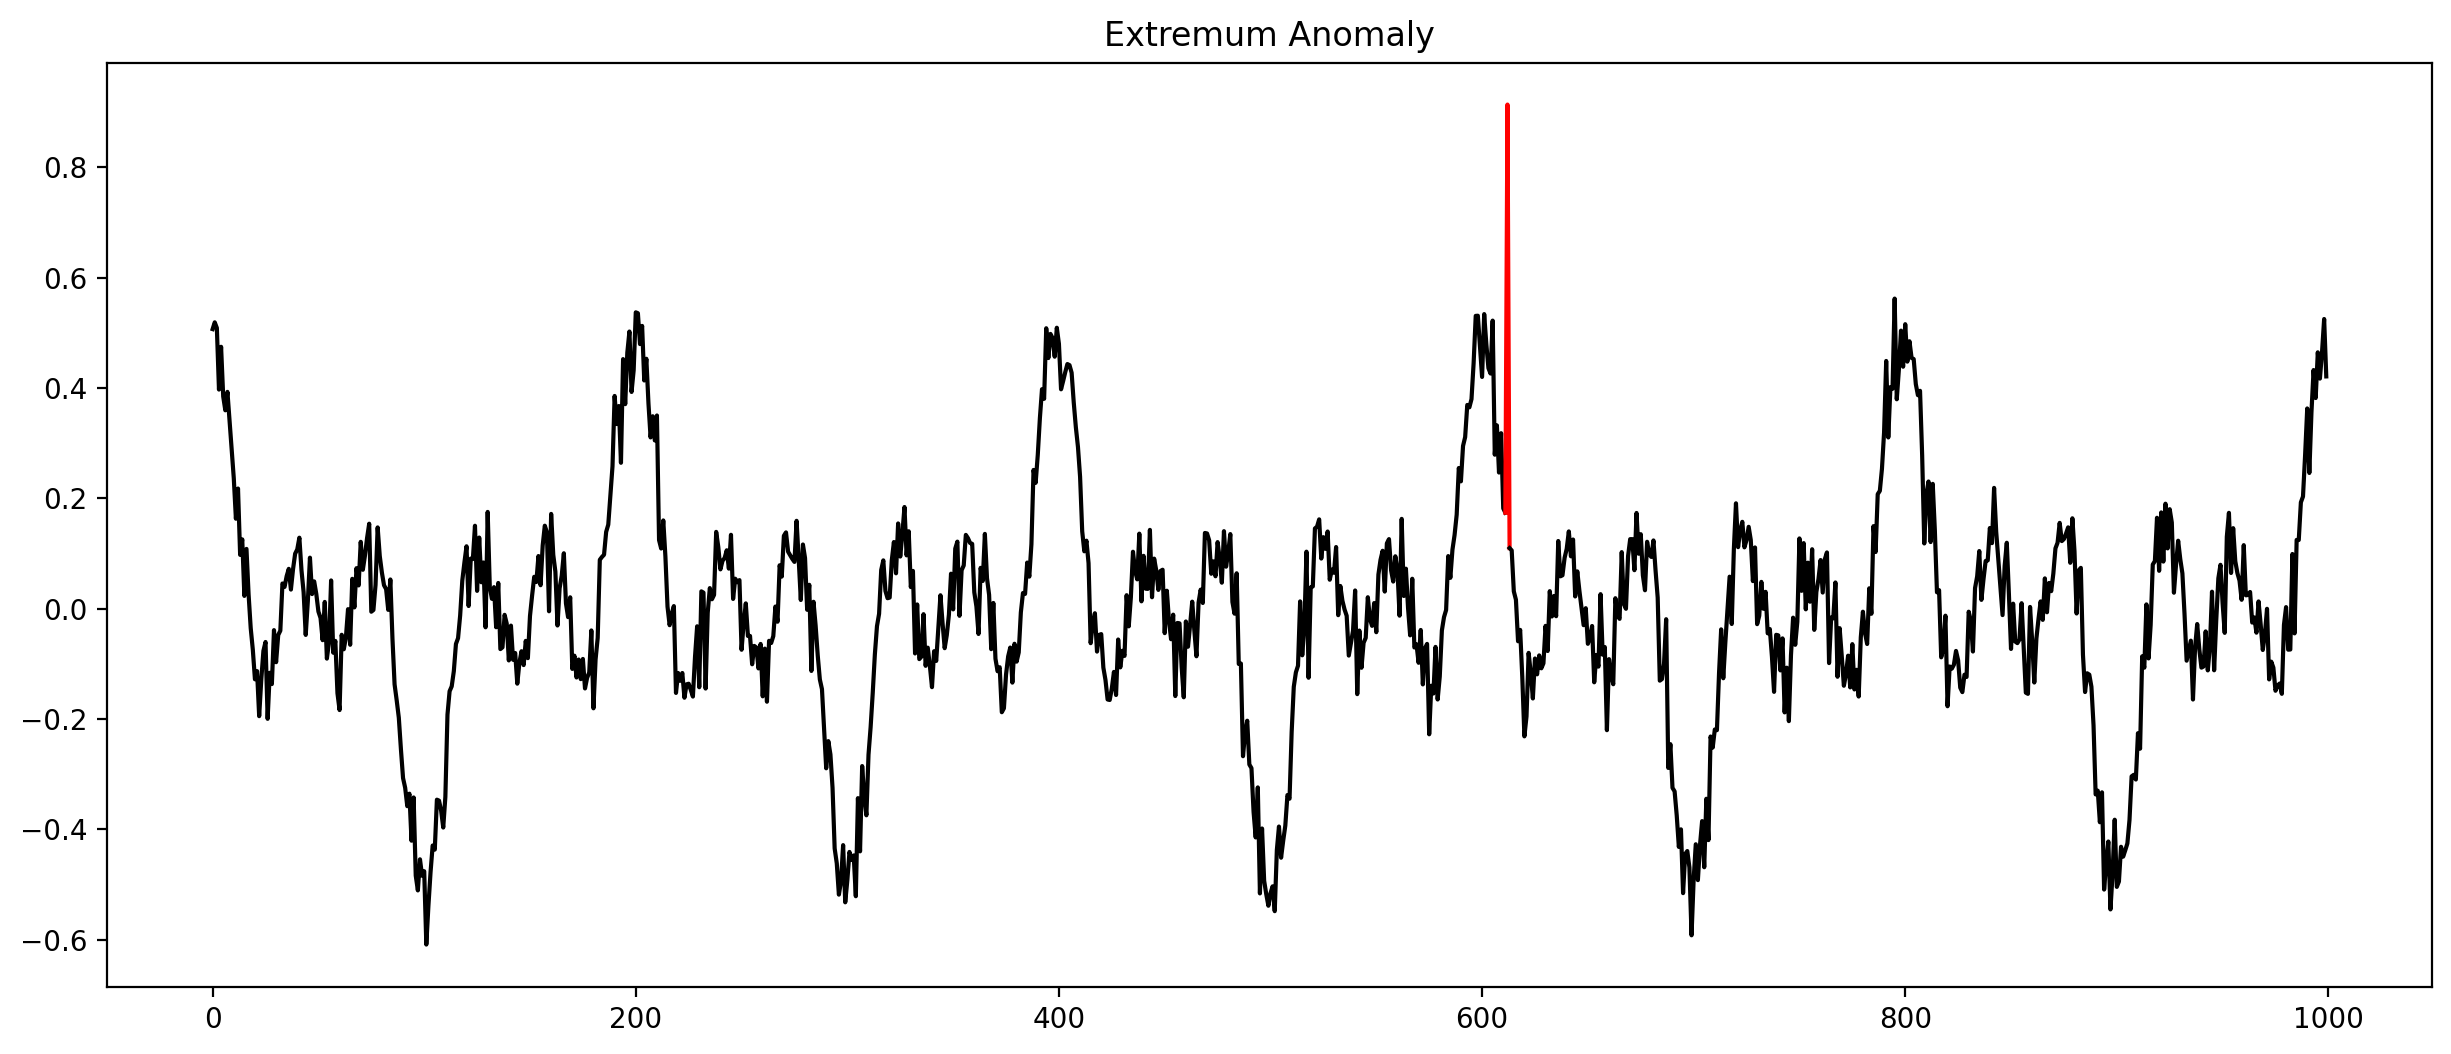
Check every time series by hand?
Let algorithms do the work!
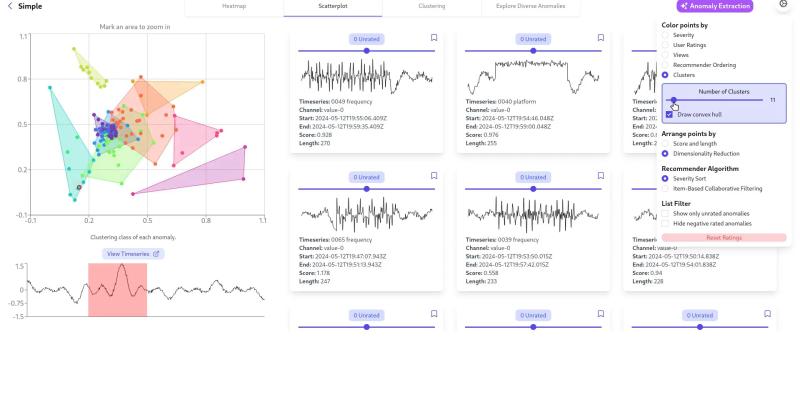
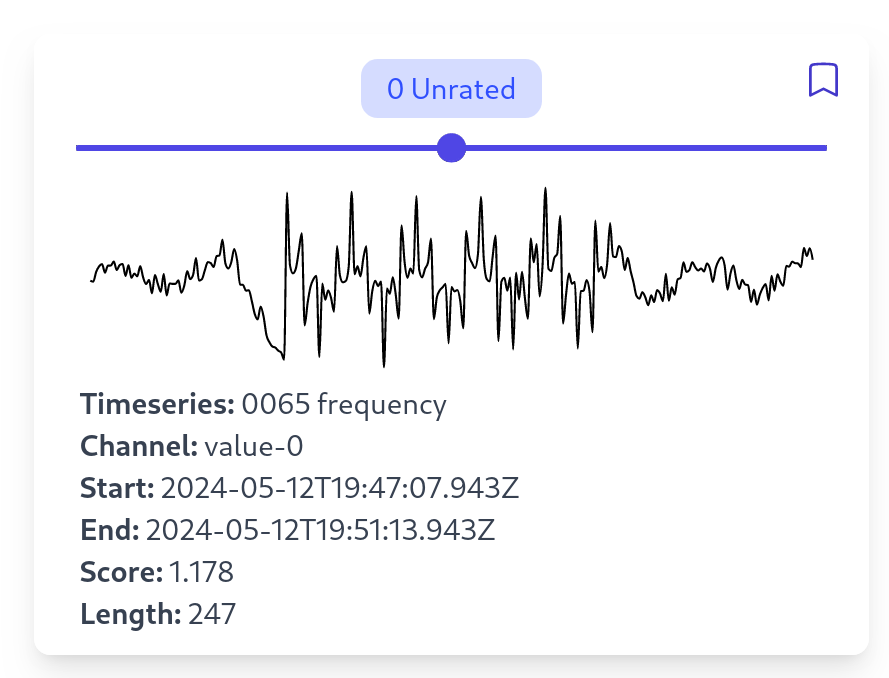
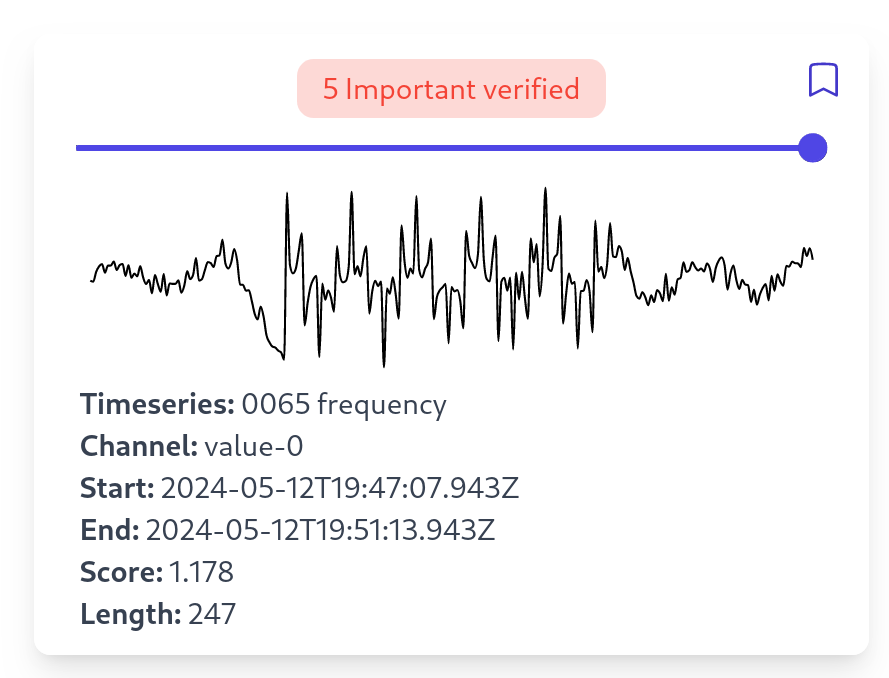
Introducing AnoScout
Anomalies are represented as cards:
Manual Inspection
Exploring Anomalies
How do we gain an overview of all clusters?
Clustering!
Clustering Anomalies
Main features of AnoScout summarized
- Exploration pipeline for anomalies in time-oriented data.
- 7 algorithms for computing anomalies.
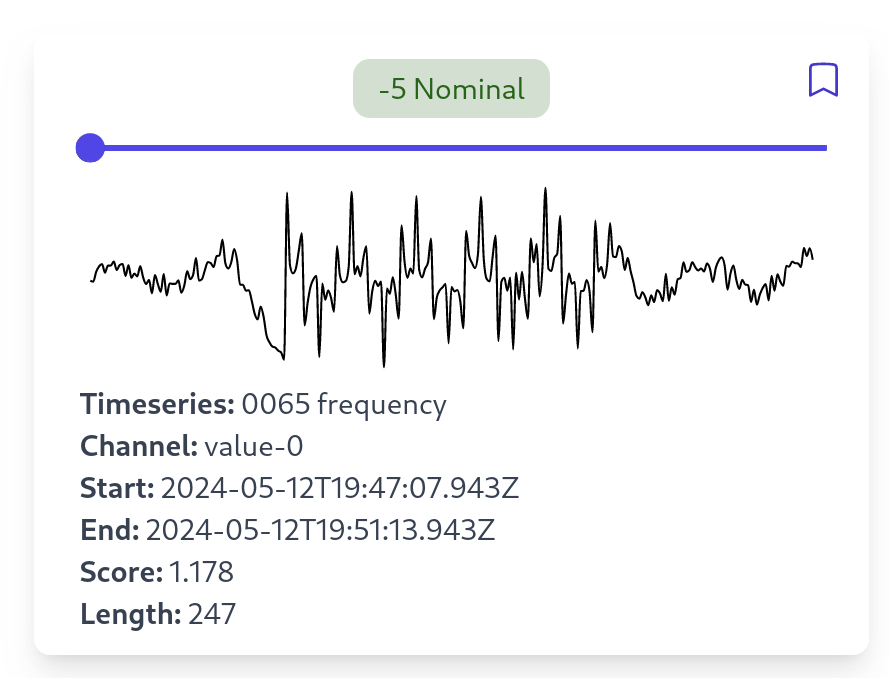
- "Playground" for testing various algorithms.
- Using user labels to fine-tune the system.
Towards XAI
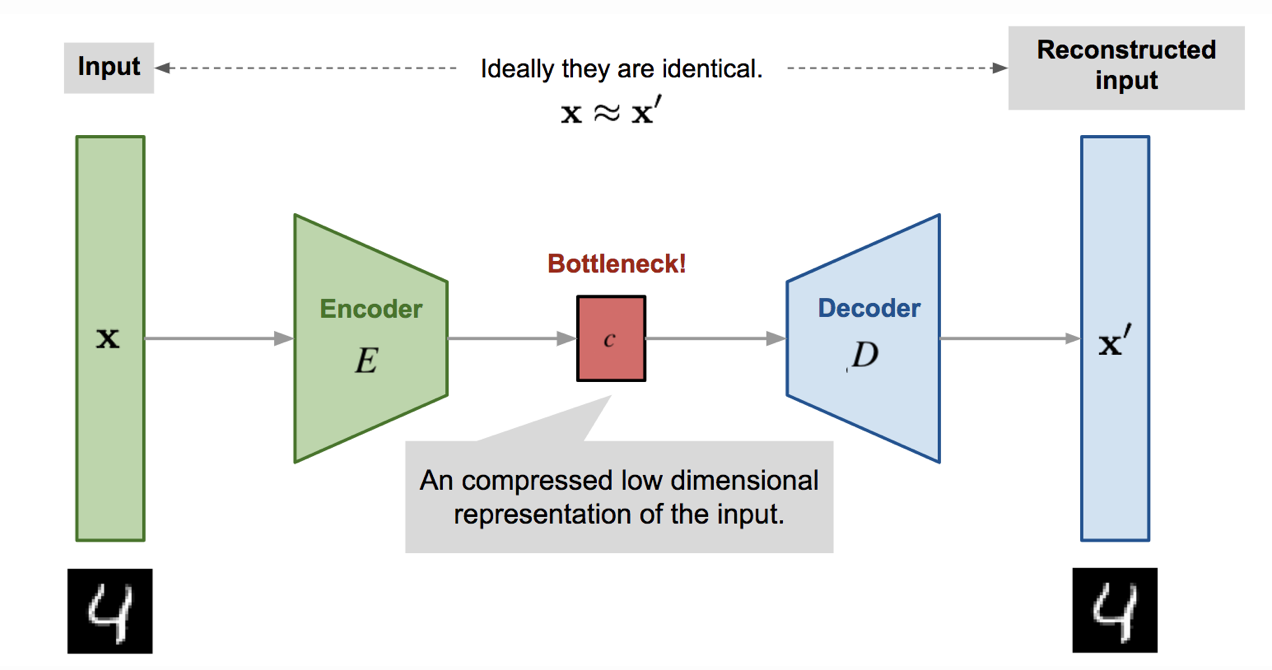
AutoEncoders learn normal patterns.
Show which normal labels are the most important ones.
Application Scenario
- A company wants to install a new machine.
- The machine conducts an etching process (semiconductor manufacturing).
- Each etching process is recorded through a sensor (e.g. pressure, temperature, and gas)
- We want to use AnoScout to:
- Find possible anomaly patterns.
- Check which algorithms work well.
Forecasting
How can we build a "sandbox" to explore forecasting models?
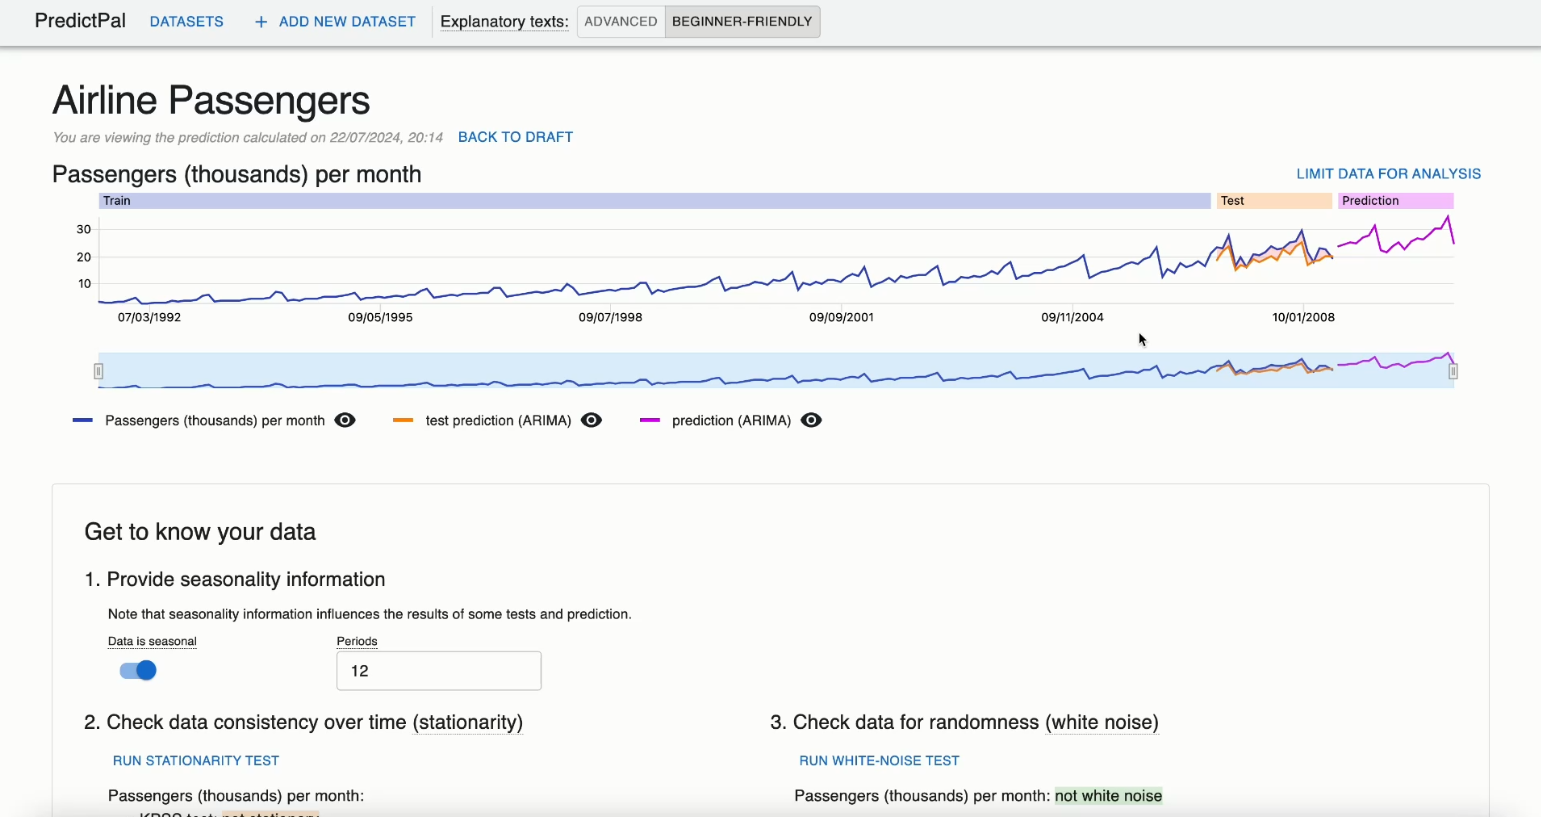
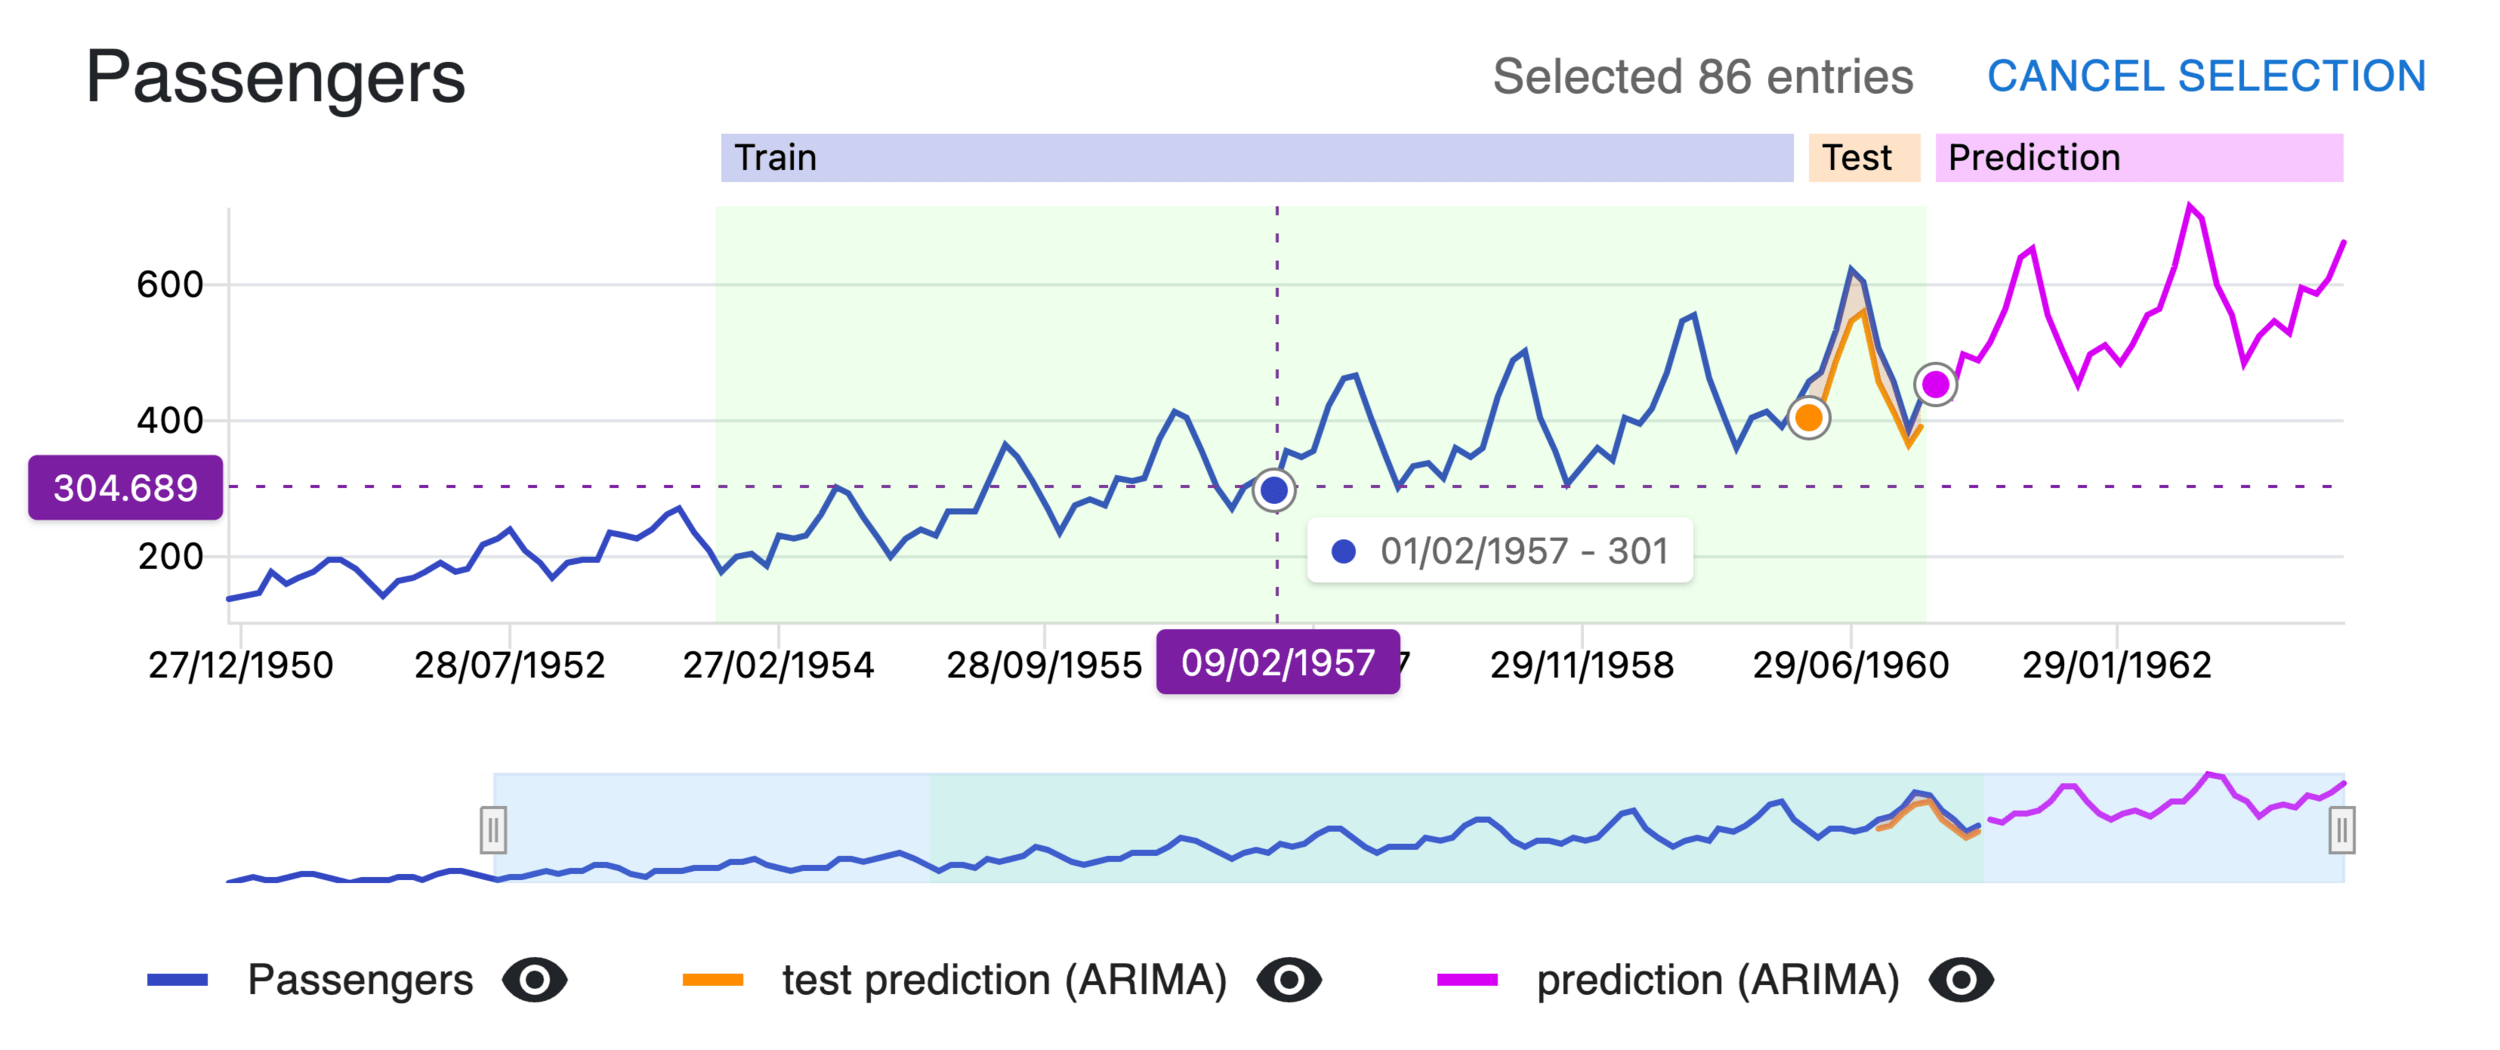
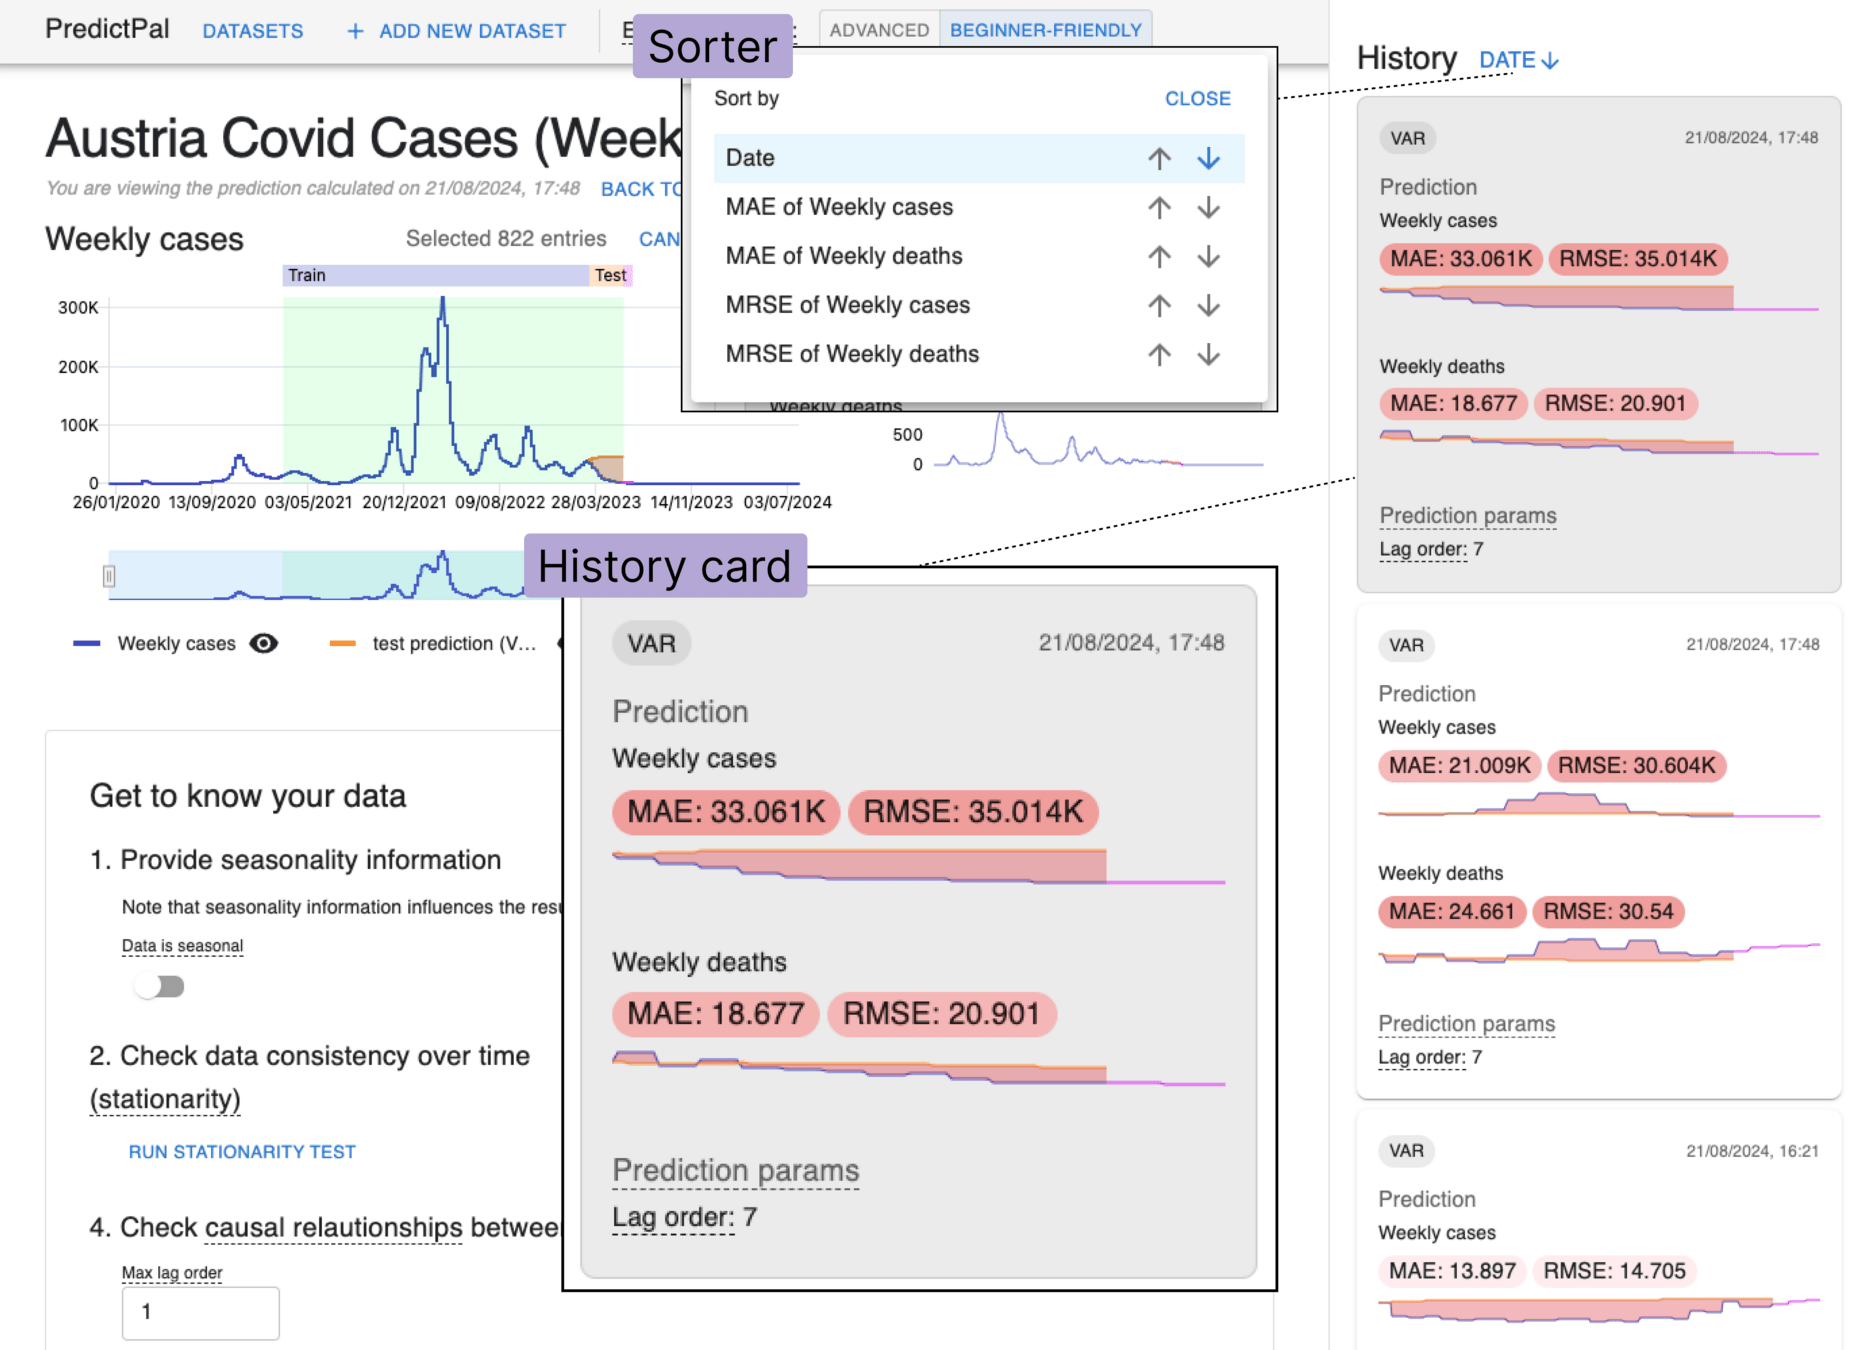
Introducing PredictPal
Prediction Models
ARIMA
AutoRegressive Integrated Moving Average
VAR
Vector Autoregression
Analysis View
History of Models
A municipal office worker John Doe needs to predict the traffic load at Intersection X
Possible Use Case: Solgenium
Caution: This is a different prototype for a forecasting visualization!
- Solgenium Prototype = Specific Use Case
- PredictPal = Generic
Therefore: Merge Predictpal and Solgenium
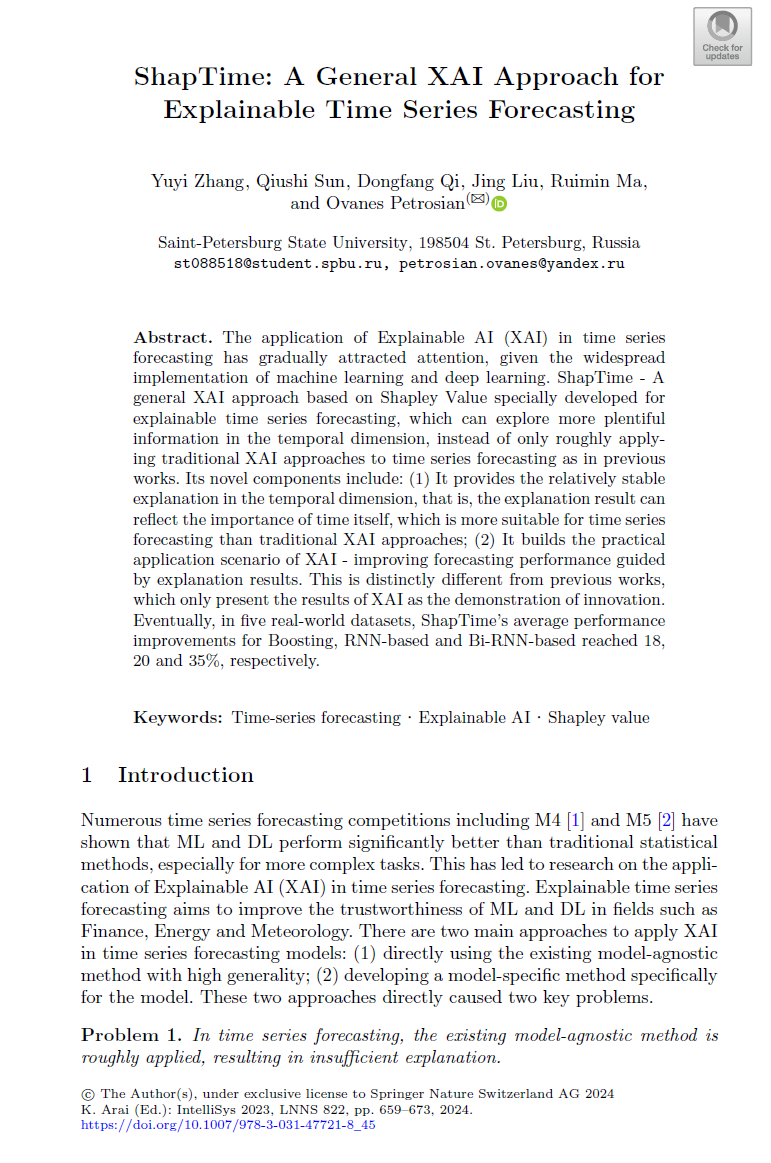
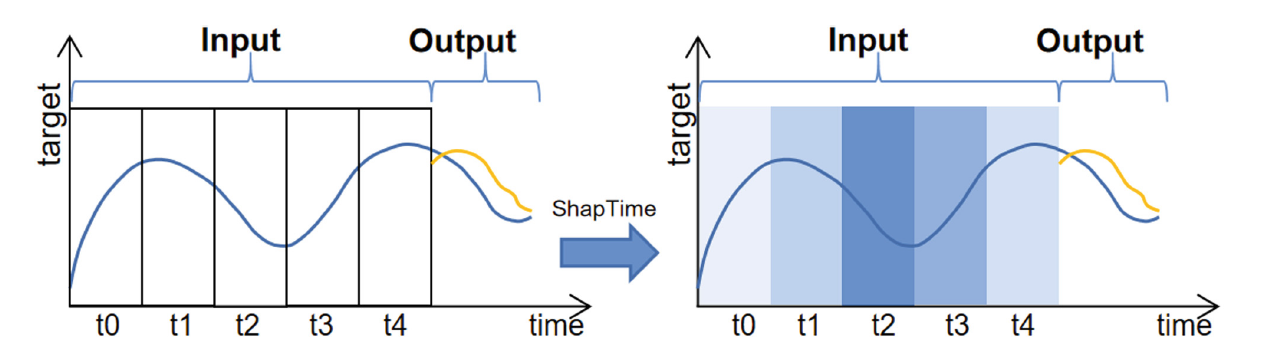
Towards XAI: ShapTime
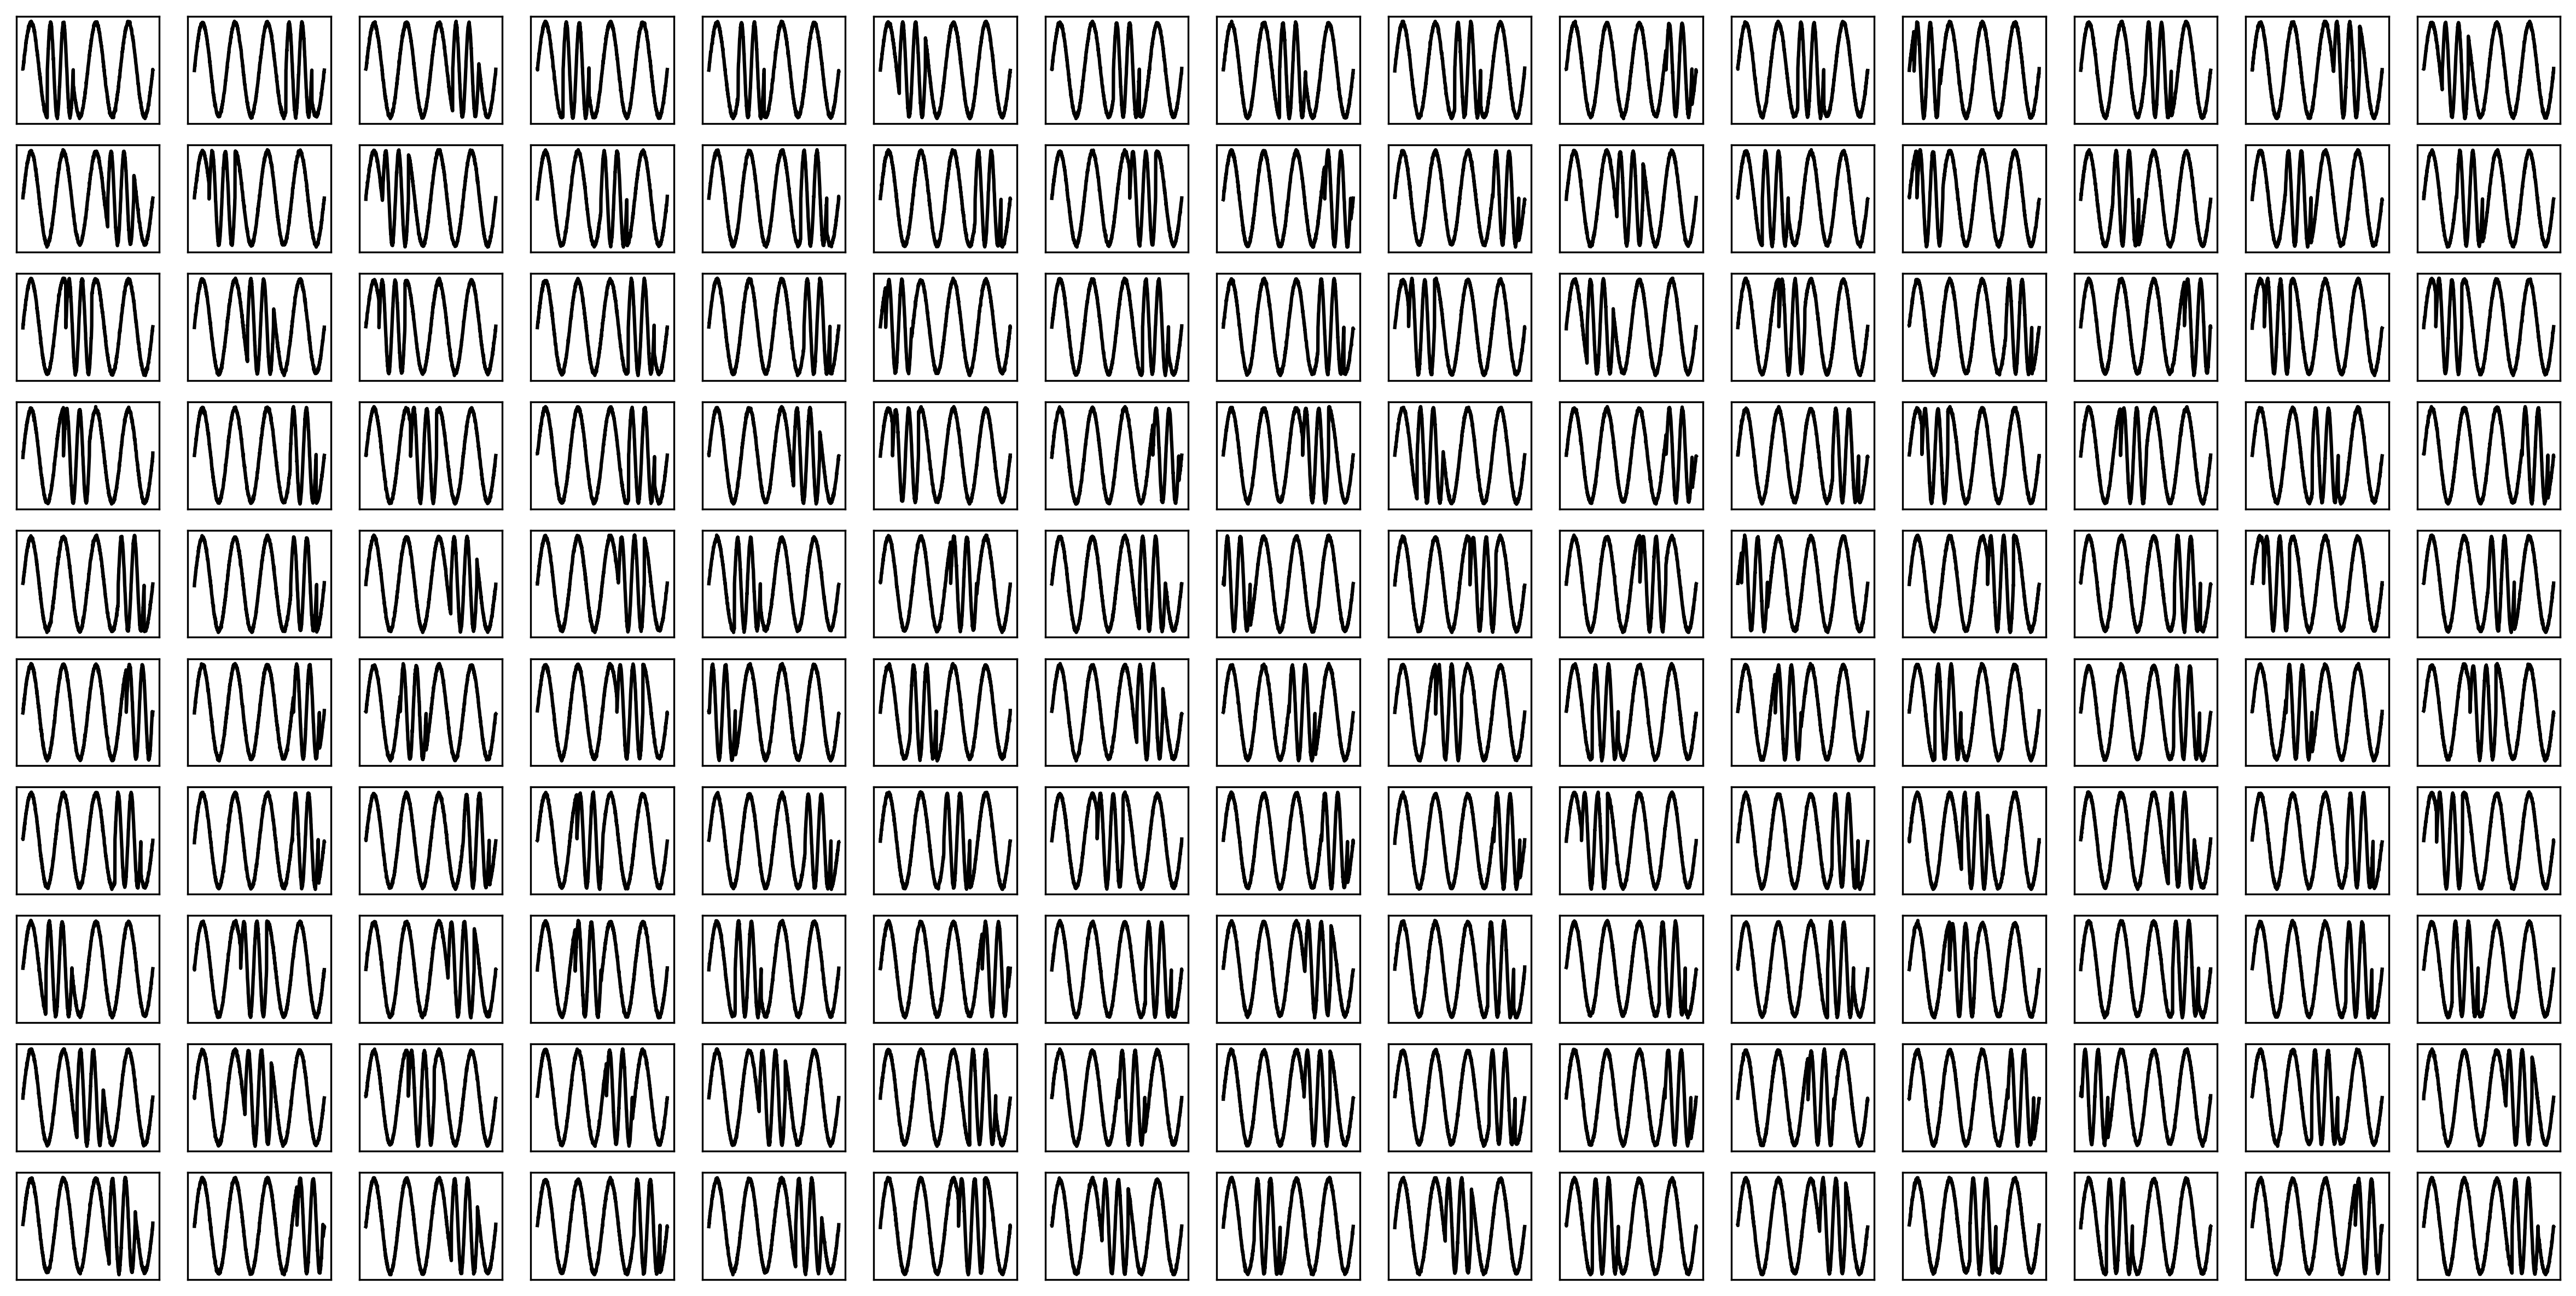
Vibrations
The Problem with Vibrations
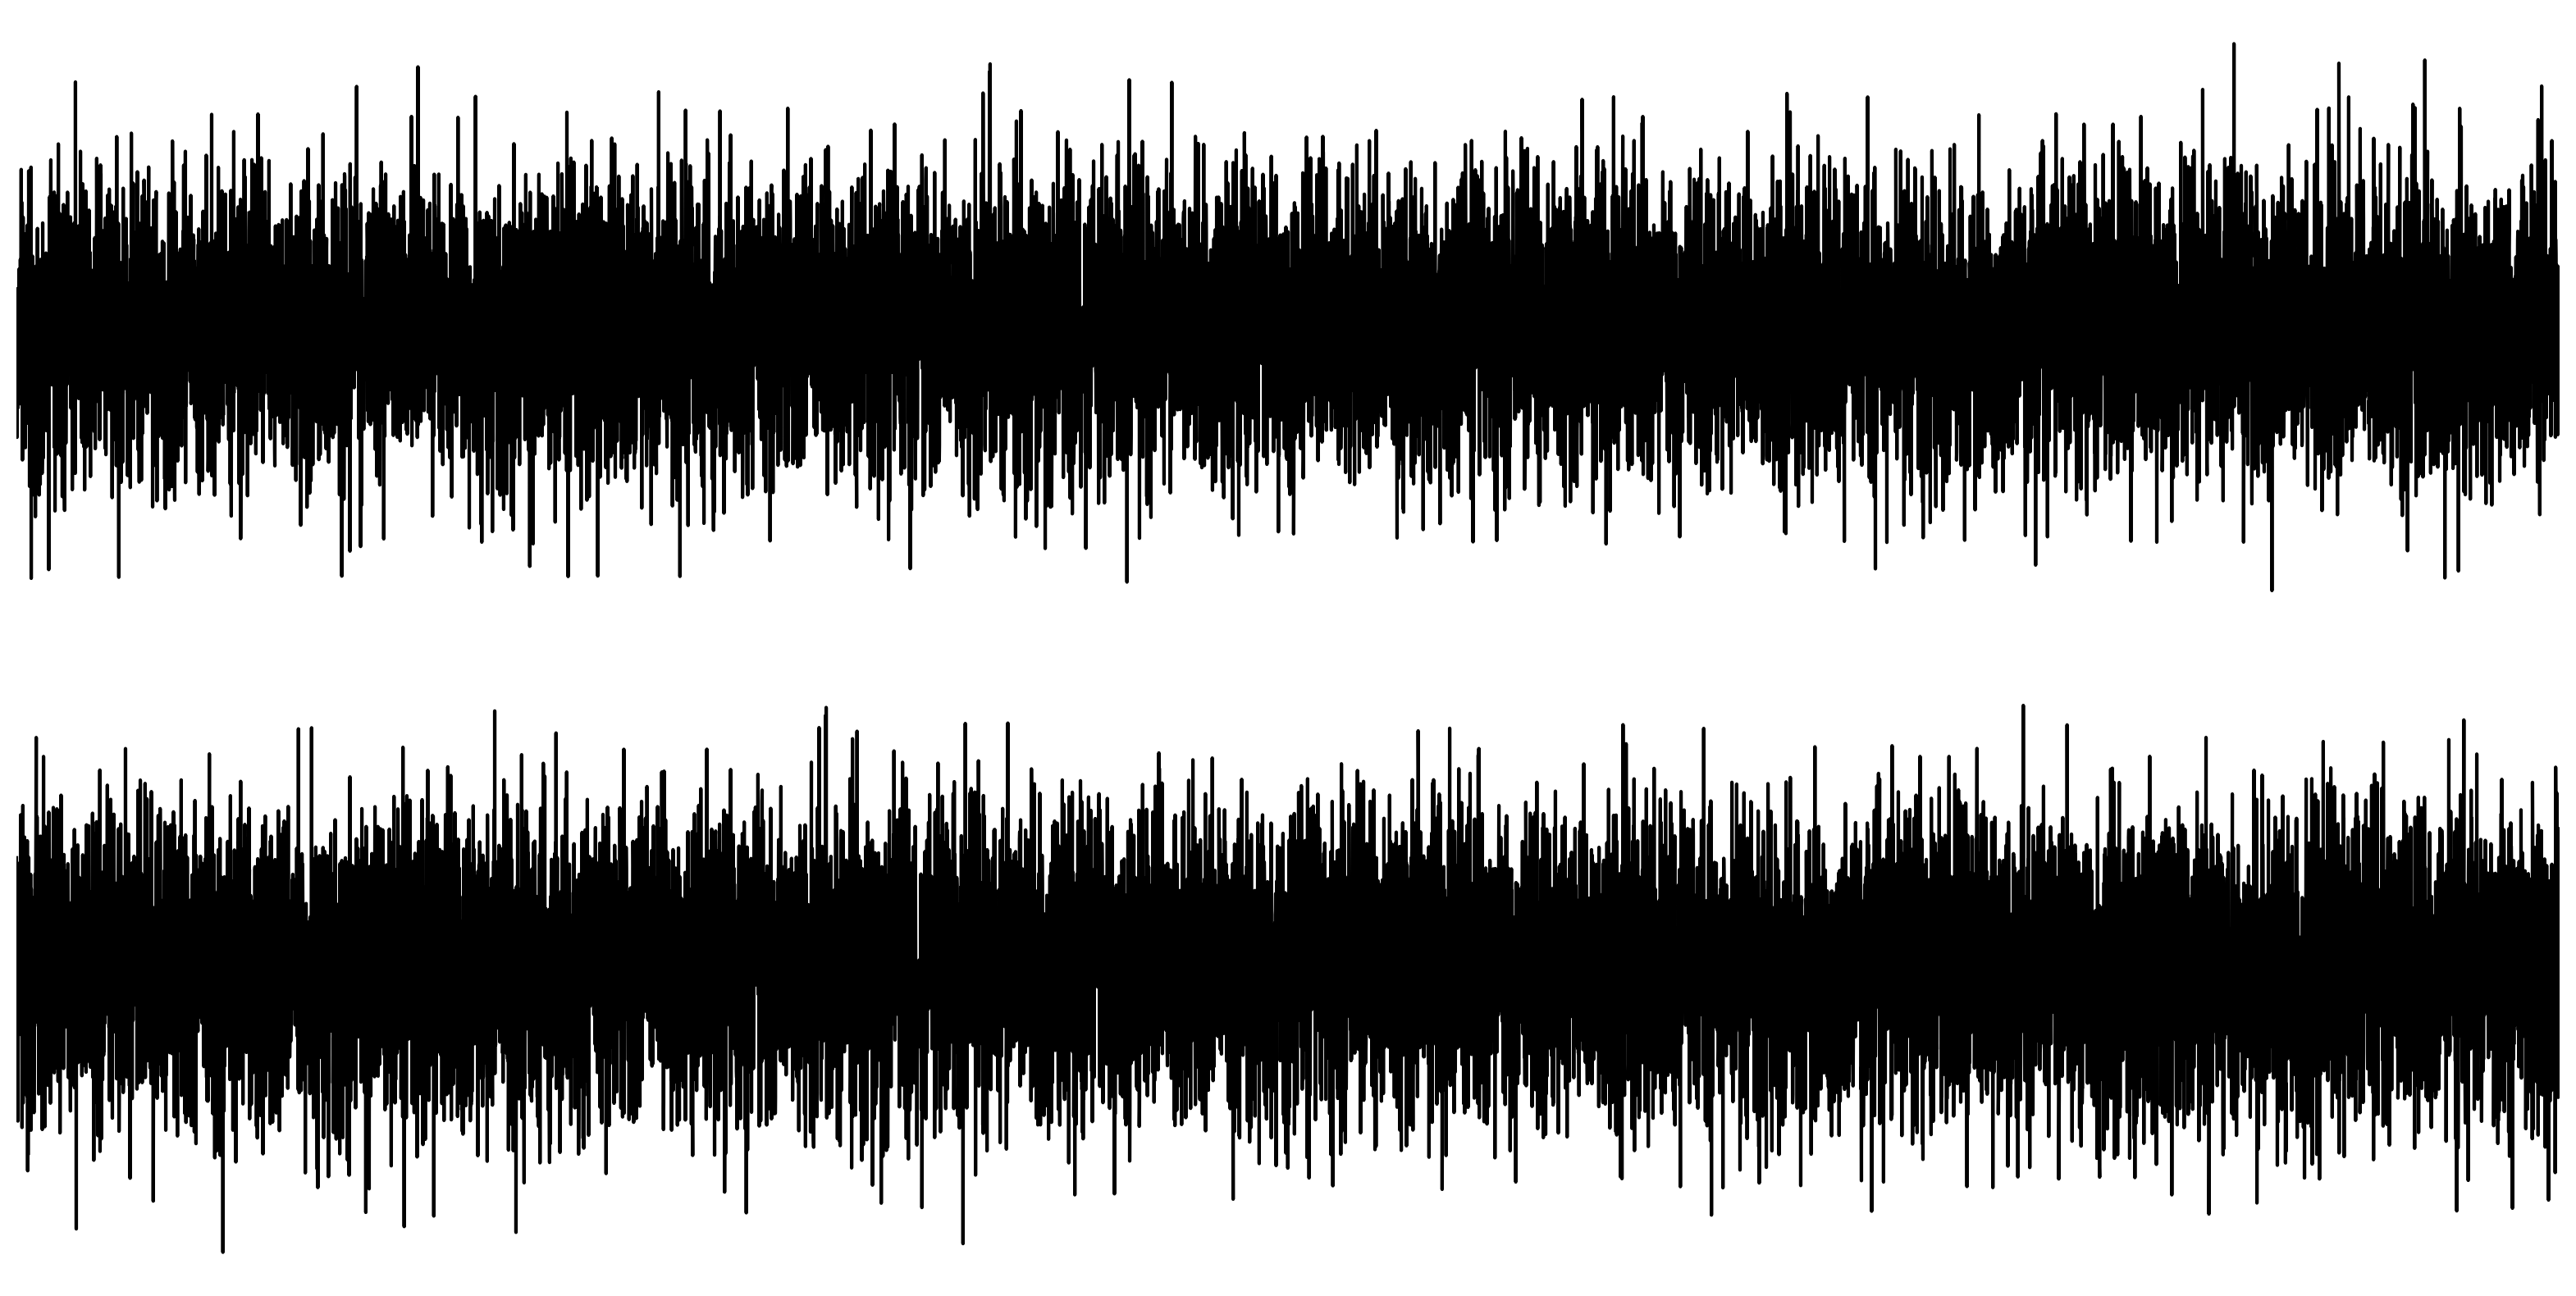
Can you tell the difference?
A hidden signal
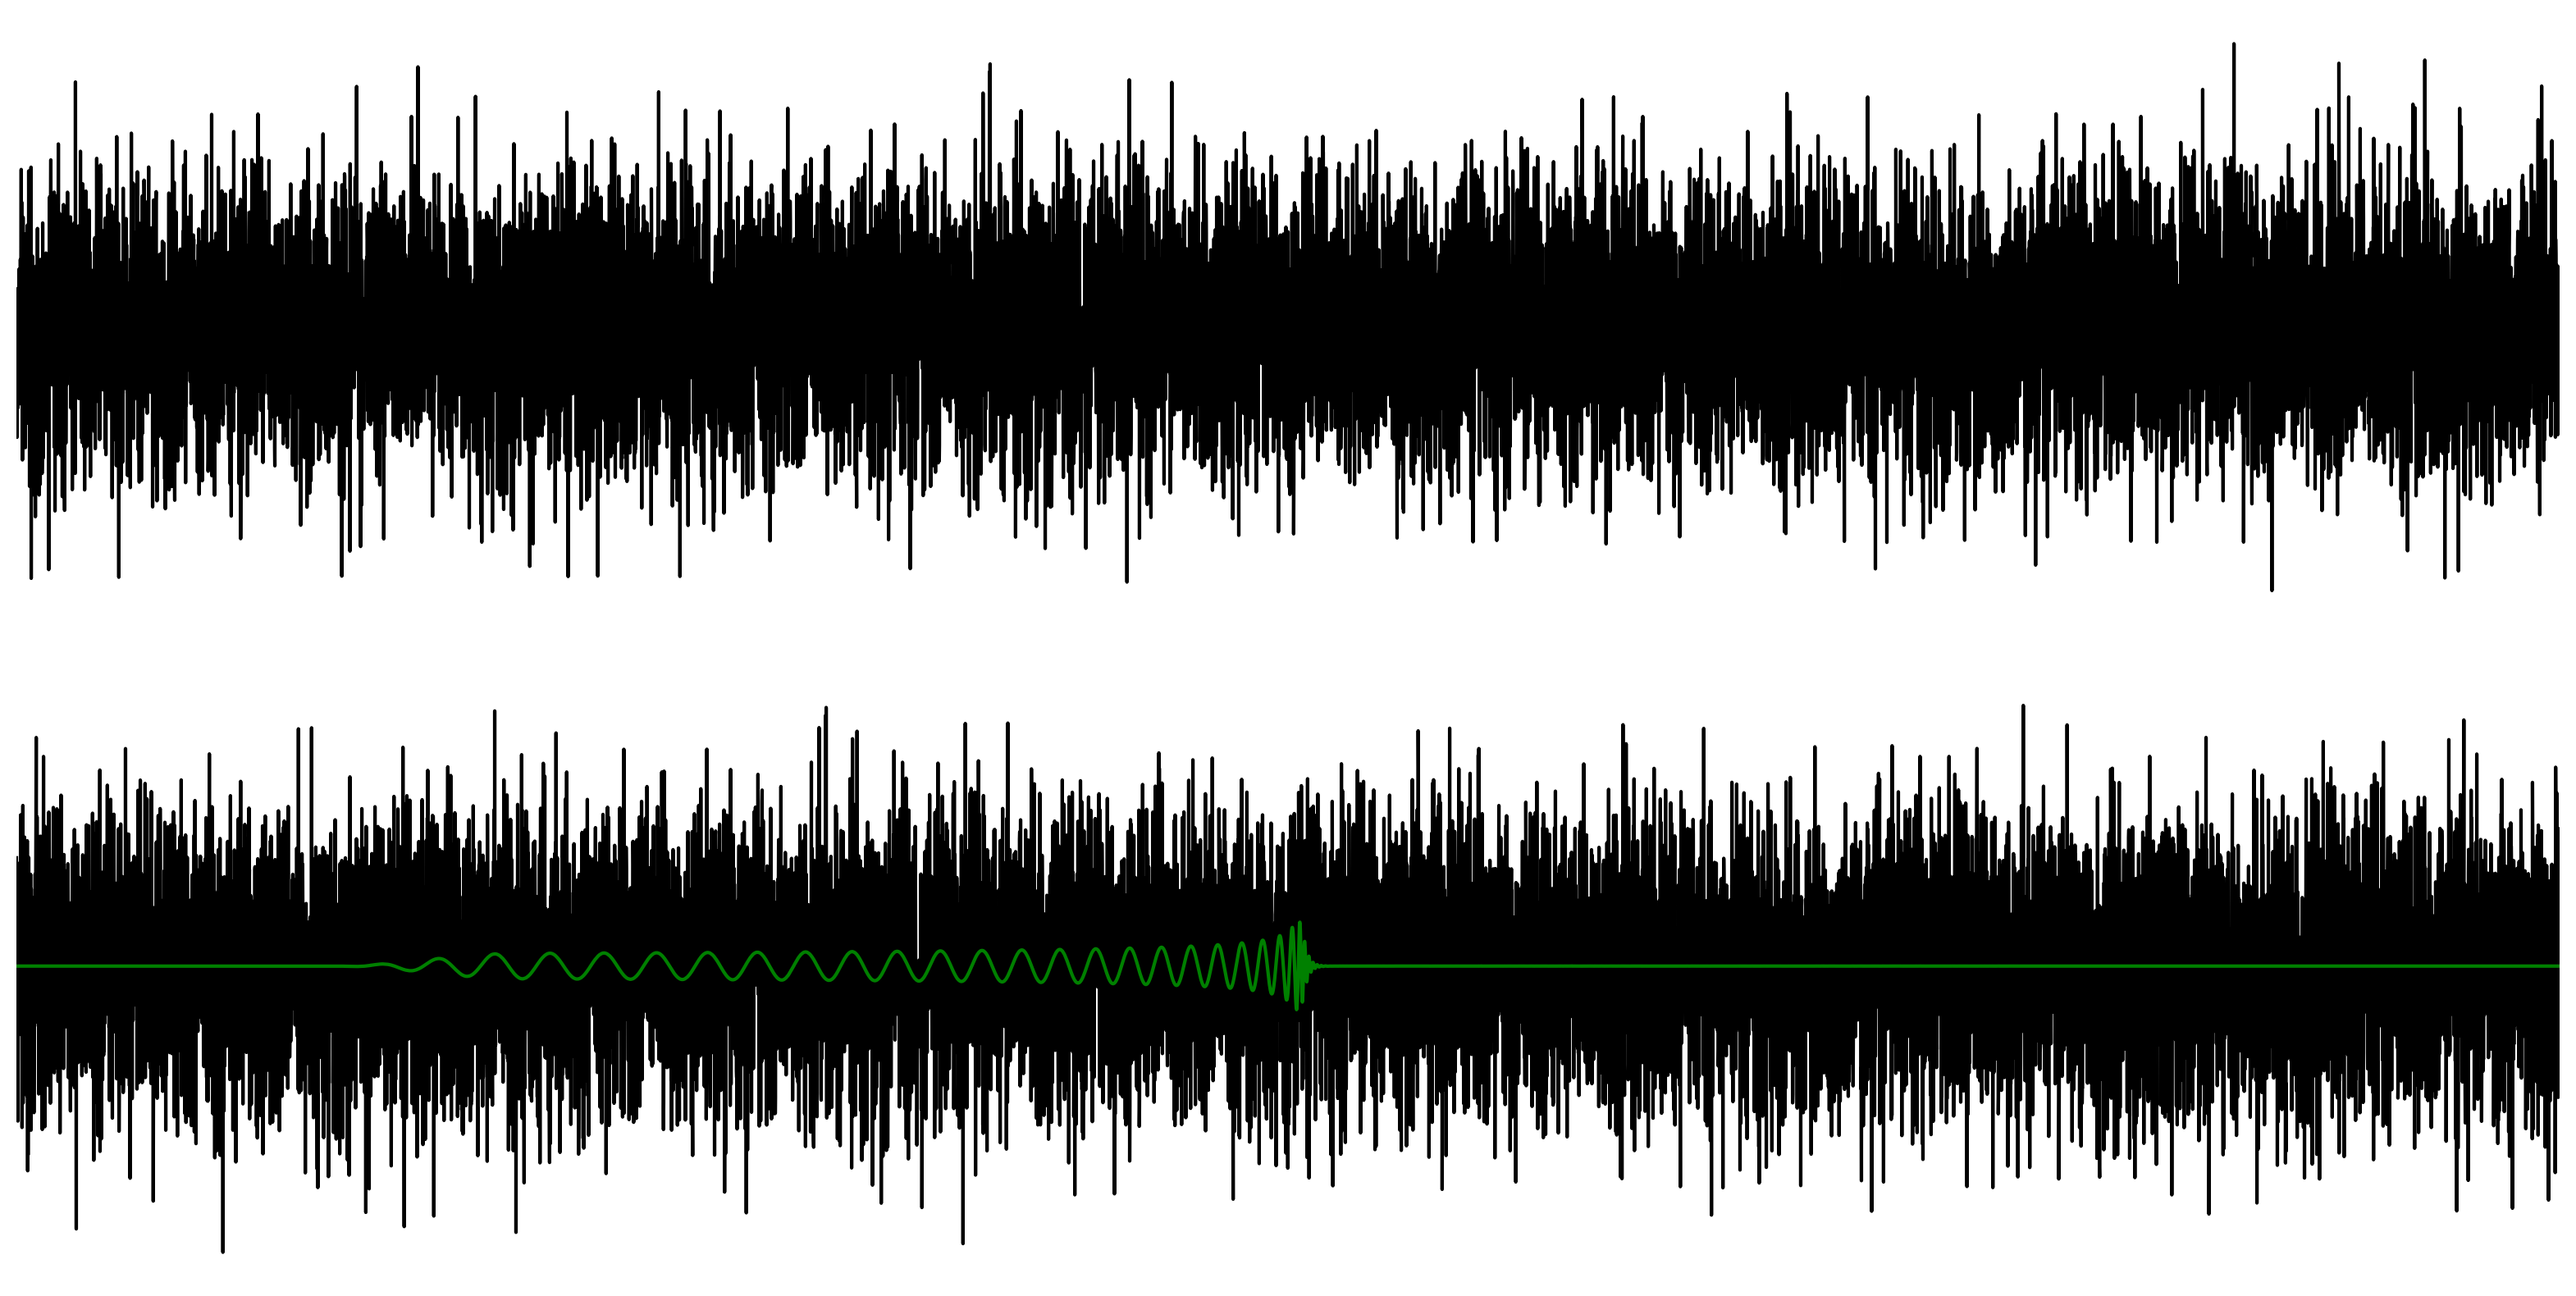
Linecharts are useless!
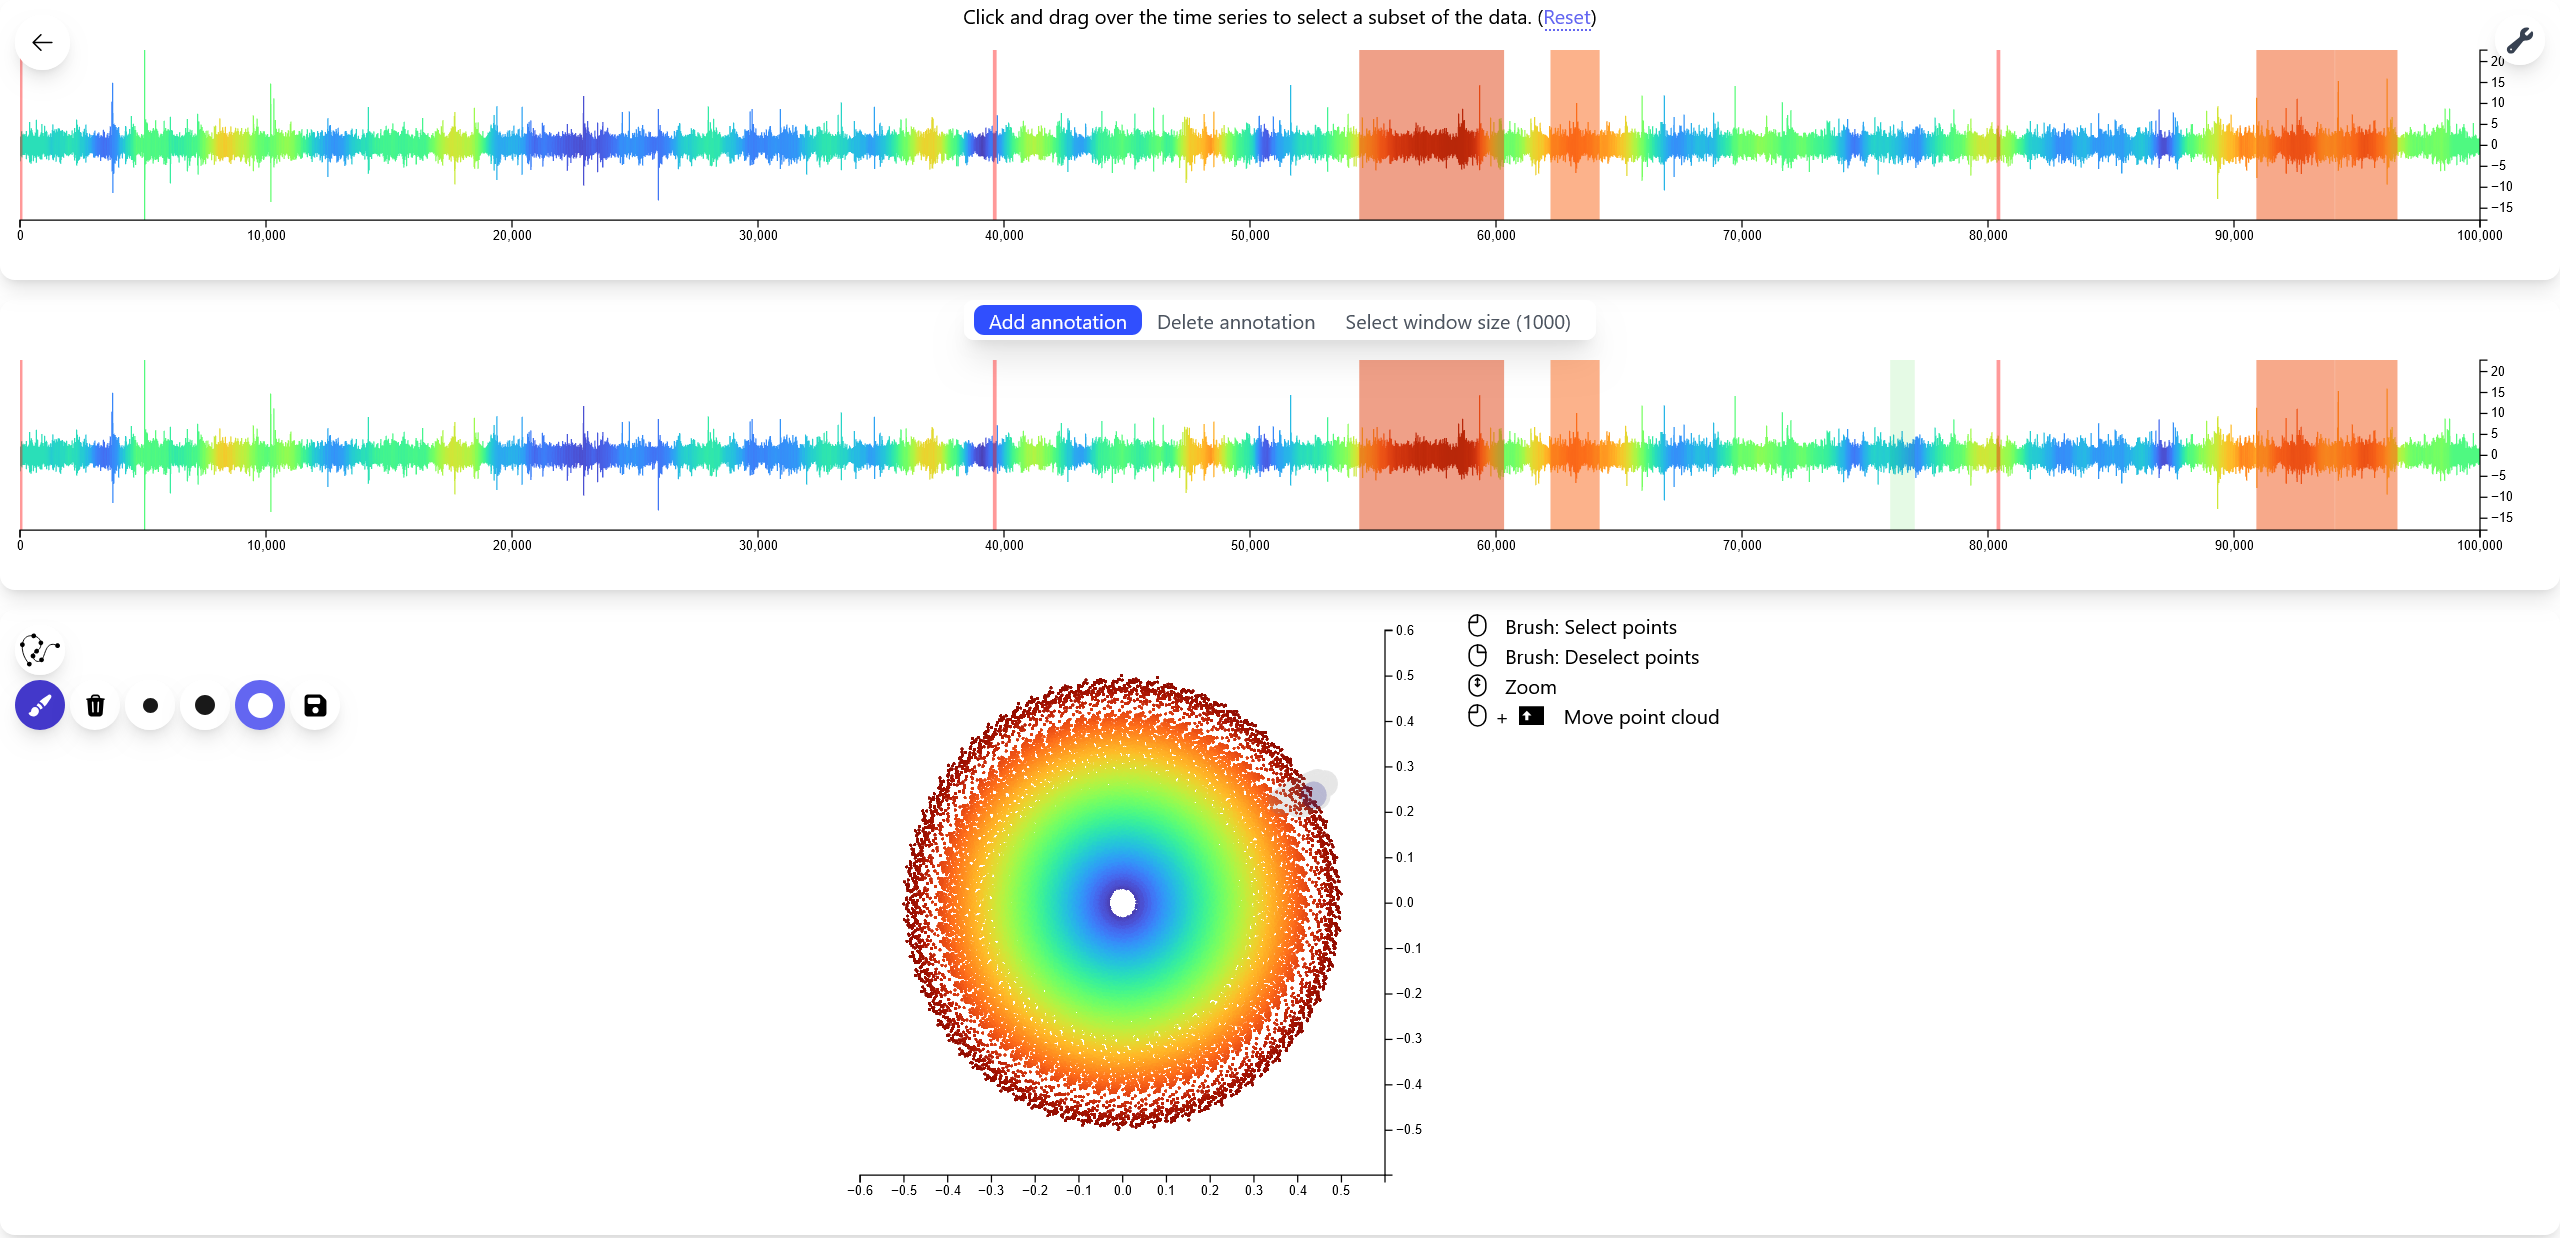
The Time Delay Embedding (TDE)
Noise is not exciting ...
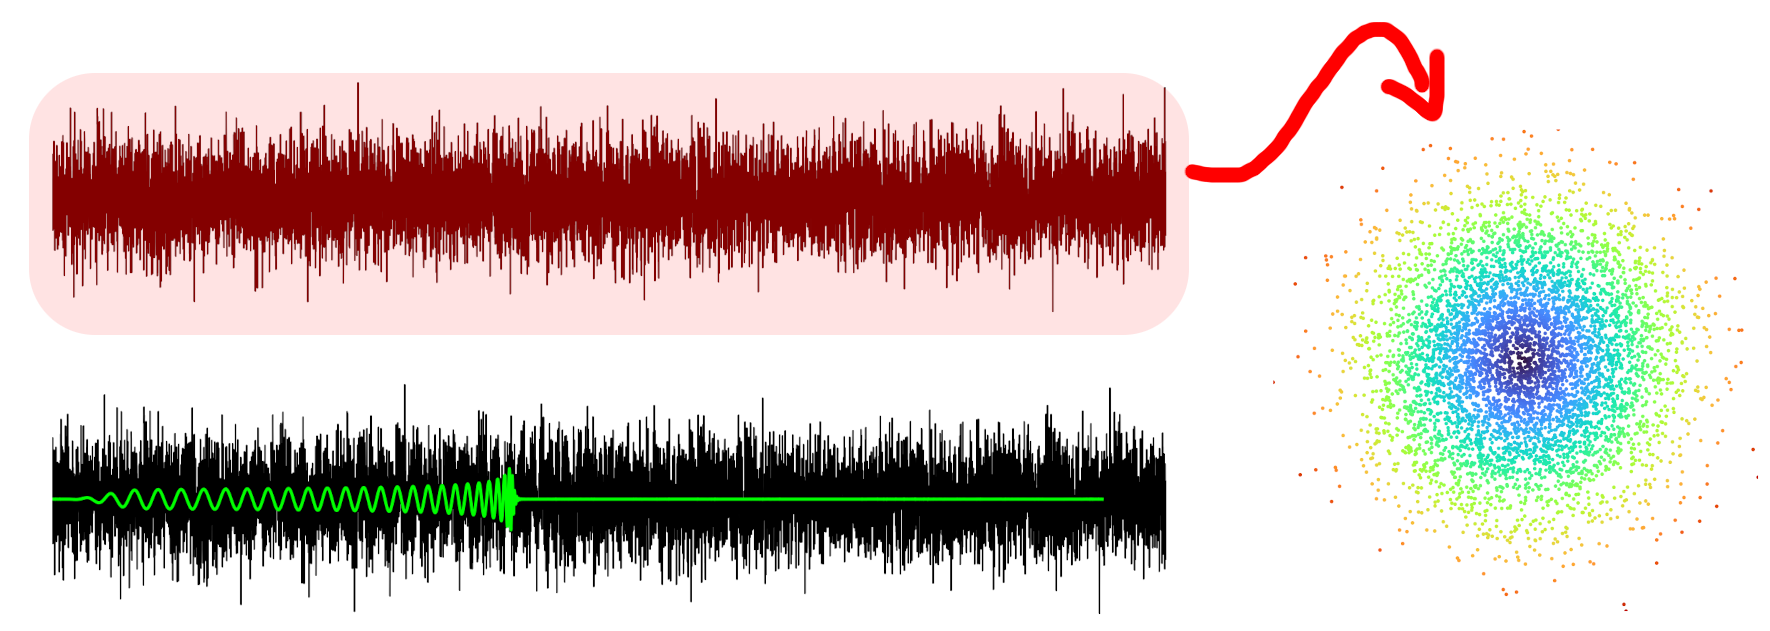
... but oscillations result in circles!
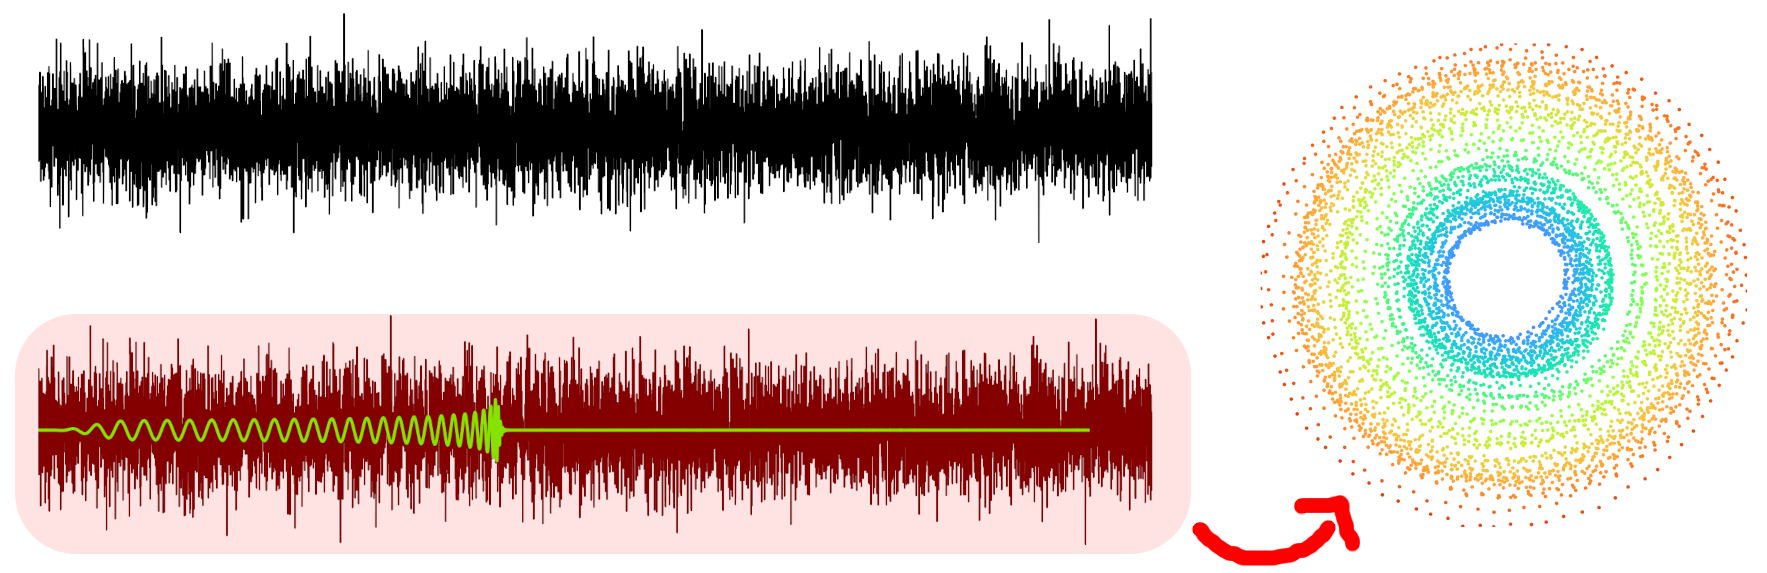
What can we do with this?
- Visualise change points
- Cluster signals
- Find labels
Our Prototype
Vibrana

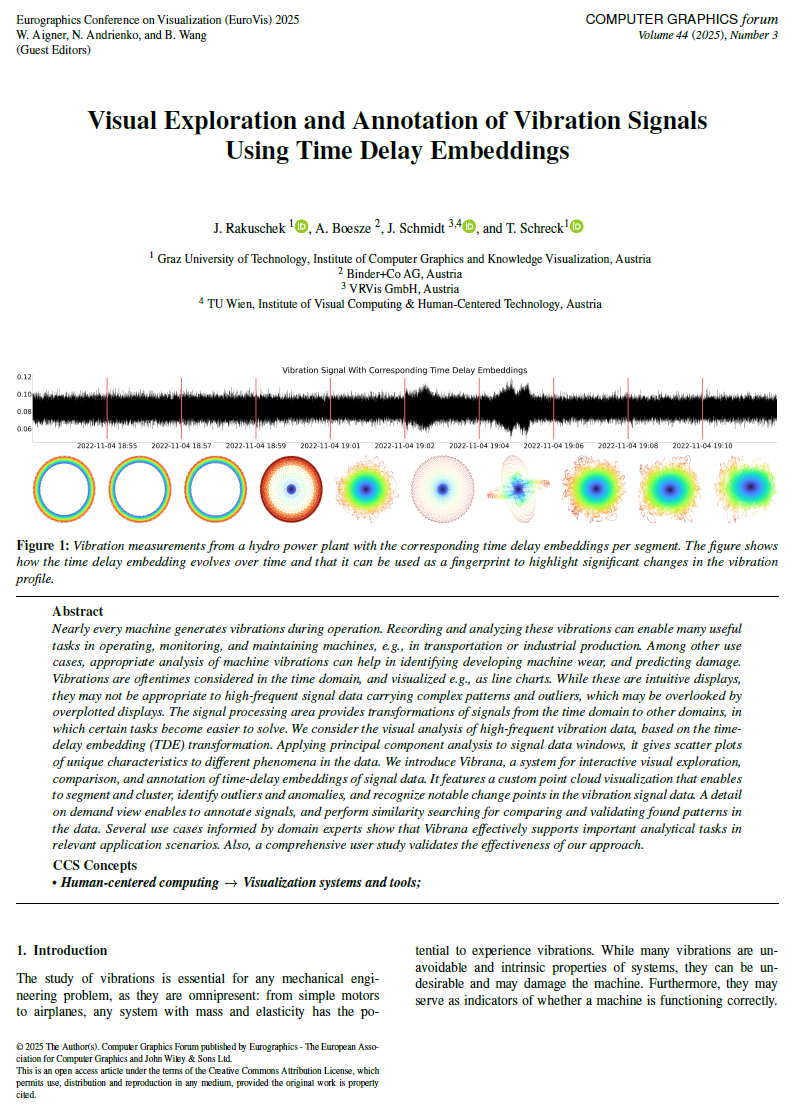
EuroVis 2025 Submission
In Review 🤞Can we find a change point in the signal?
Vibrationens of a hydropower plant:
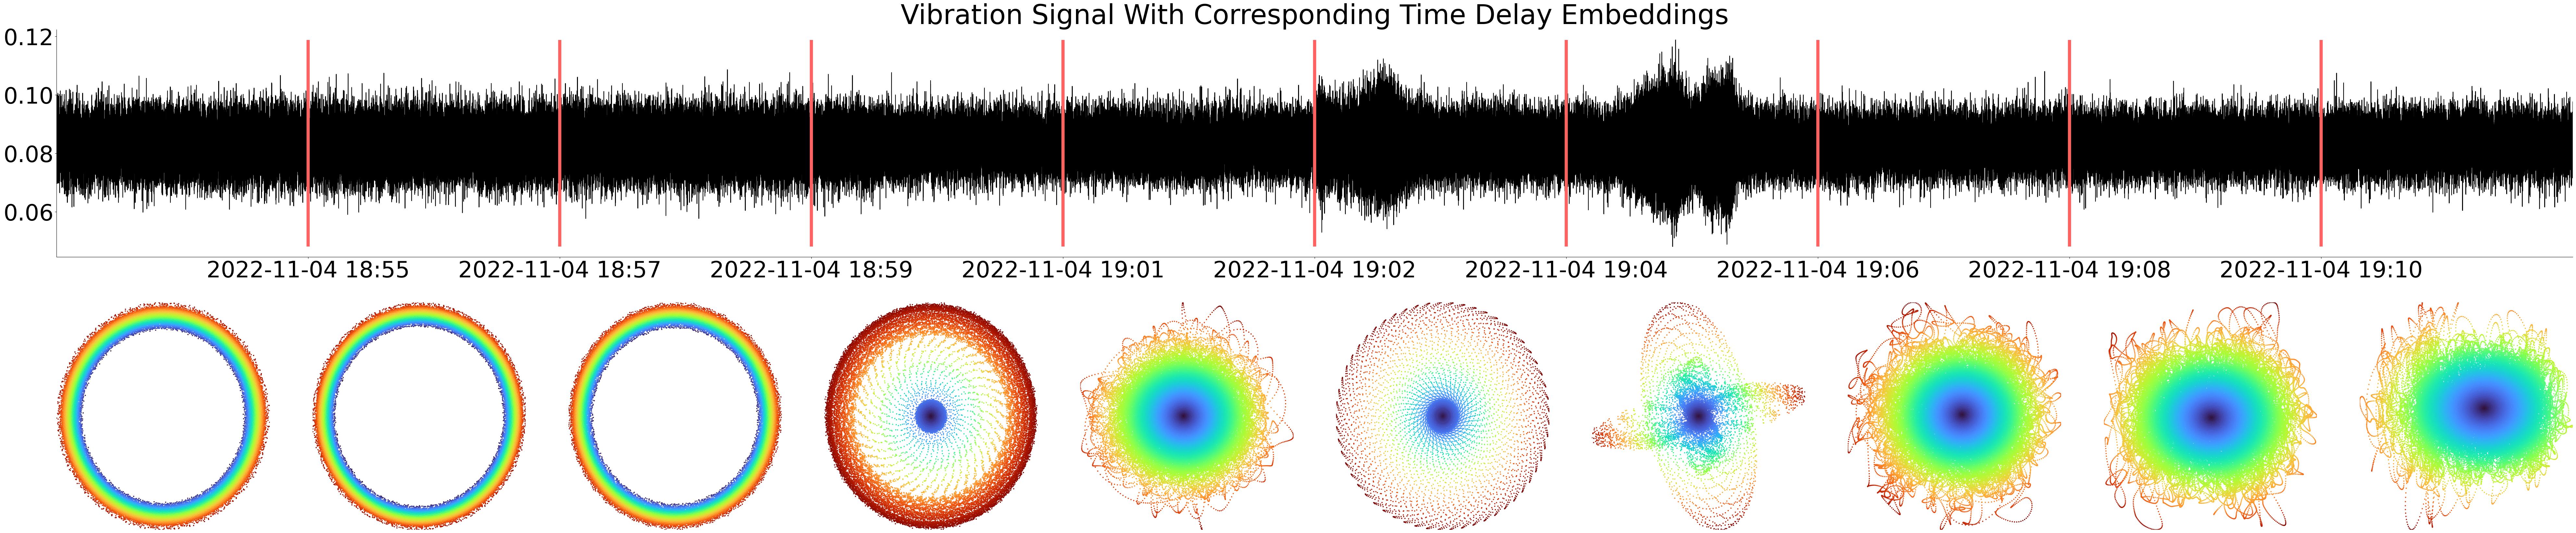
The TDE is a fingerprint evolving over time!
Applications
Engines
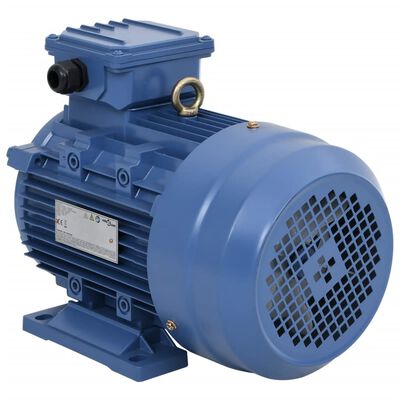
When can we detect wear?
Bearings
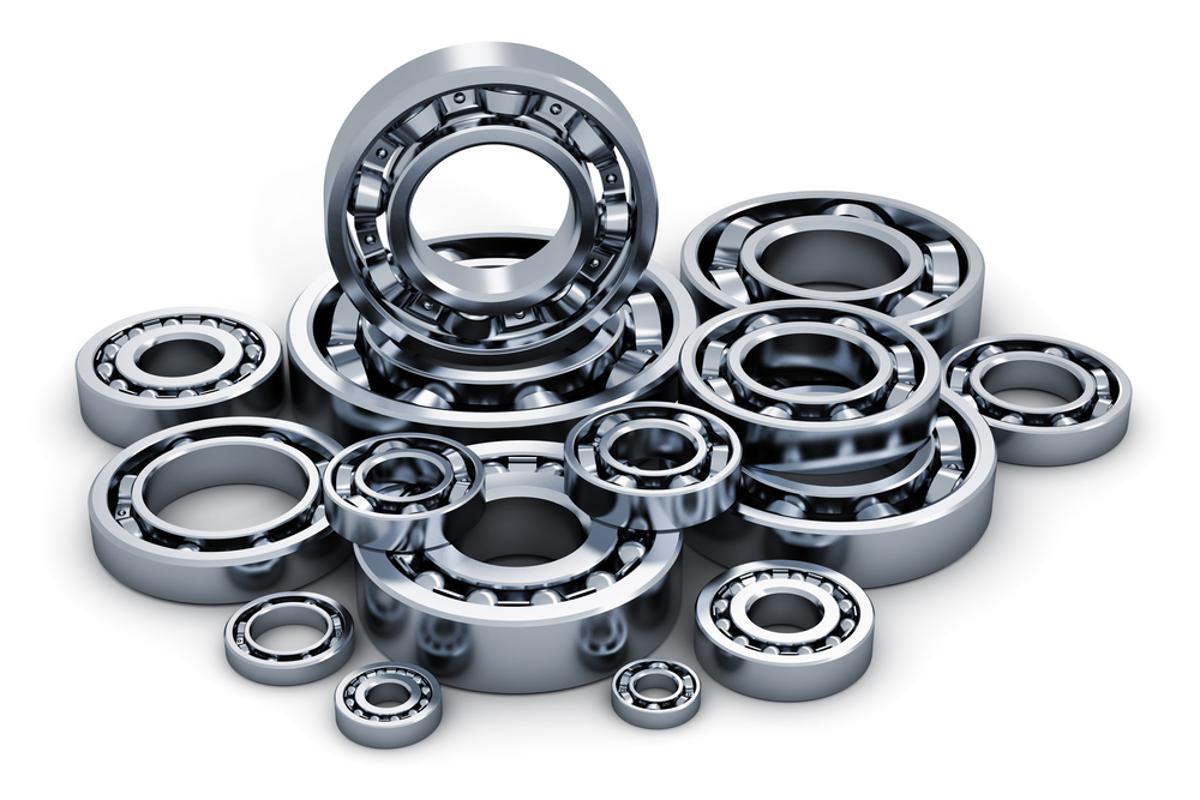
Which are faulty?
While the spectrogram is sometimes better ...
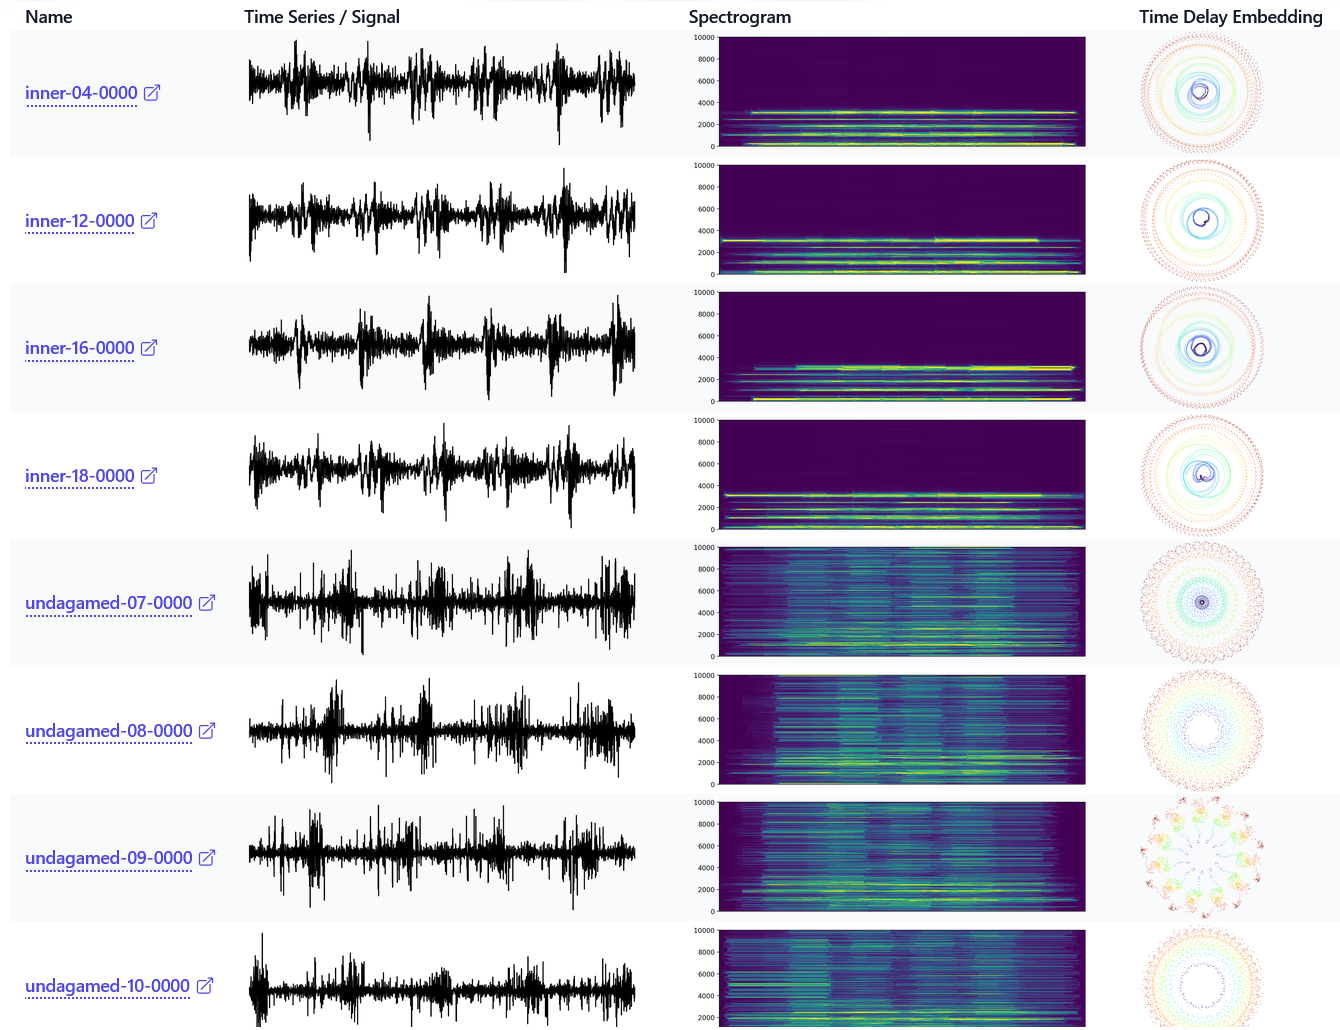
... what about some added noise?
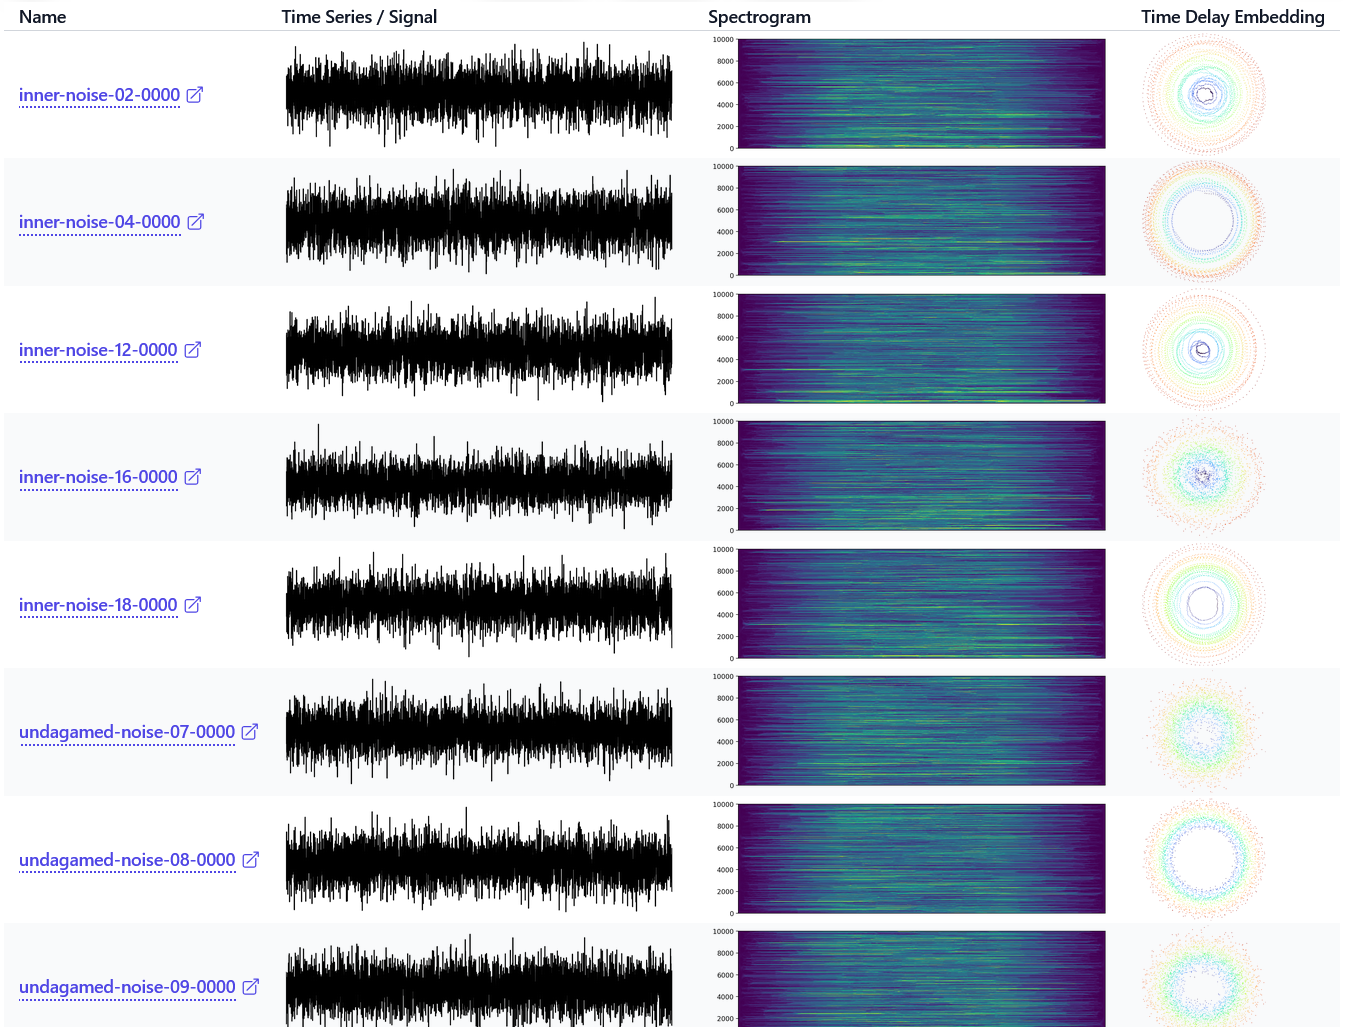
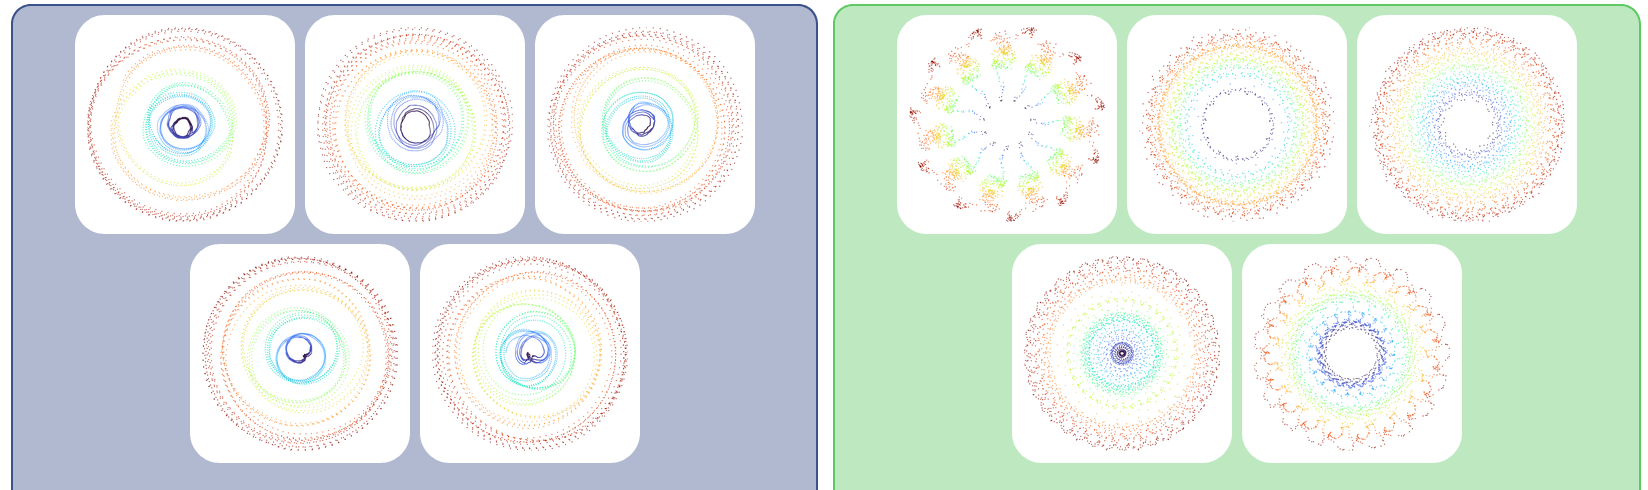
Which are faulty?
Automatic Clustering
What about Explainable AI?
Task 2.5 needs more thinking
Task 2.4 Development of a web-based visualization including domain-specific visualizations
Task 2.5 Development of visual explanations for AI results
| Task 2.4 (Vis) | Task 2.5 (XAI) | |
|---|---|---|
| Cluster | ✅ | ❌ |
| AnoScout (Anomalies) | ✅ | 🤔 |
| Predictpal (Forecasting) | ✅ | ✅ |
| Vibrana (Vibrations) | ✅ | ❌ |
Some Ideas
| Clustering |
|
| AnoScout |
|
| PredictPal |
|
| Vibrana |
|
Contact
Julian Rakuschek
julian.rakuschek@tugraz.at
Prof. Dr. Tobias Schreck
tobias.schreck@tugraz.at
Slides
https://presentations.rakuschek.at/2025-01-16-present-konsortialmeeting