How to read these slides?
 Overview
Click on the menu bar items to navigate to chapters
Click here for PDF version
Interaktive
Visualisierungen
für
Zeitreihen
Julian Rakuschek
27.10.2025
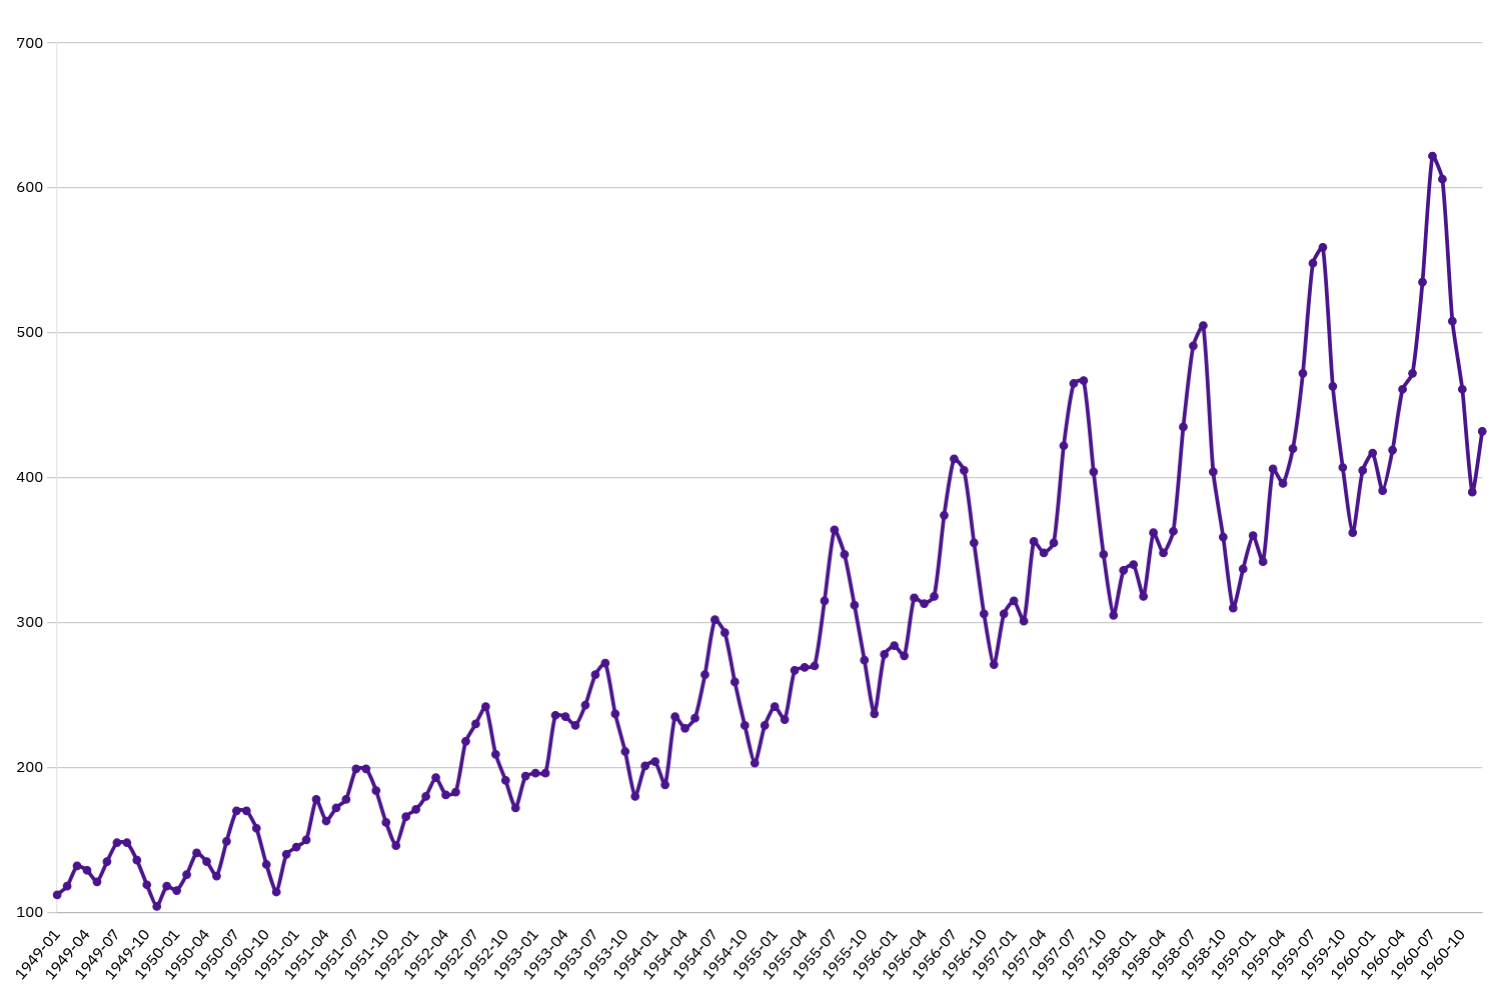
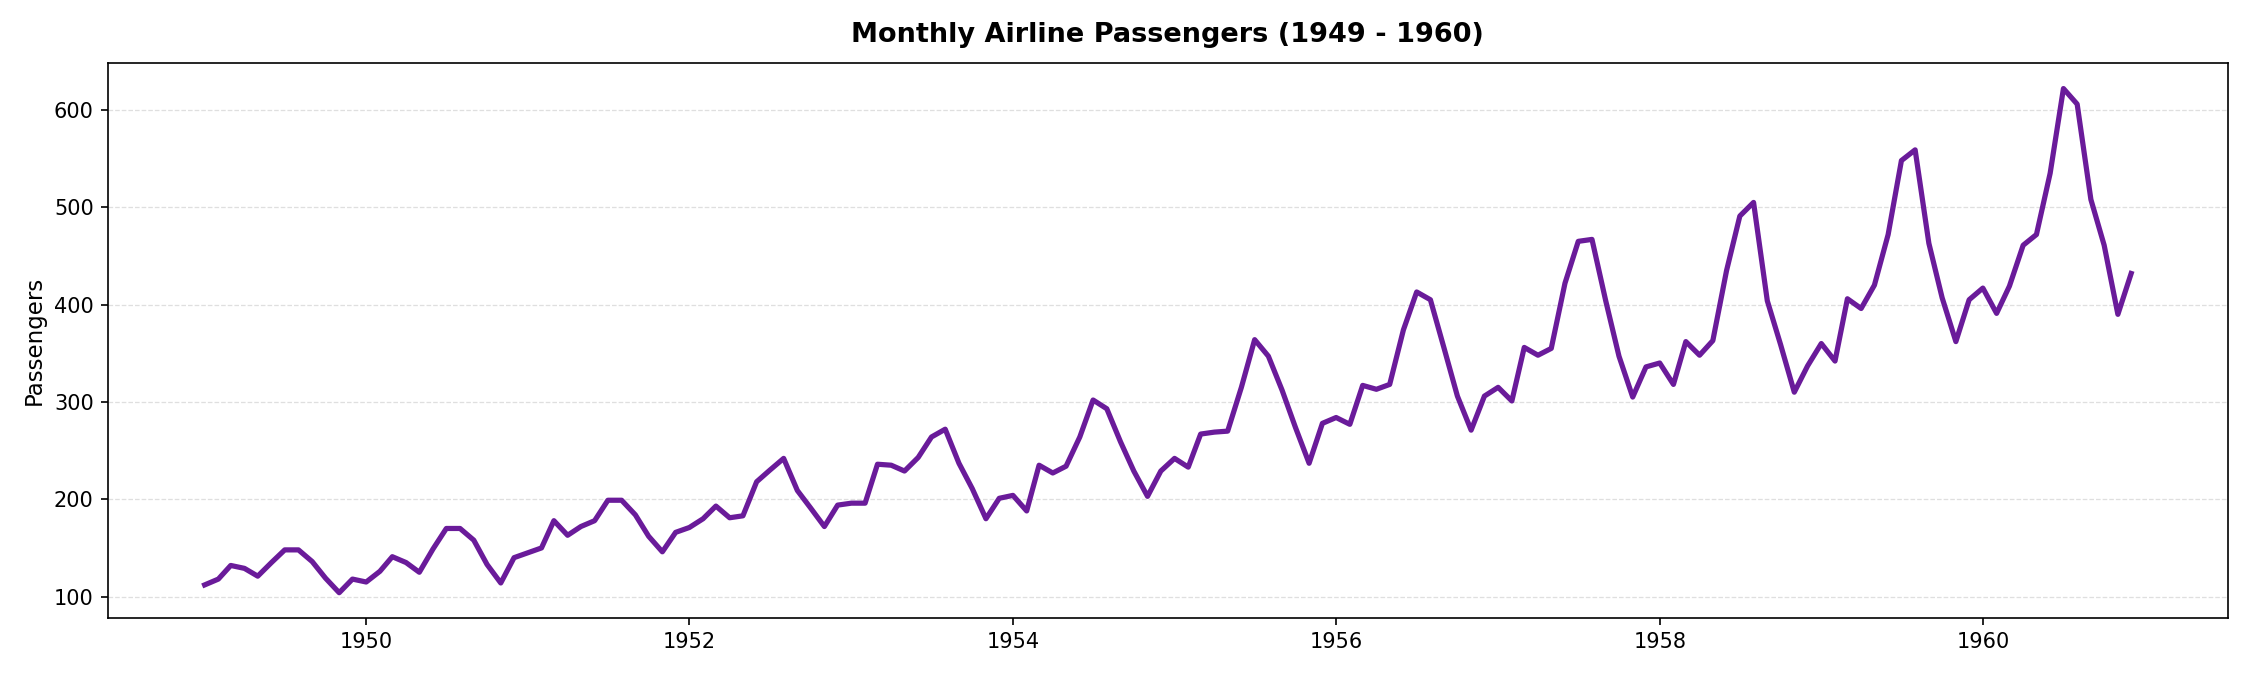
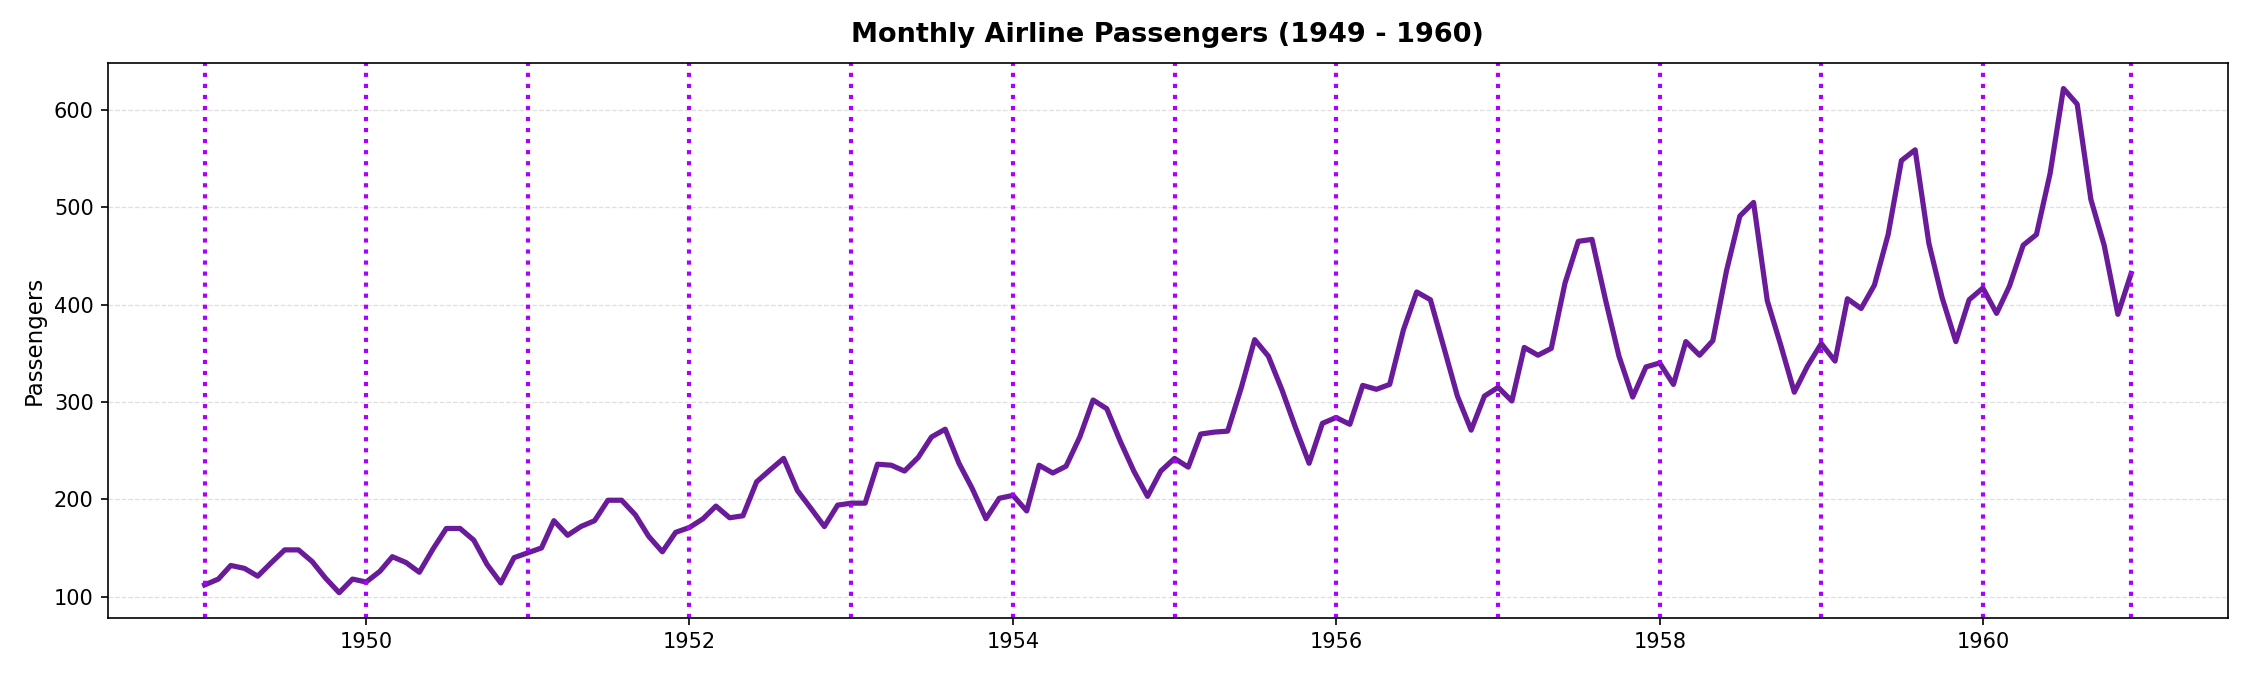
A glance into our Excel sheet:
                112, 118, 132, 129, 121, 135, 148, 148, 136, 119, 104, 118, 115, 126, 141, 135, 125, 149, 170, 170, 158,
                133, 114, 140, 145, 150, 178, 163, 172, 178, 199, 199, 184, 162, 146, 166, 171, 180, 193, 181, 183, 218,
                230, 242, 209, 191, 172, 194, 196, 196, 236, 235, 229, 243, 264, 272, 237, 211, 180, 201, 204, 188, 235,
                227, 234, 264, 302, 293, 259, 229, 203, 229, 242, 233, 267, 269, 270, 315, 364, 347, 312, 274, 237, 278,
                284, 277, 317, 313, 318, 374, 413, 405, 355, 306, 271, 306, 315, 301, 356, 348, 355, 422, 465, 467, 404,
                347, 305, 336, 340, 318, 362, 348, 363, 435, 491, 505, 404, 359, 310, 337, 360, 342, 406, 396, 420, 472,
                548, 559, 463, 407, 362, 405, 417, 391, 419, 461, 472, 535, 622, 606, 508, 461, 390, 432
Detecting patterns is cumbersome!
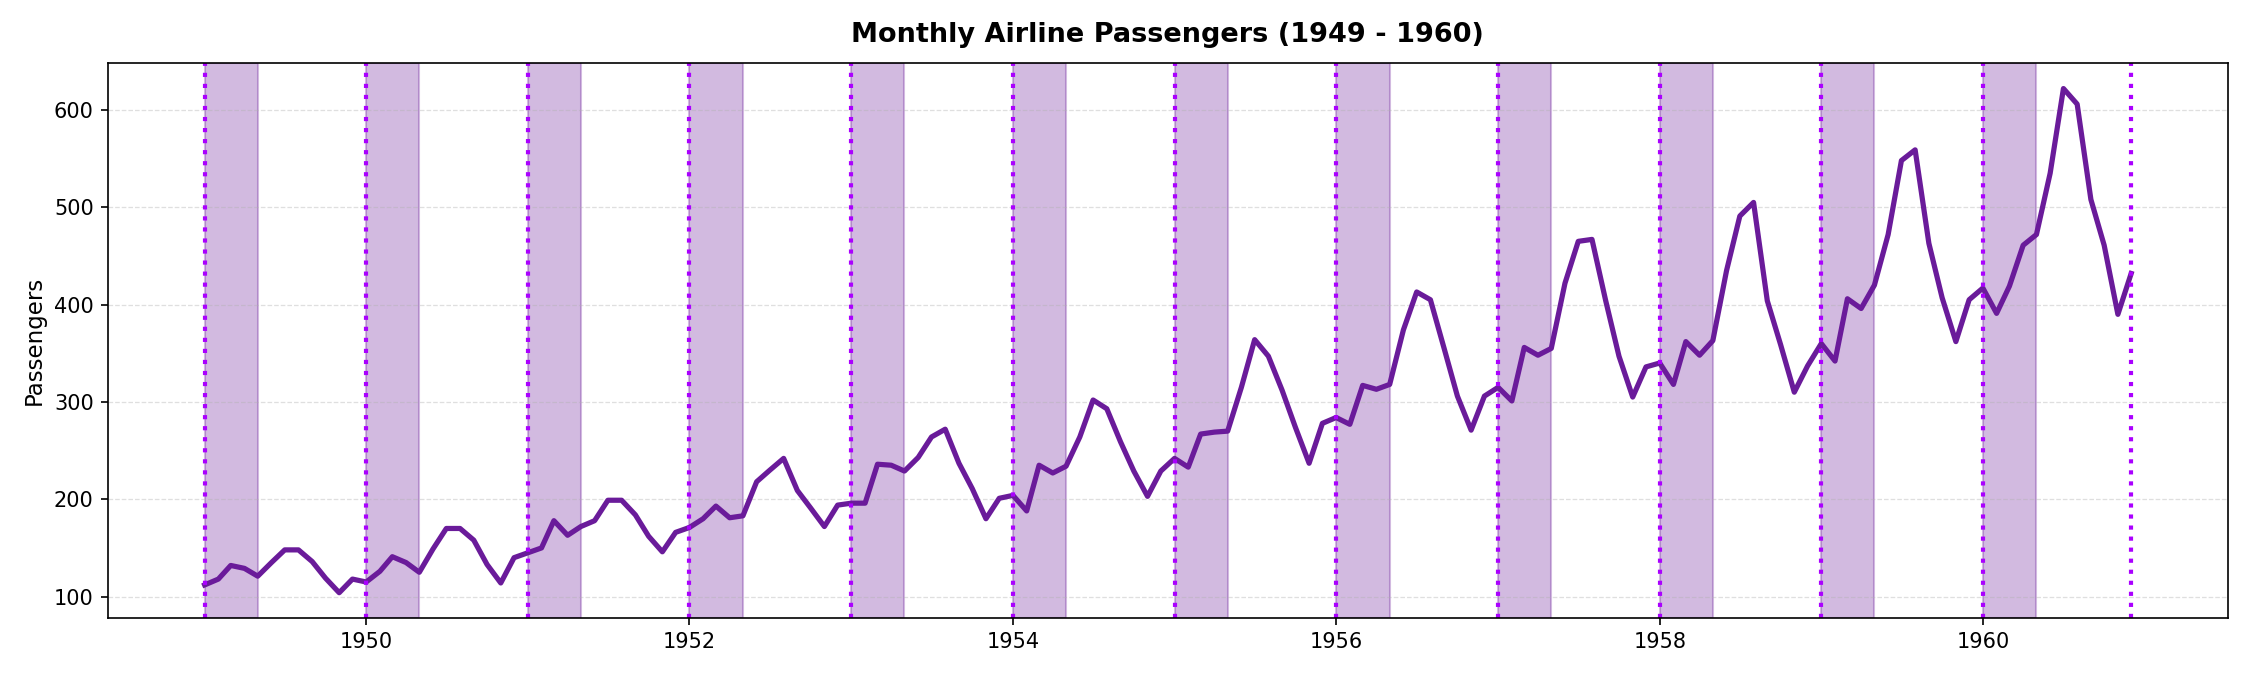
Better:
Challenges:
 Large Time Series
 Many Time Series
How do I navigate through large datasets?
Content
Vibrations
Periodic Time Series

Visual Anomaly Detection
This will be a quick overview
If you see something interesting ...

... you are very welcome to talk to me!
Visual Fingerprints
for Vibration Signals
Vibrationen messen
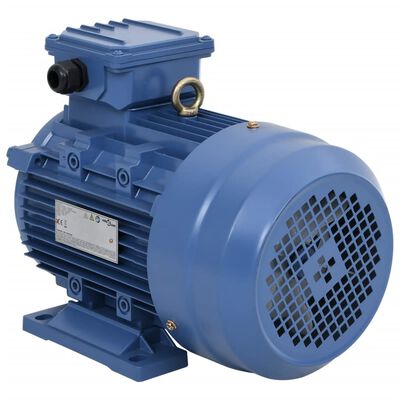
Motor
+
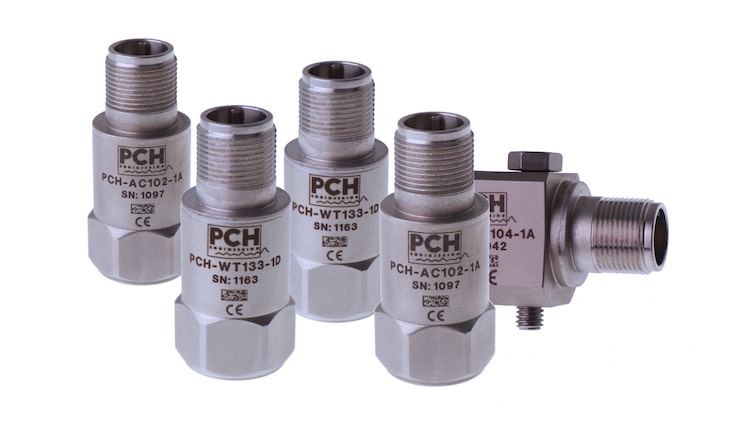
Accelerometer
=
Vibrationssignal
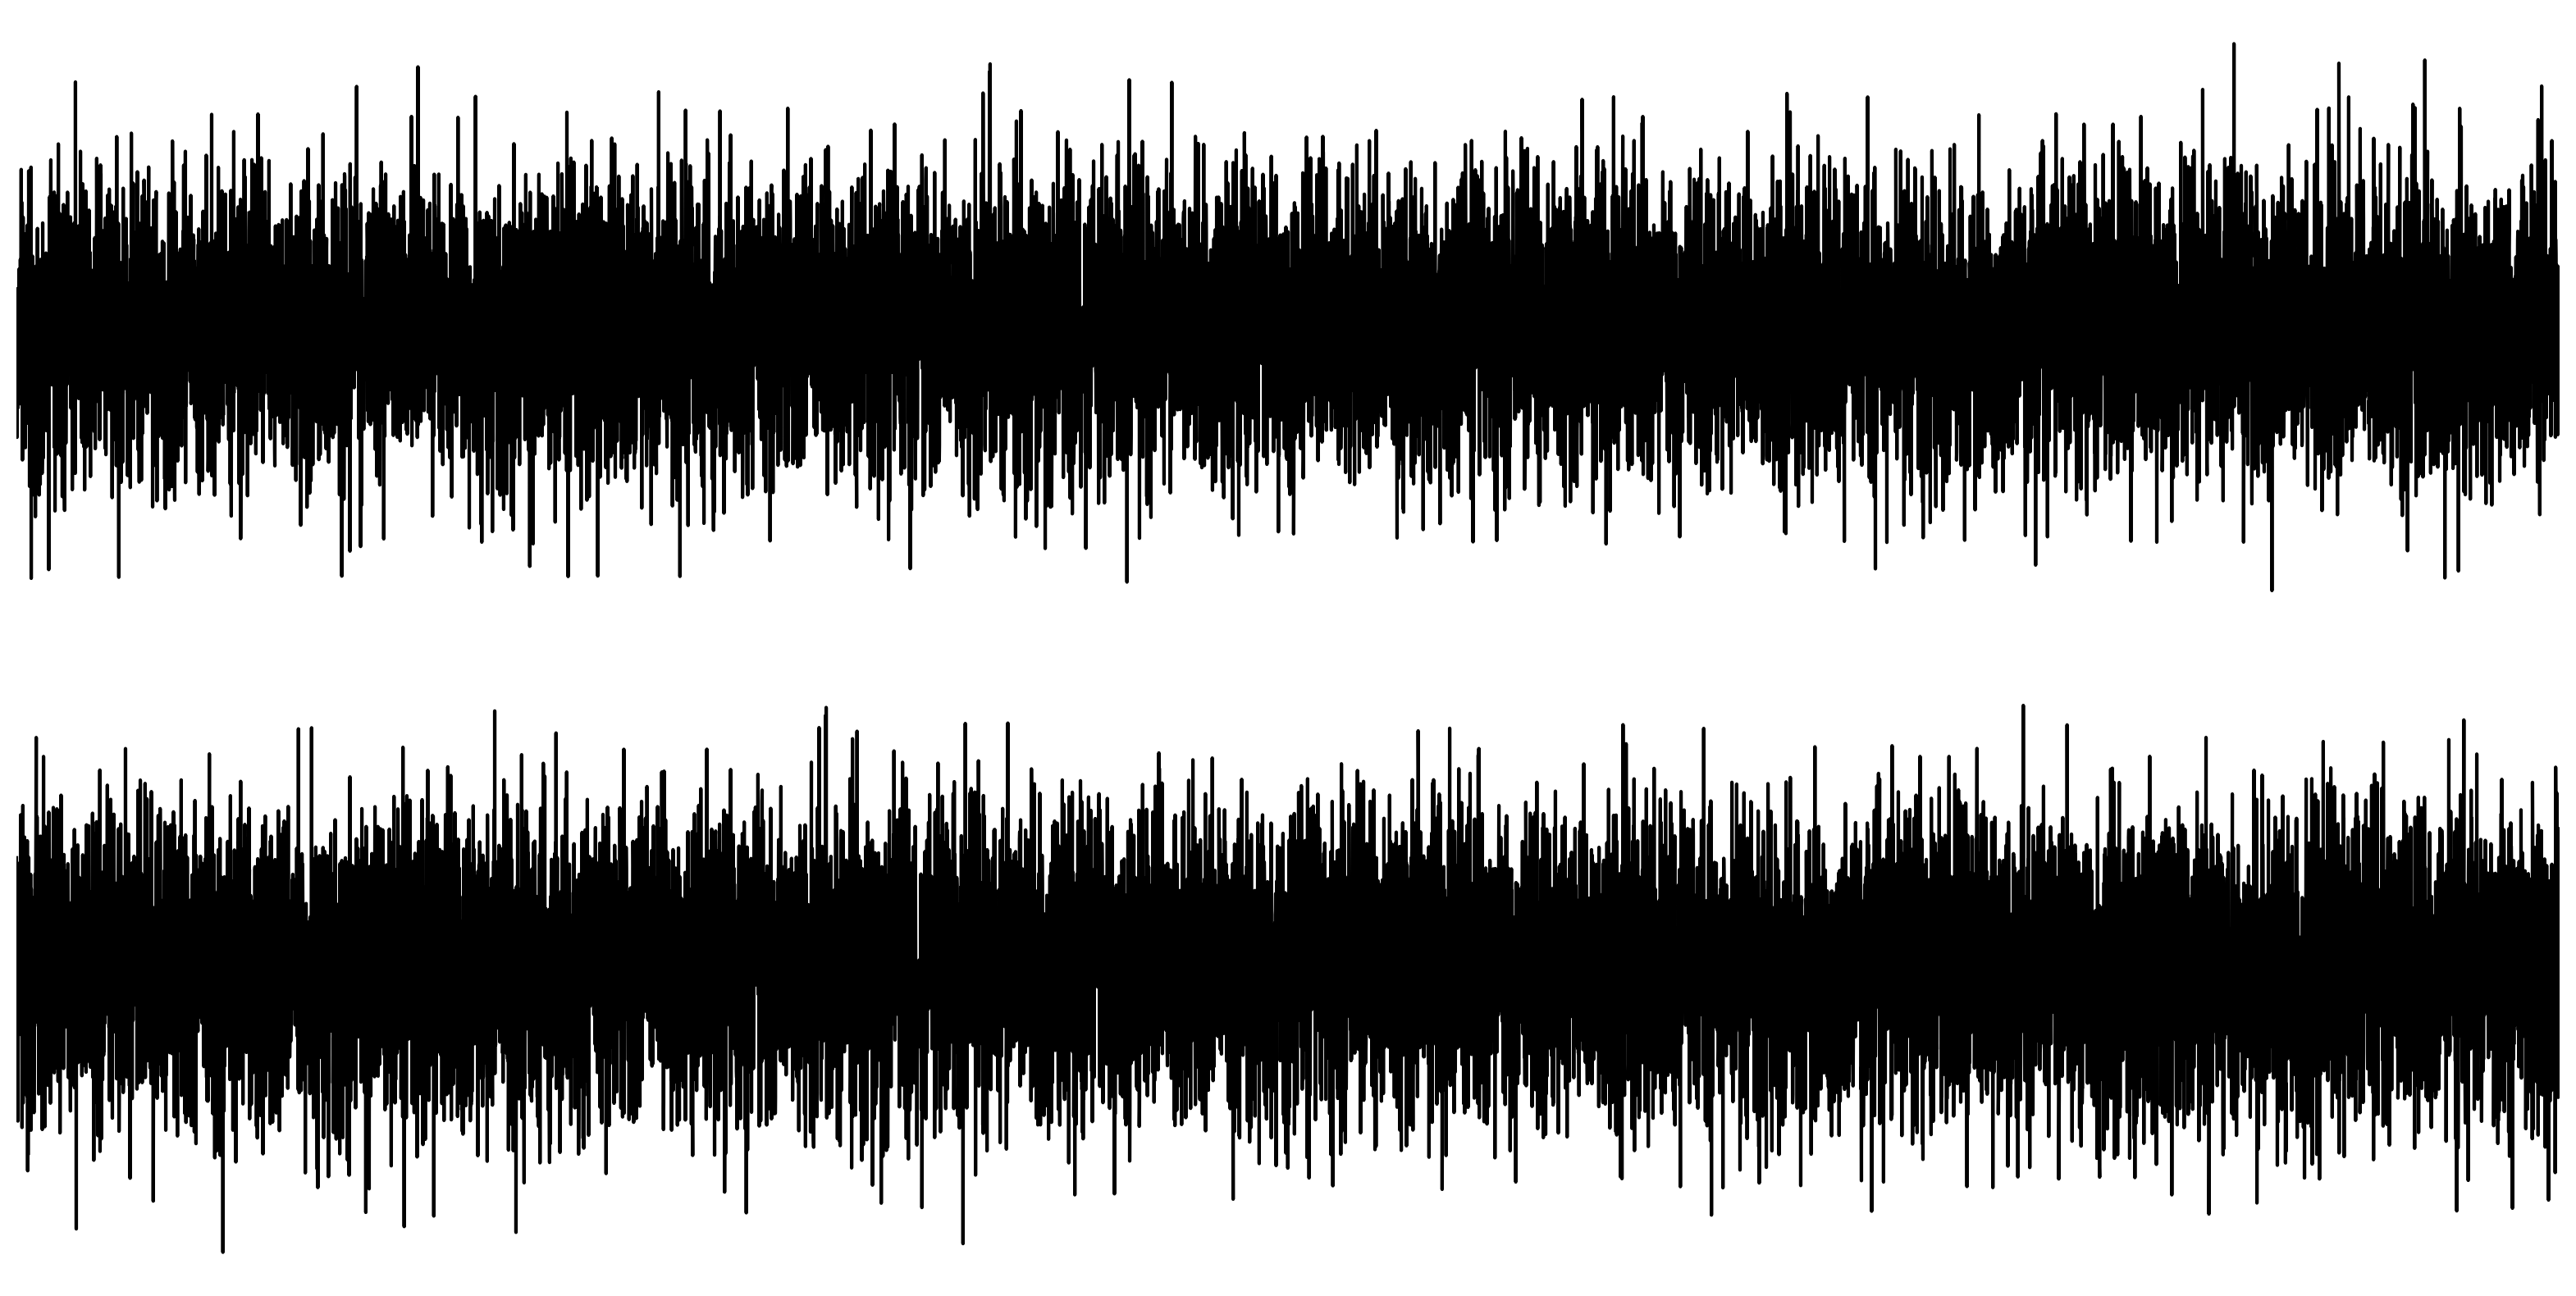
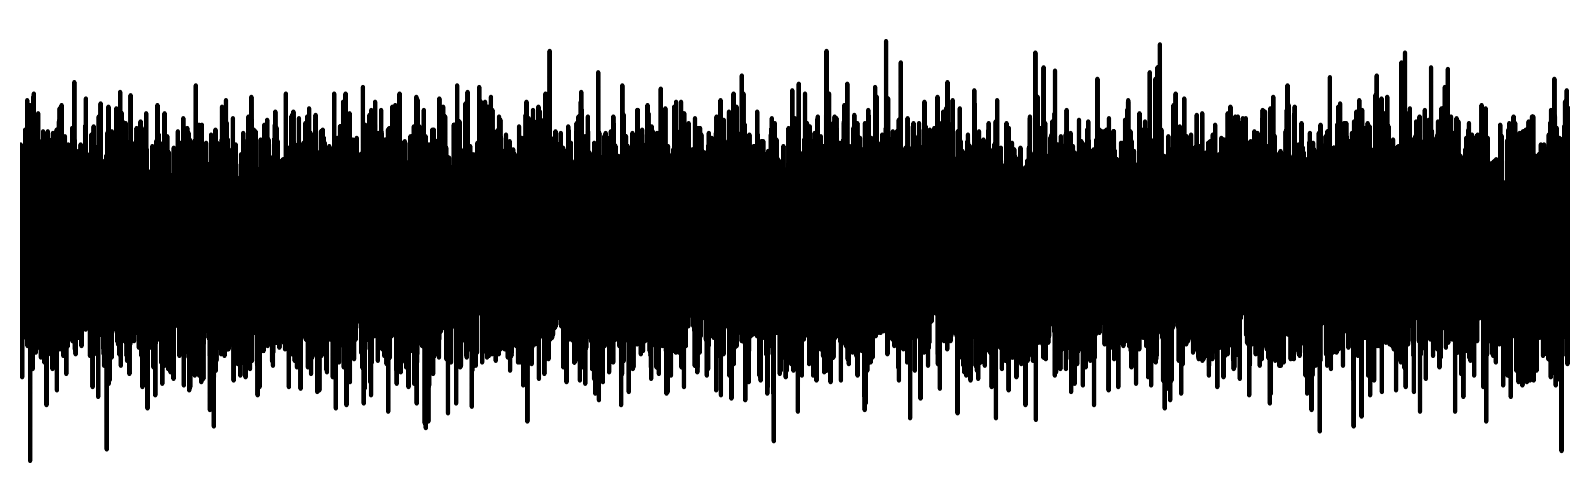
The Problem with Vibrations
Can you tell the difference?
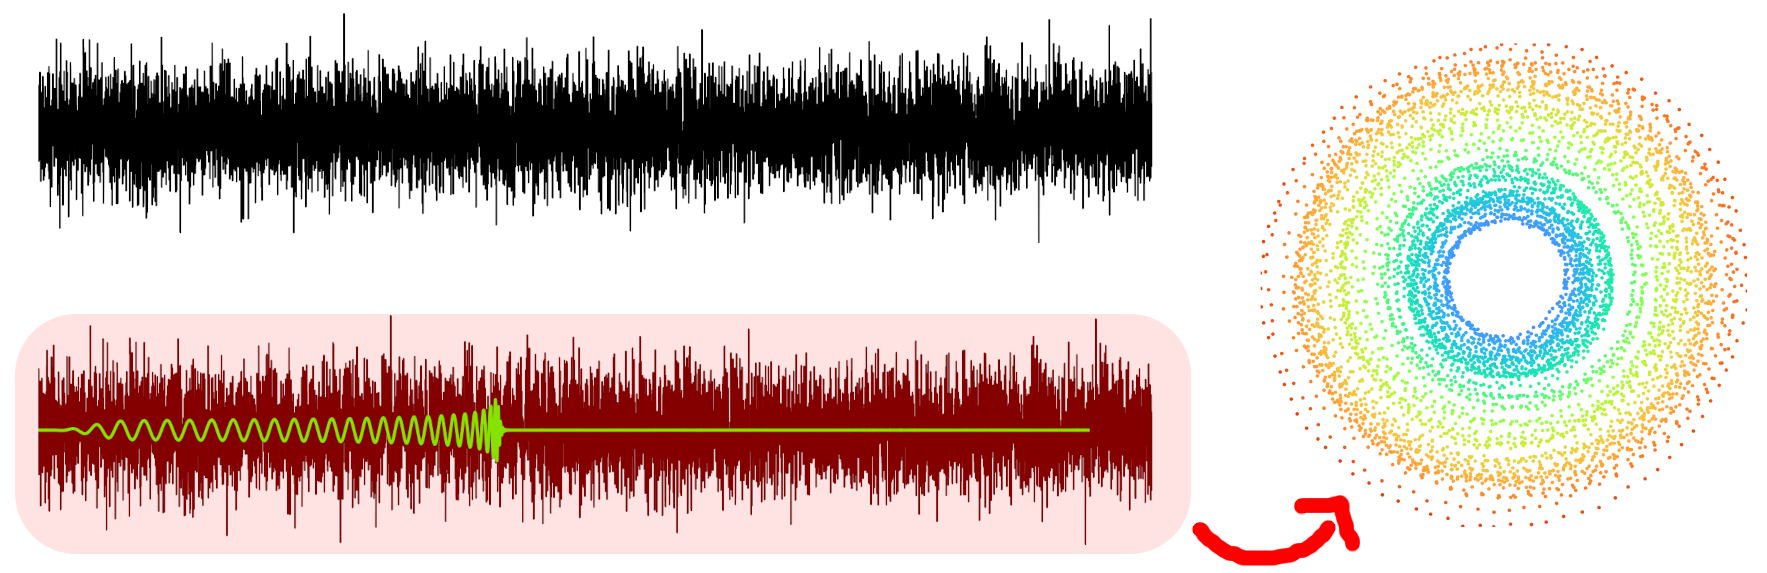
A hidden signal
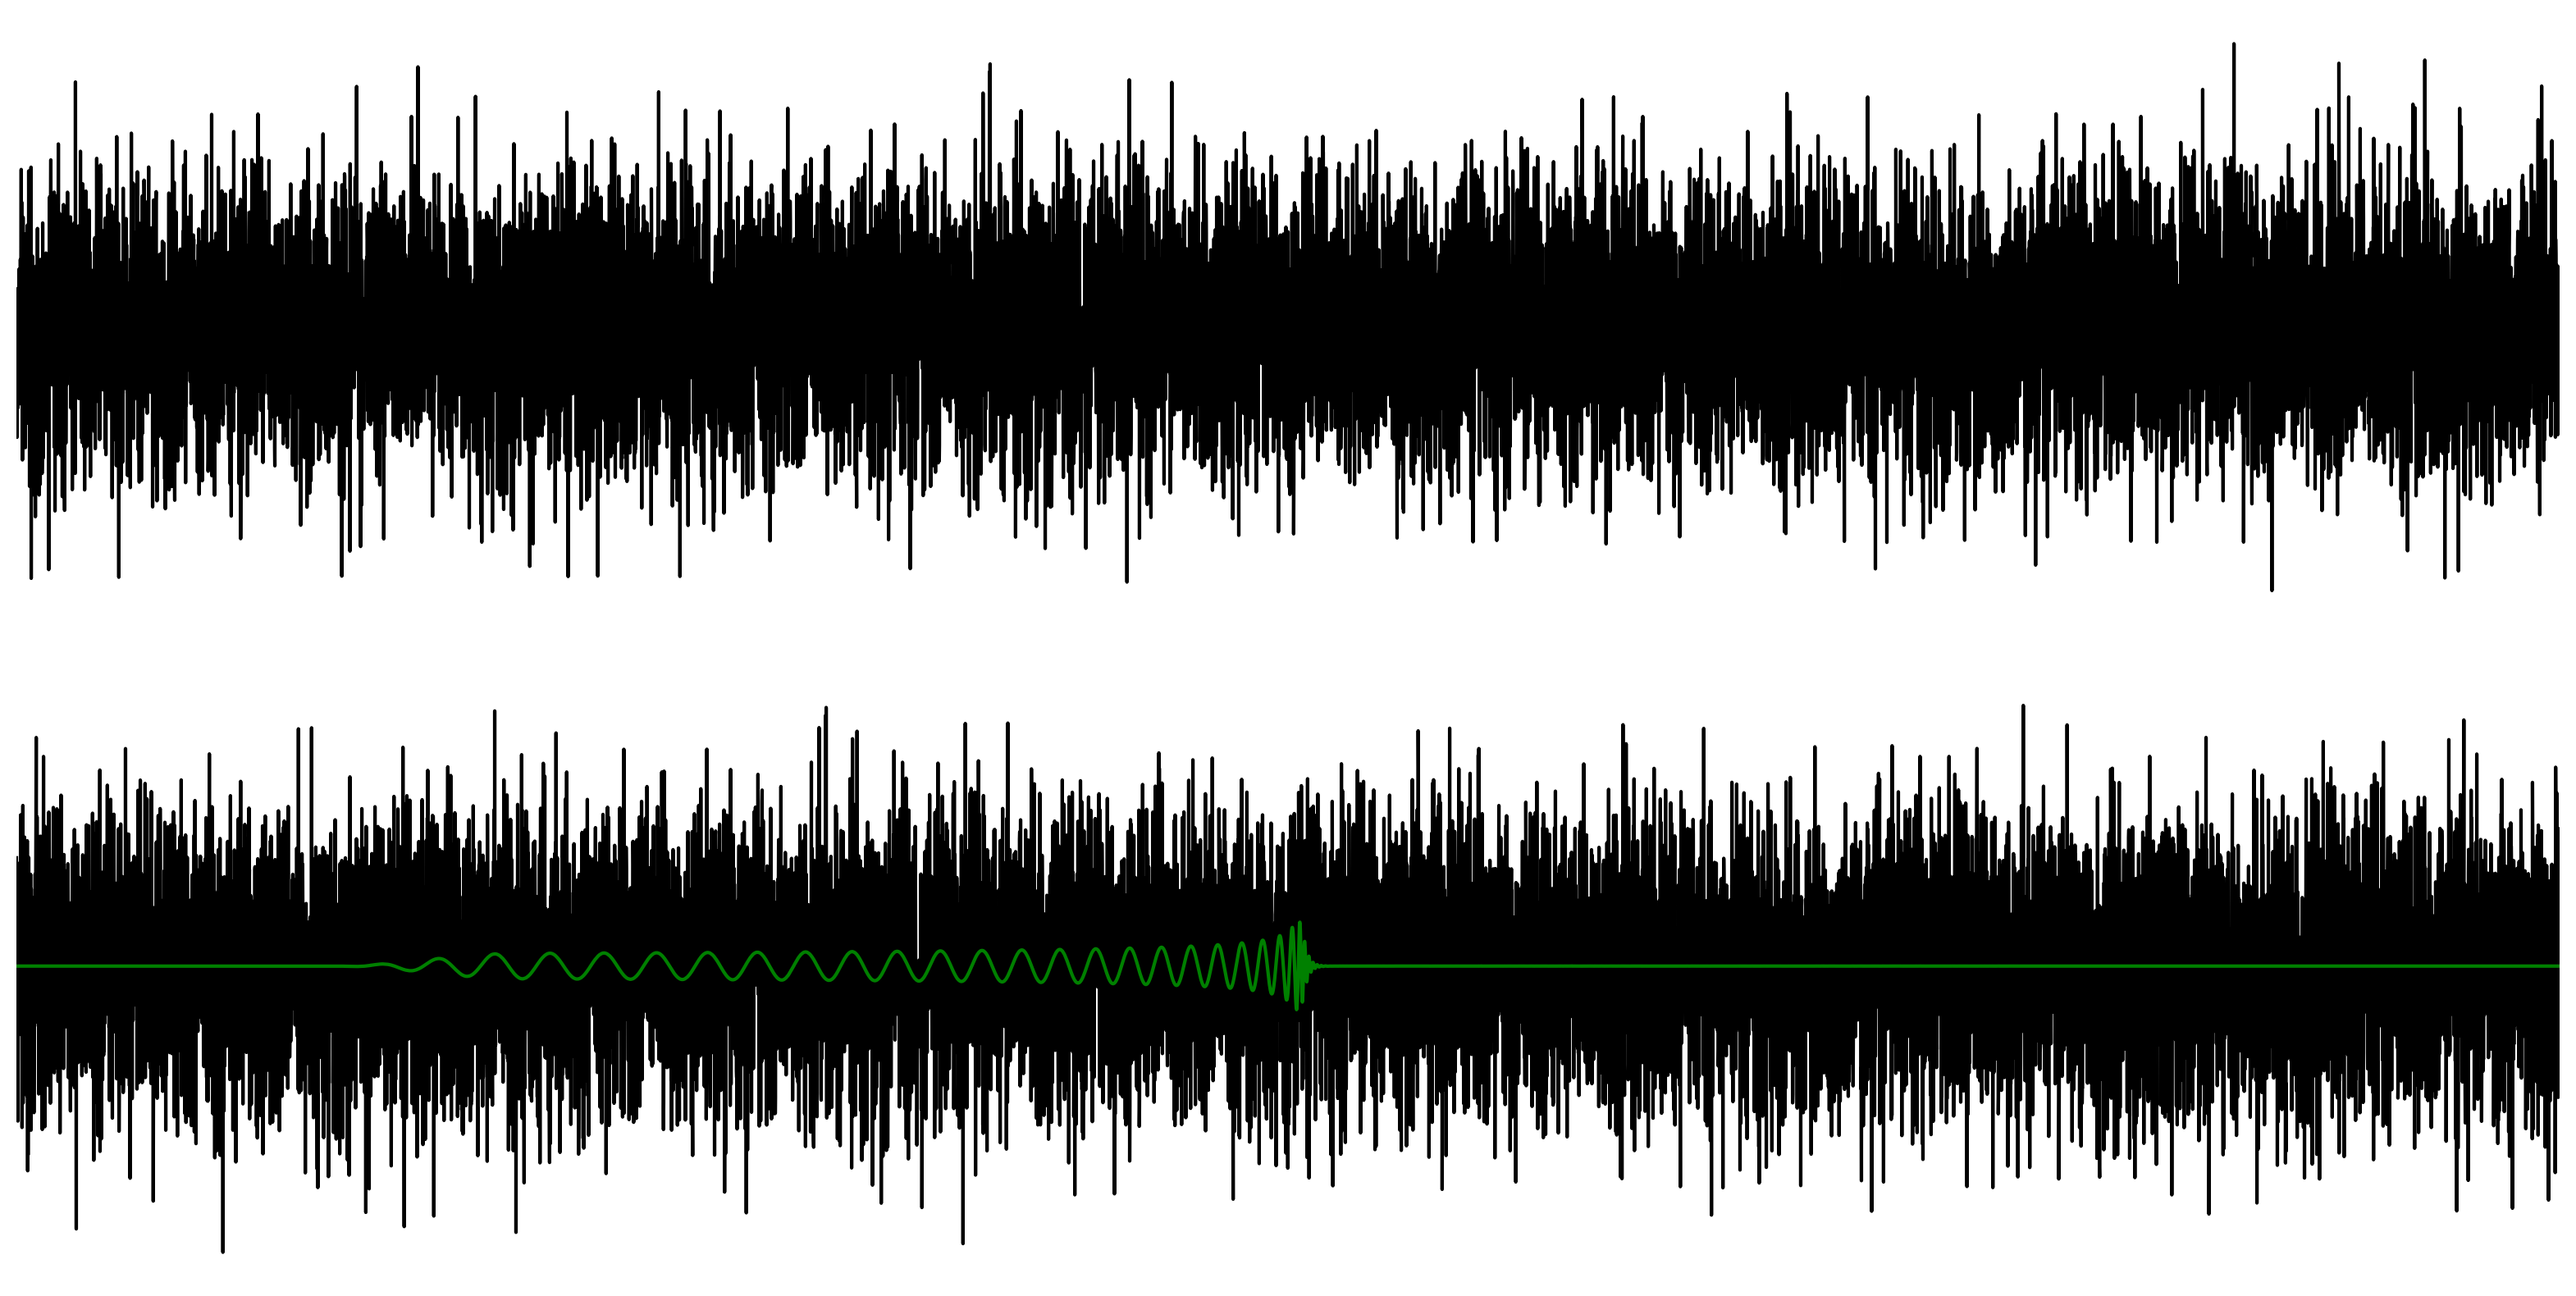
You cannot see the hidden signal with a line chart.
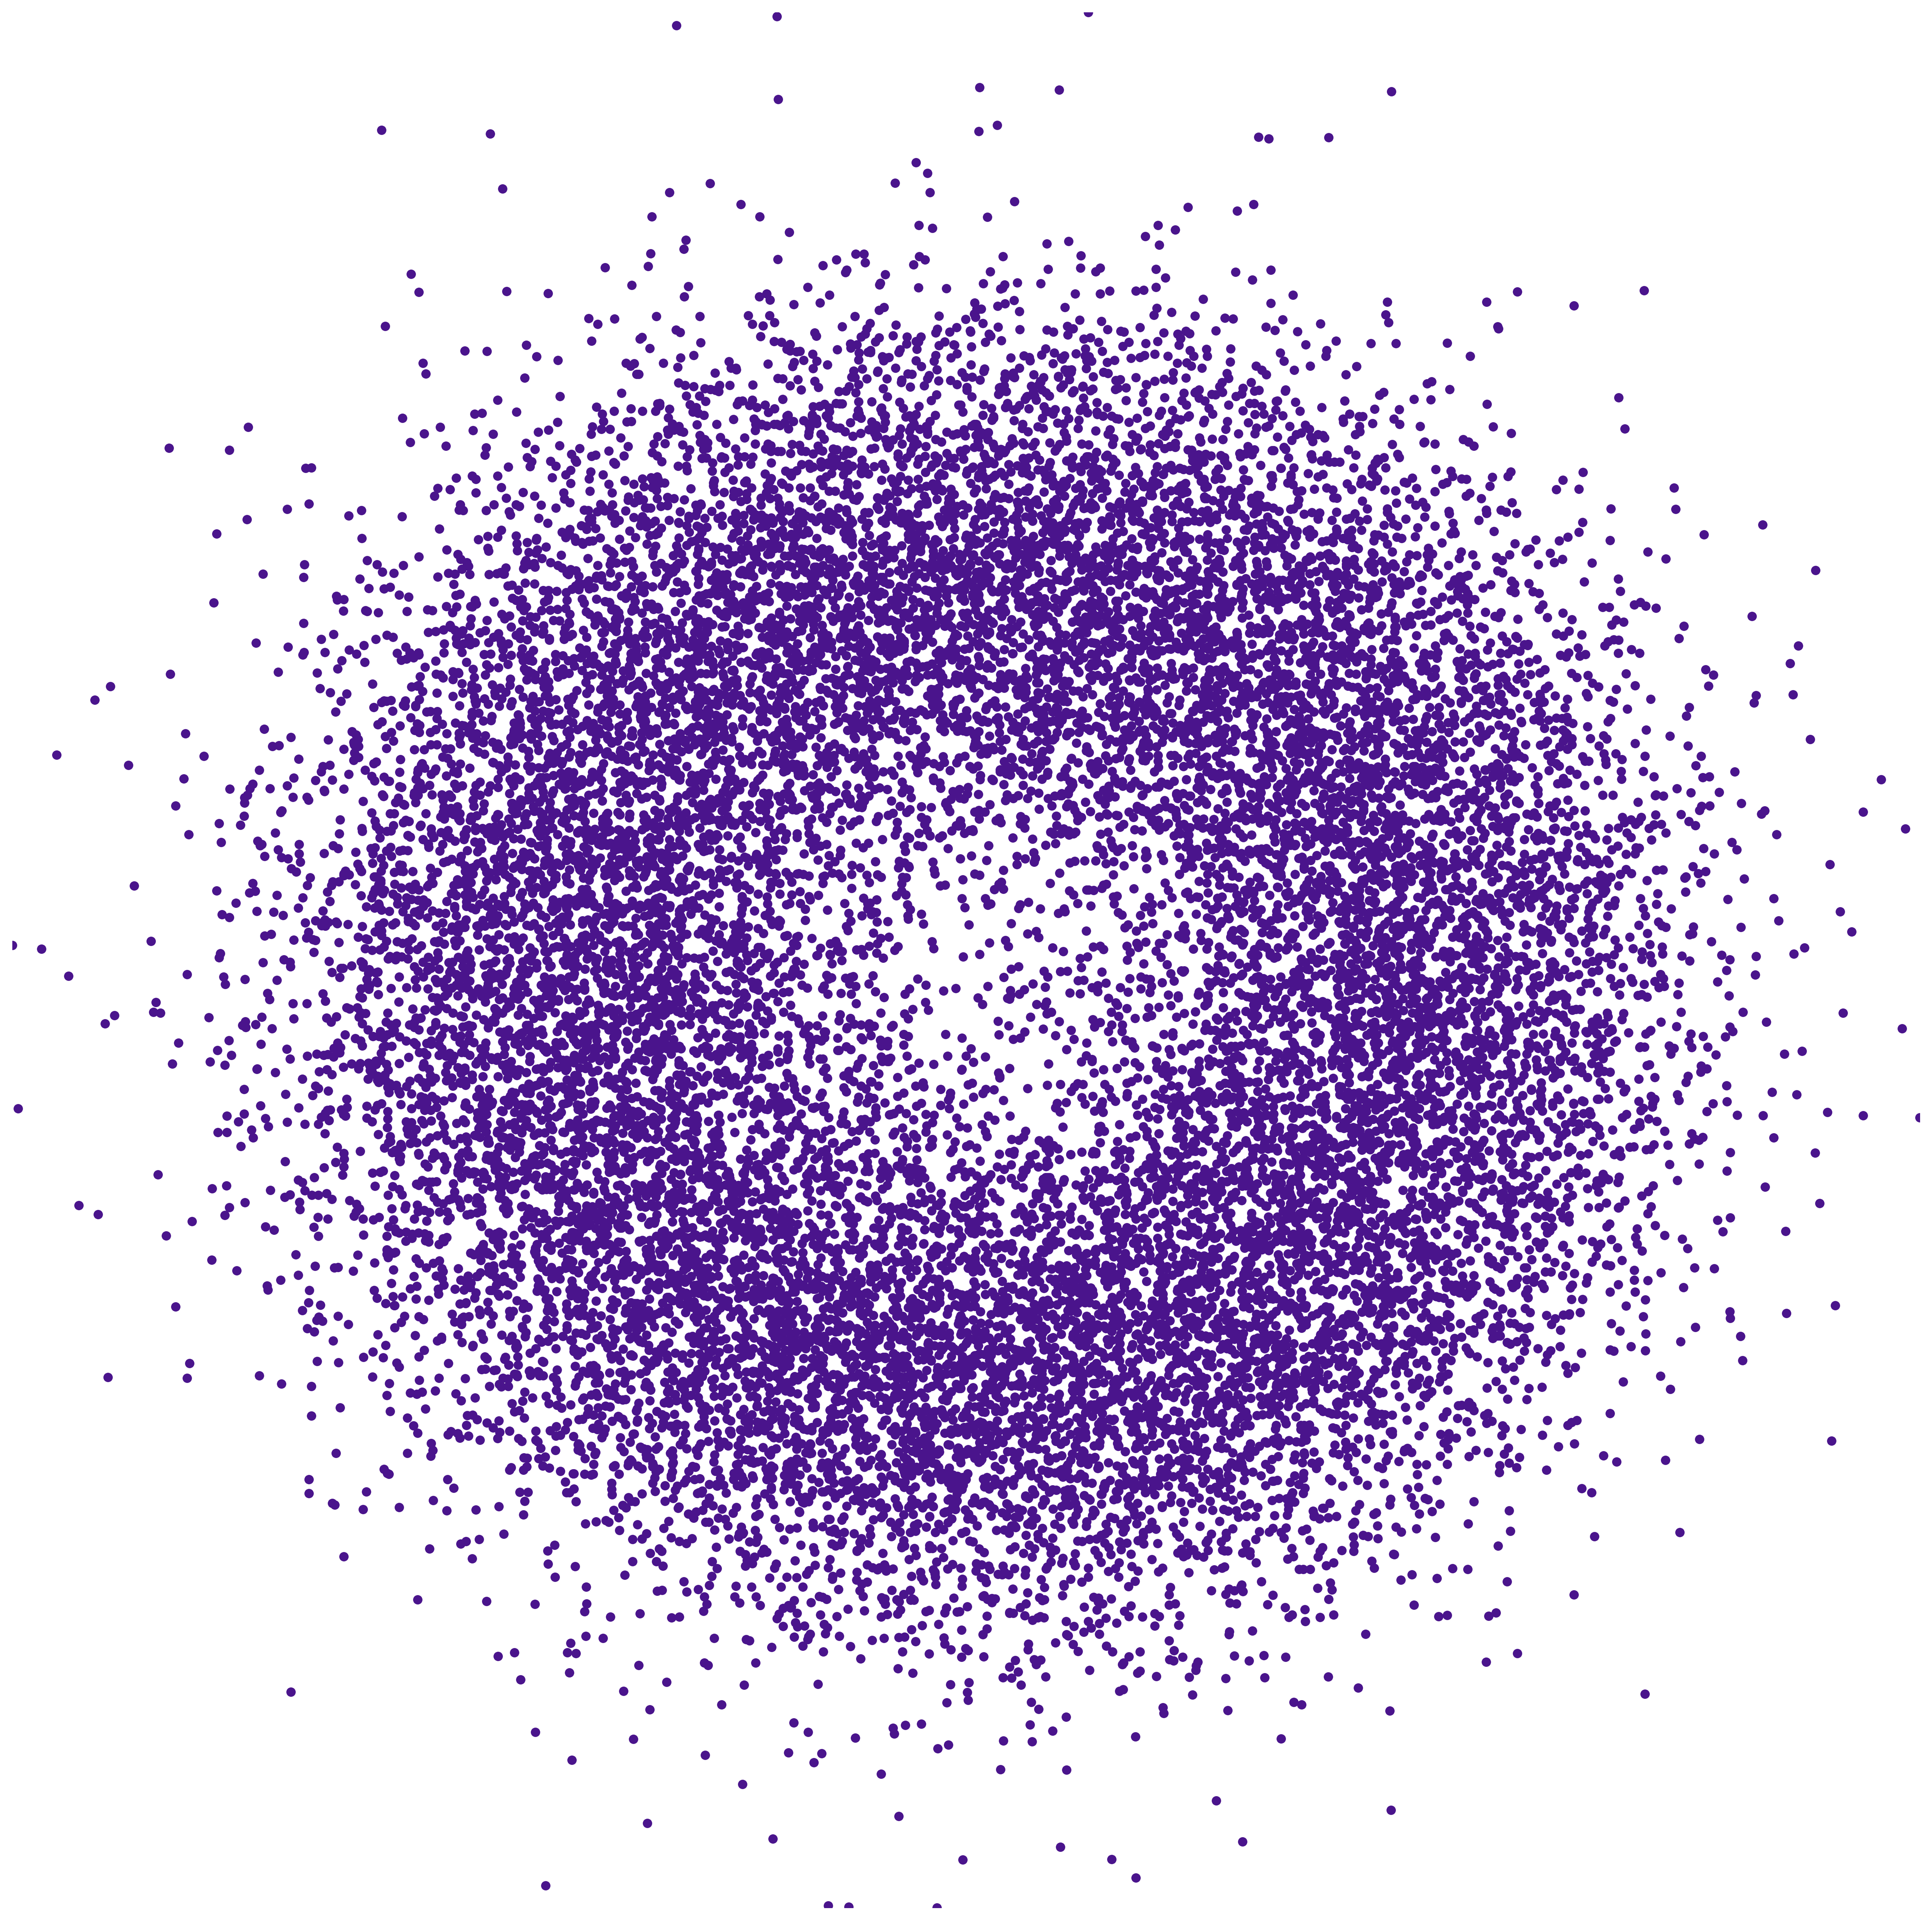
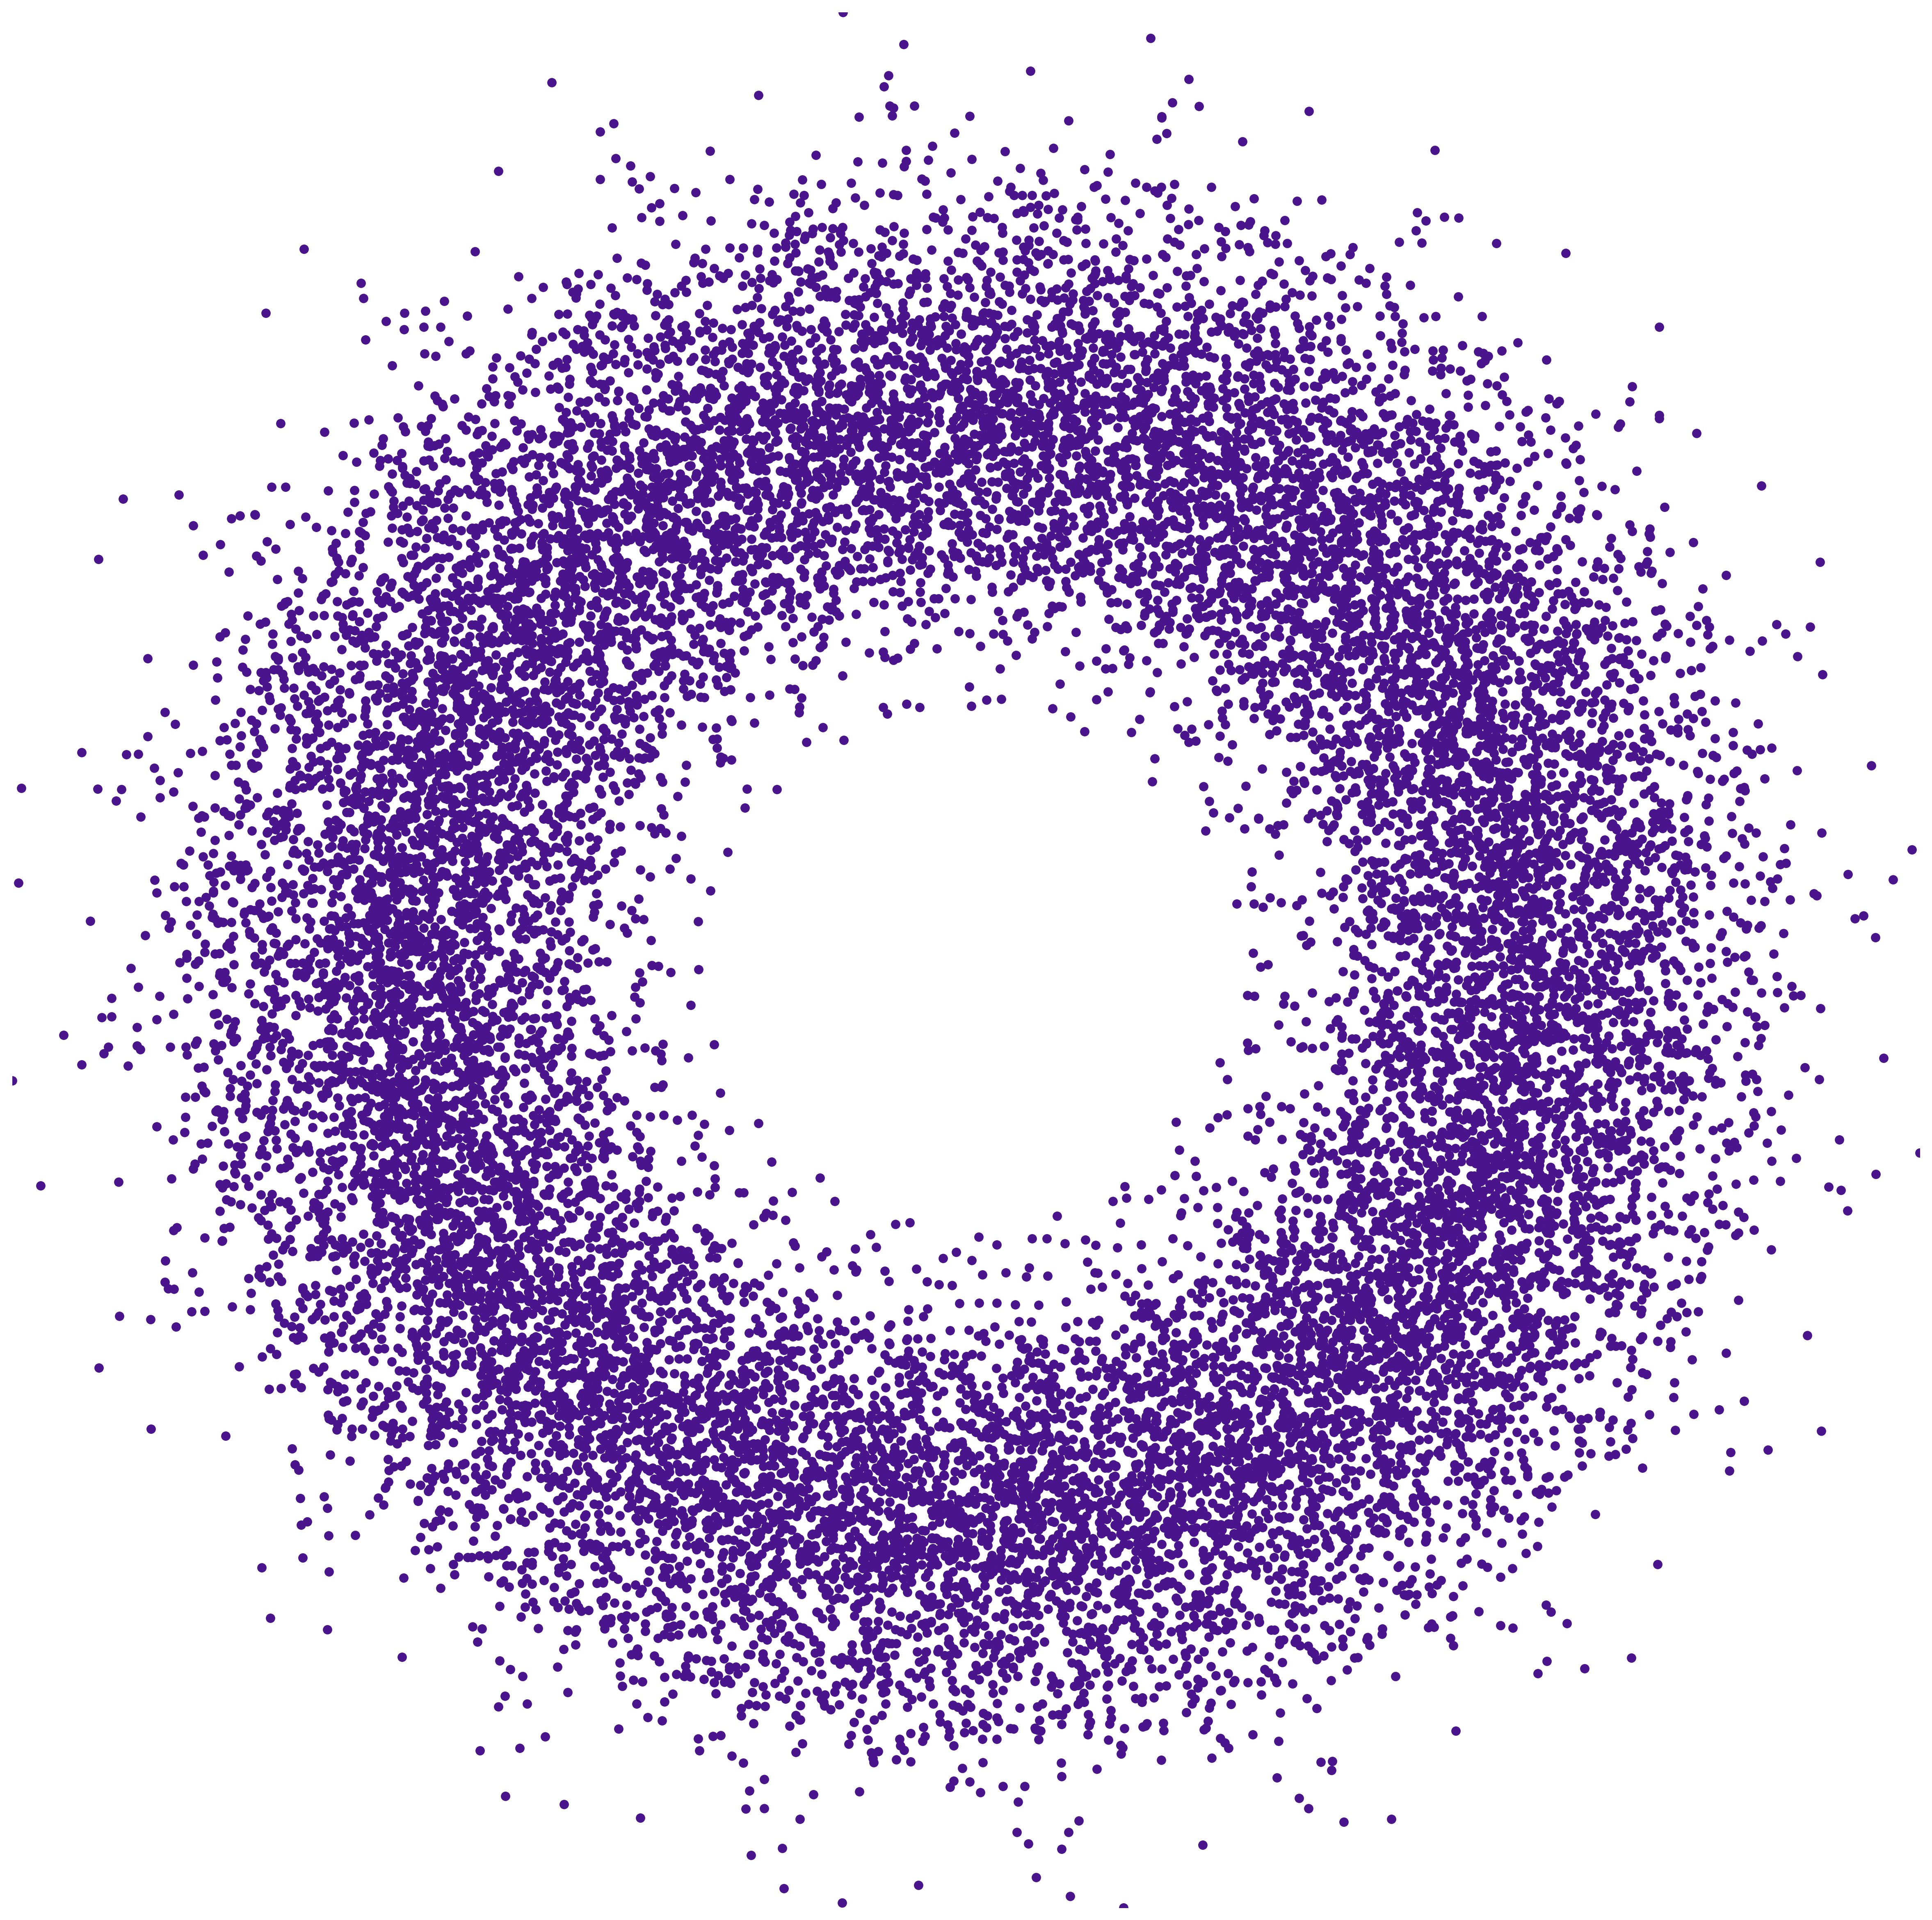
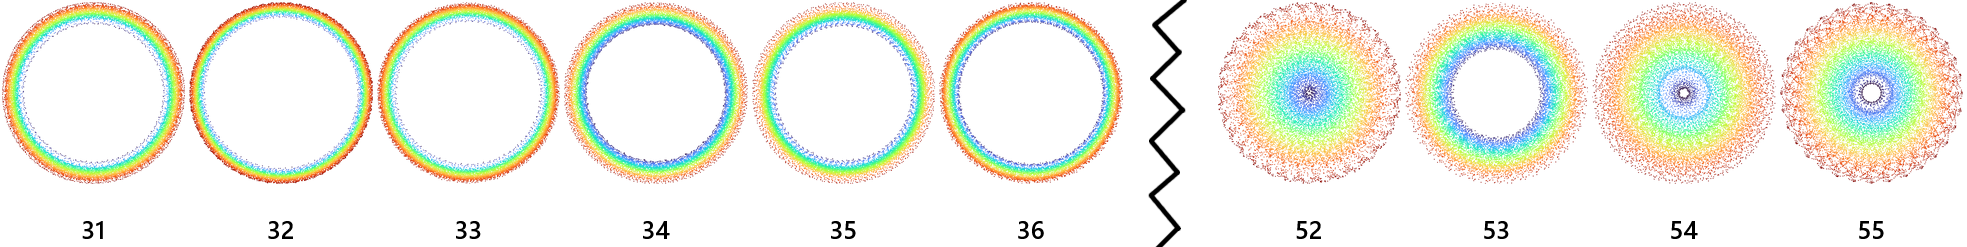
The Idea: Vibration $\rightarrow$ Point Cloud
2. Apply PCA
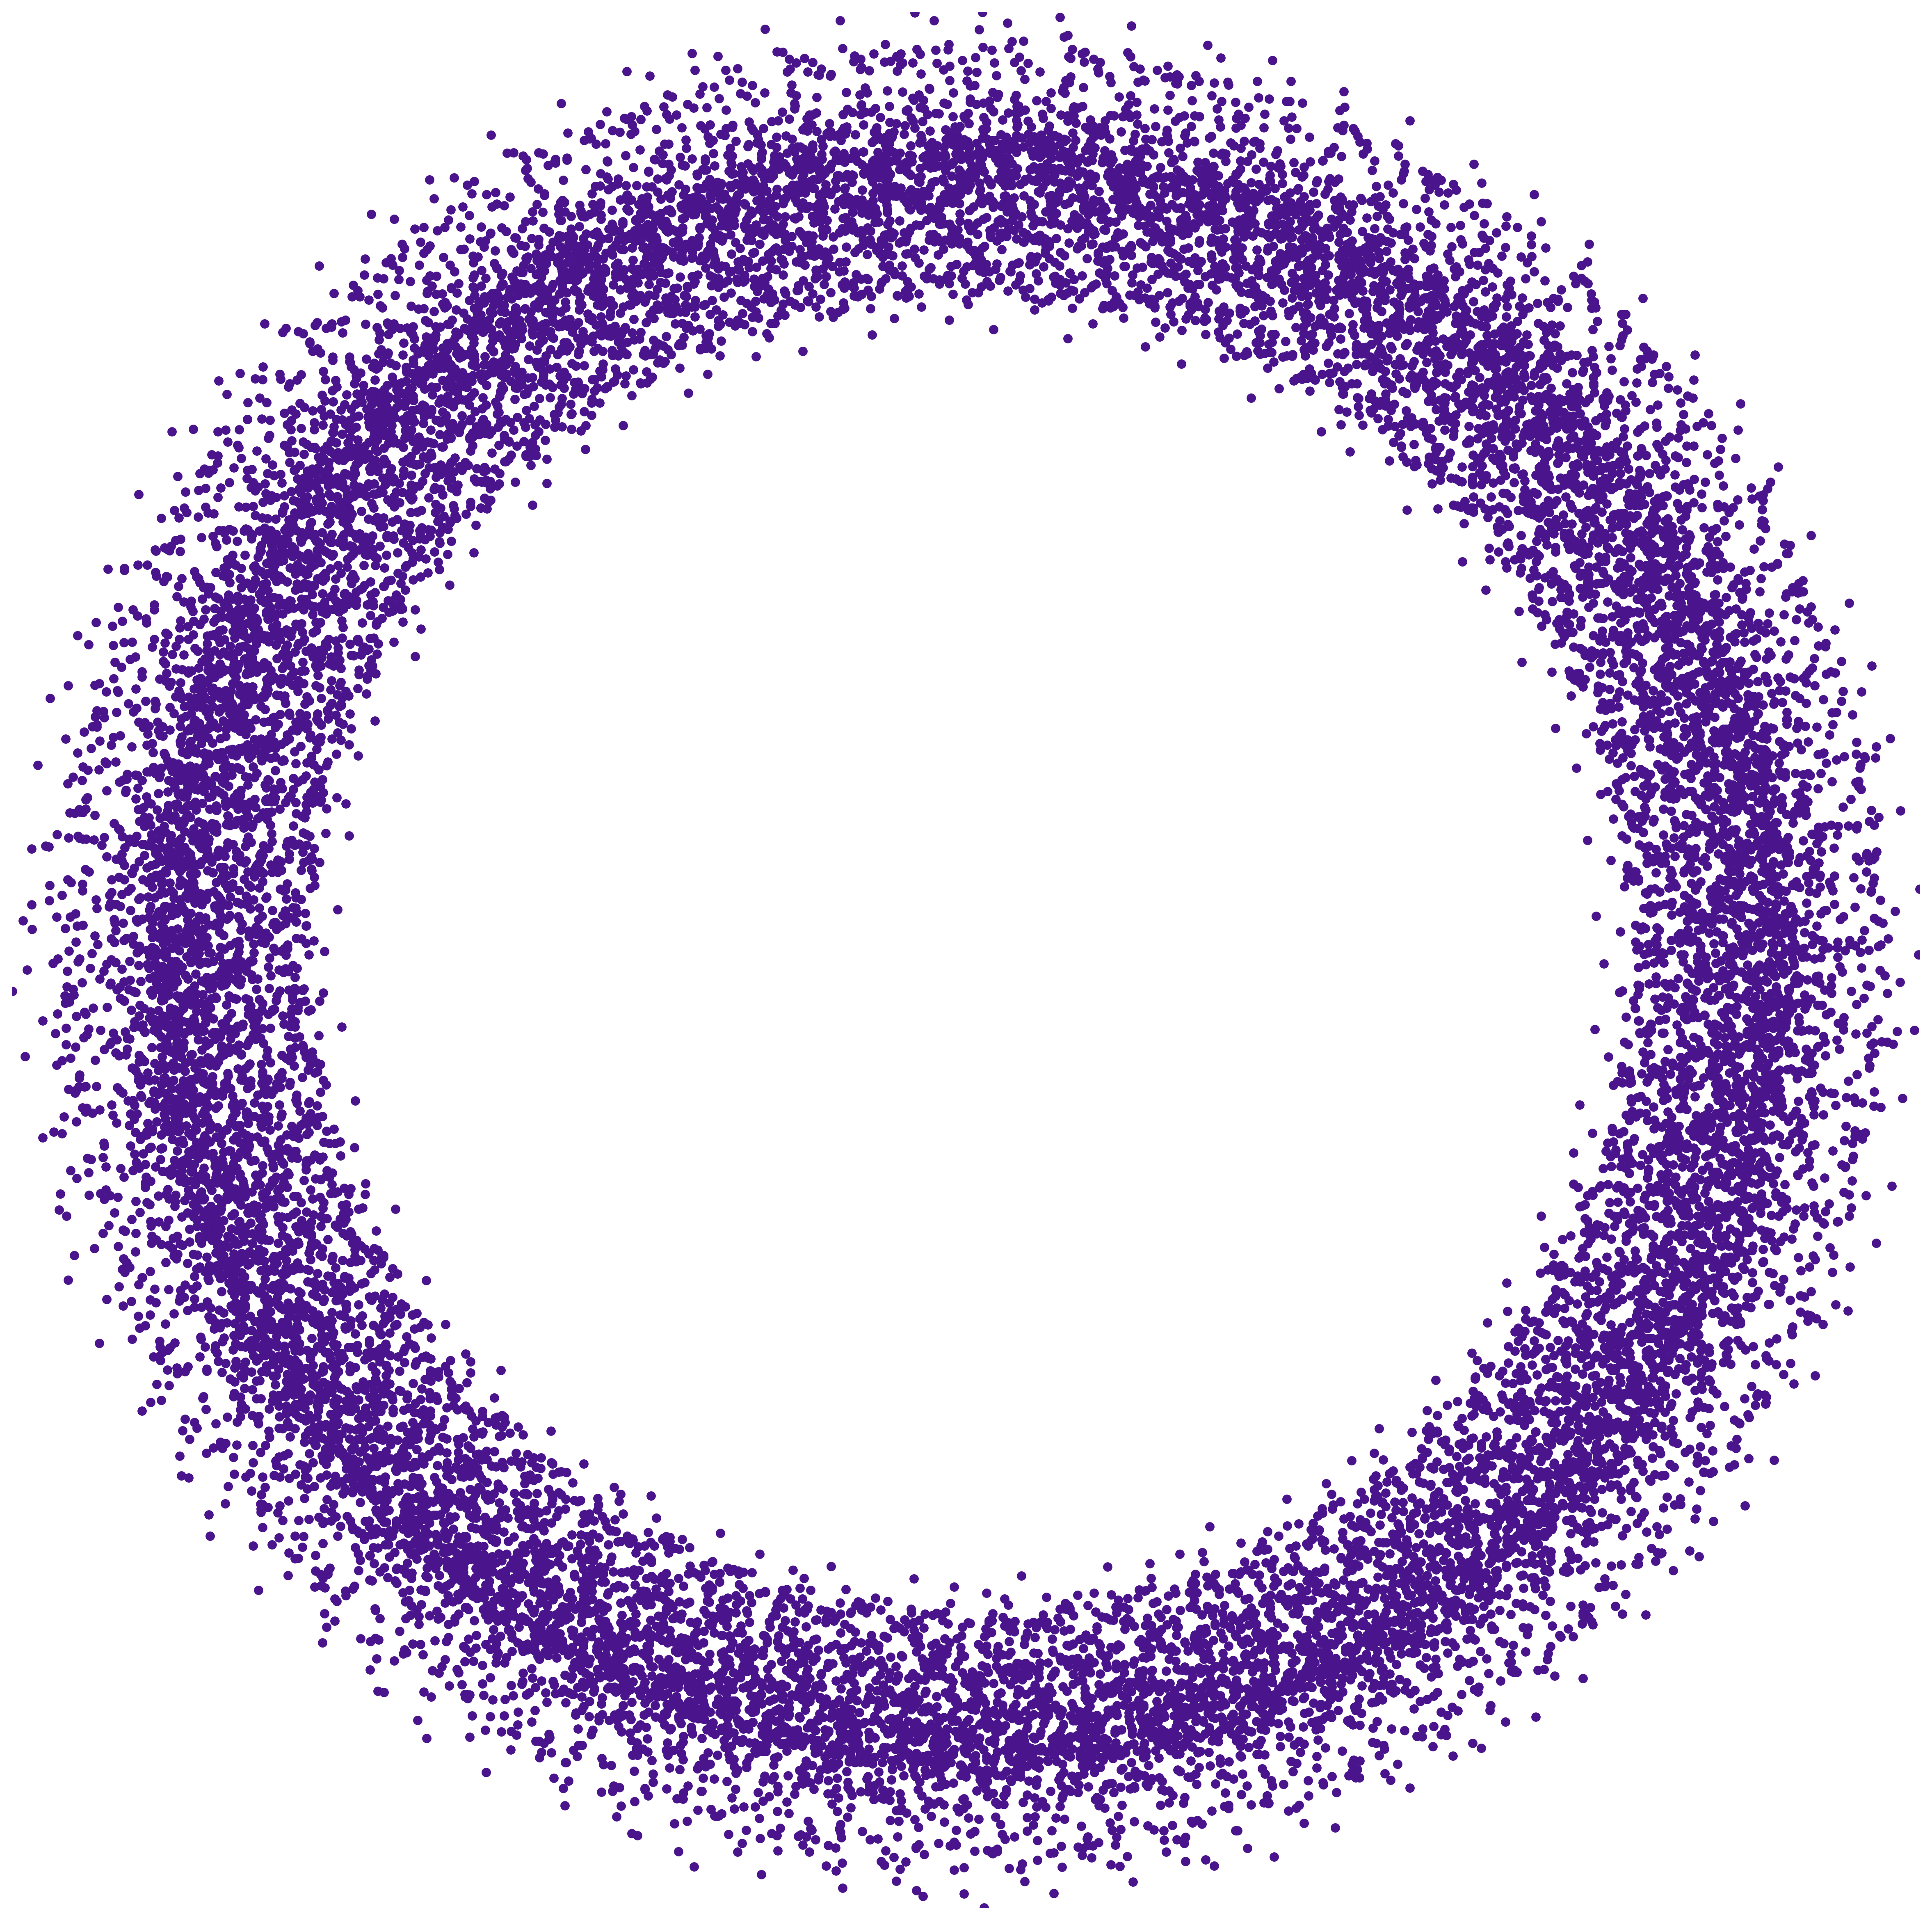
Noise is not exciting ...
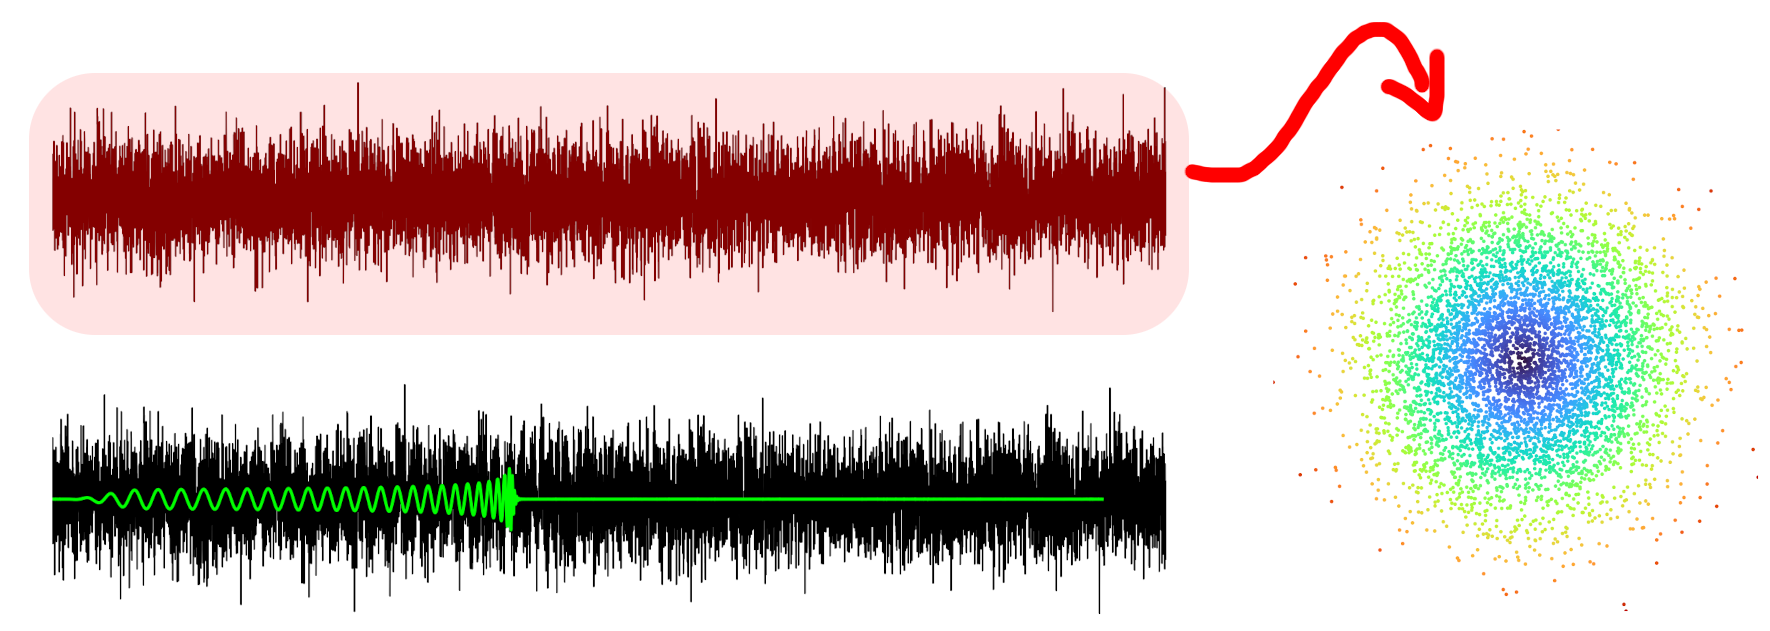
... but oscillations result in circles!
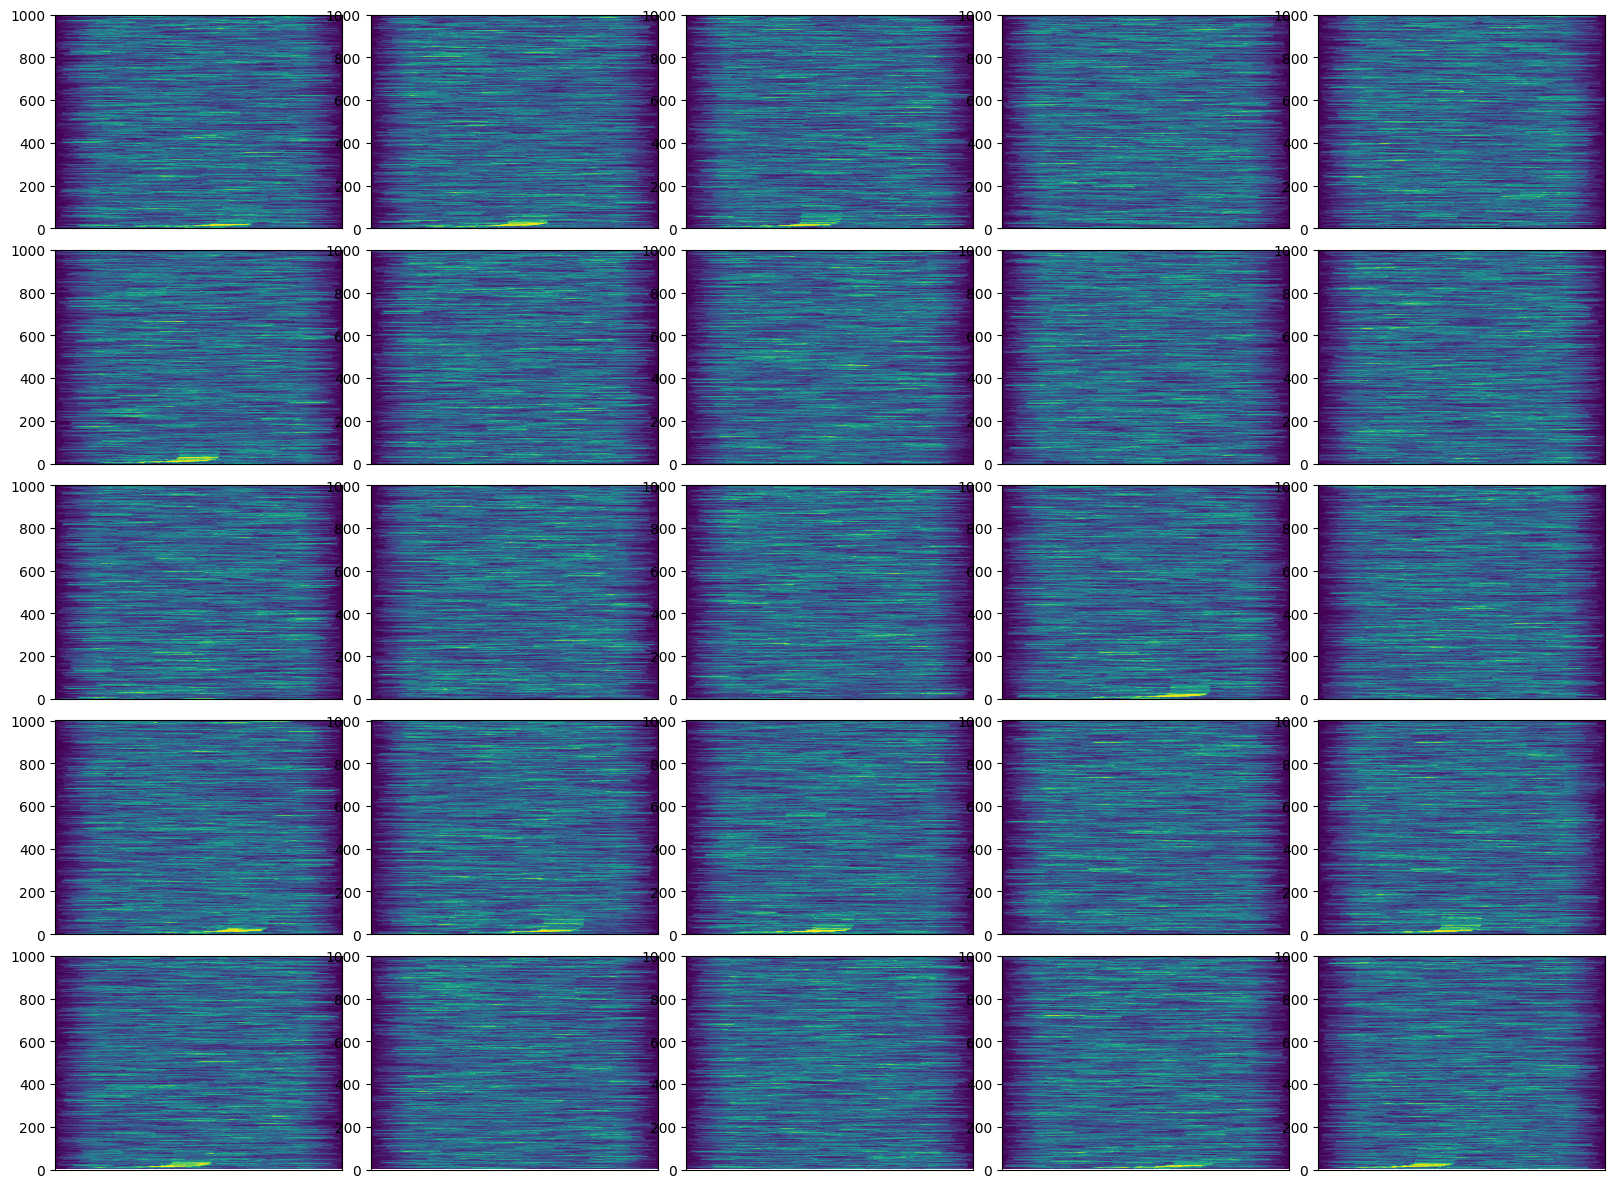
Yes, this is also detectable with spectrograms, but ...
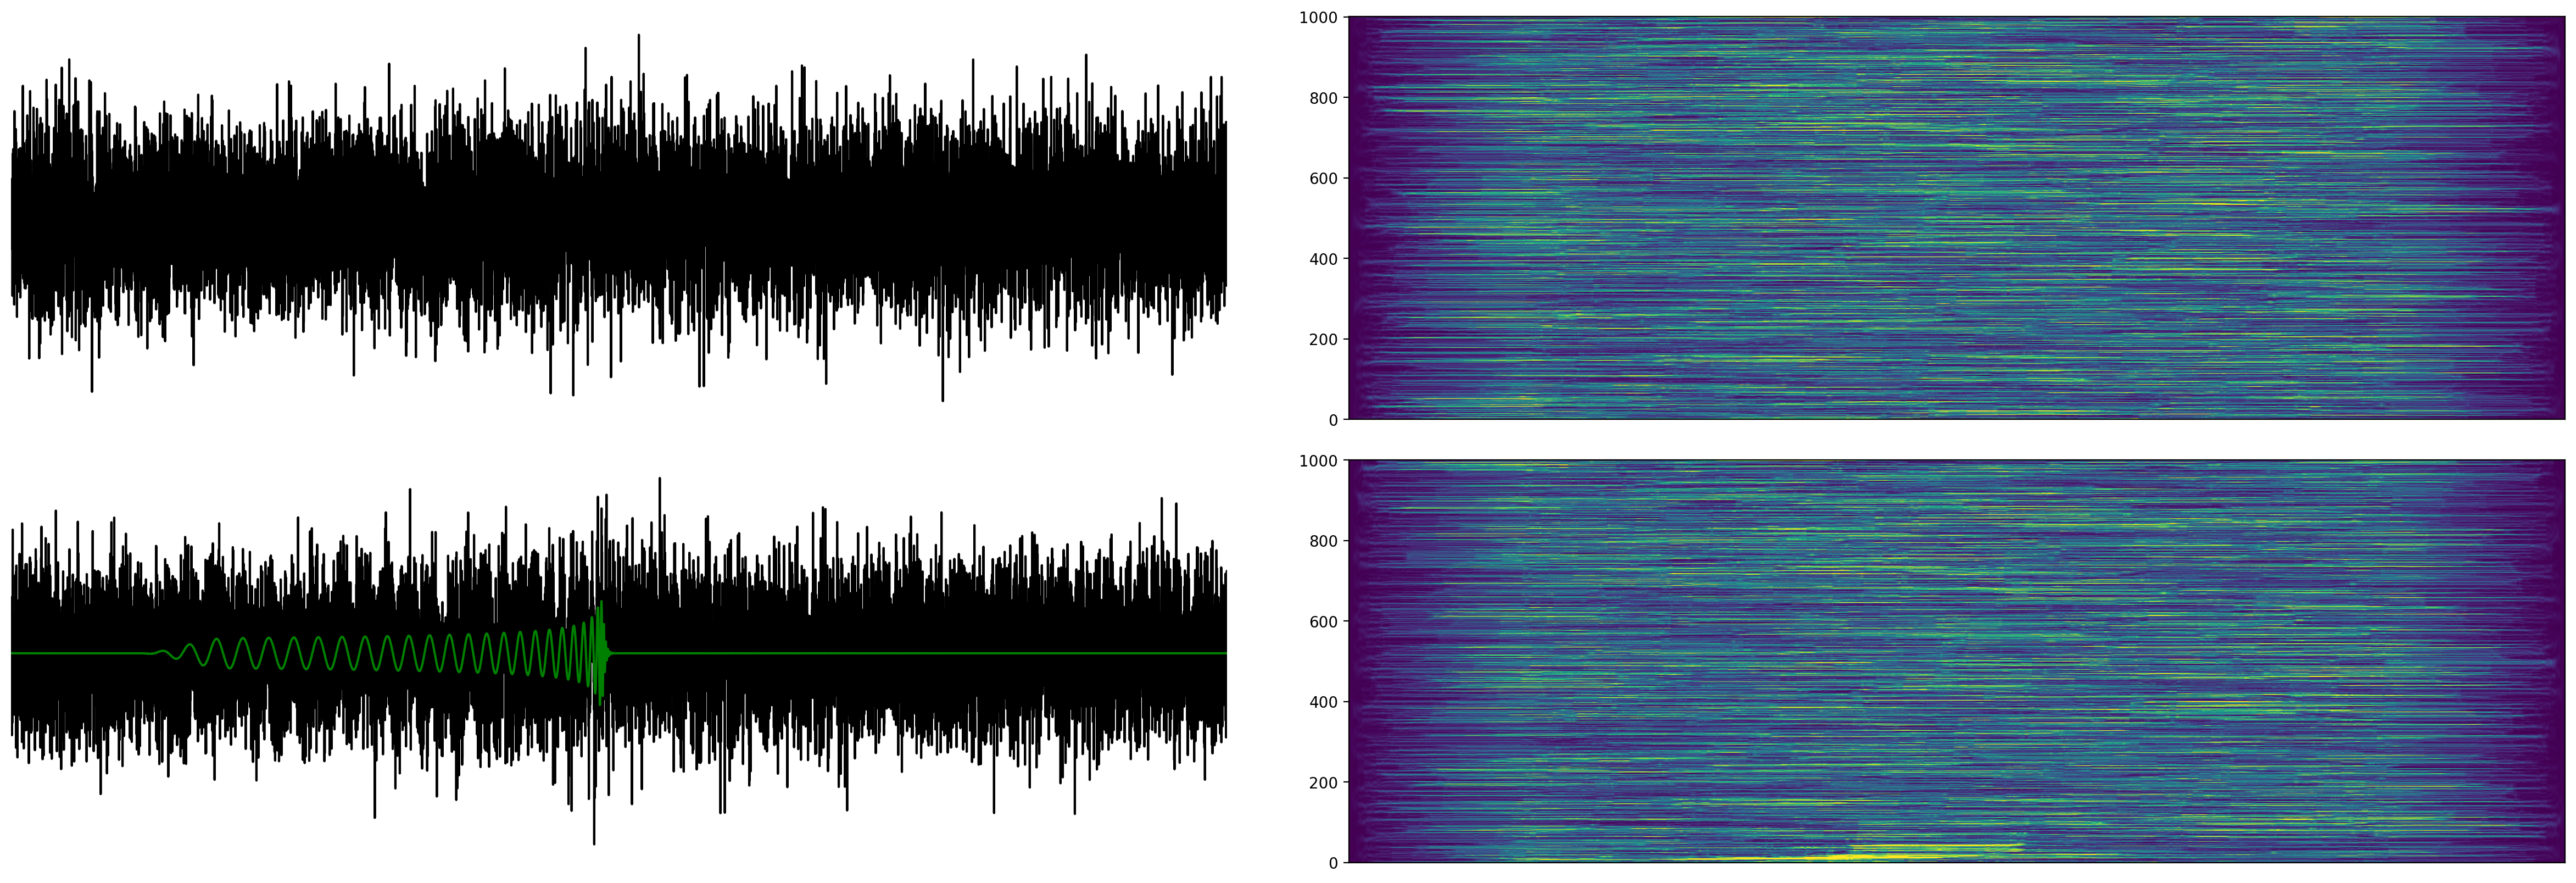
... the TDE is suitable to gain an overview!
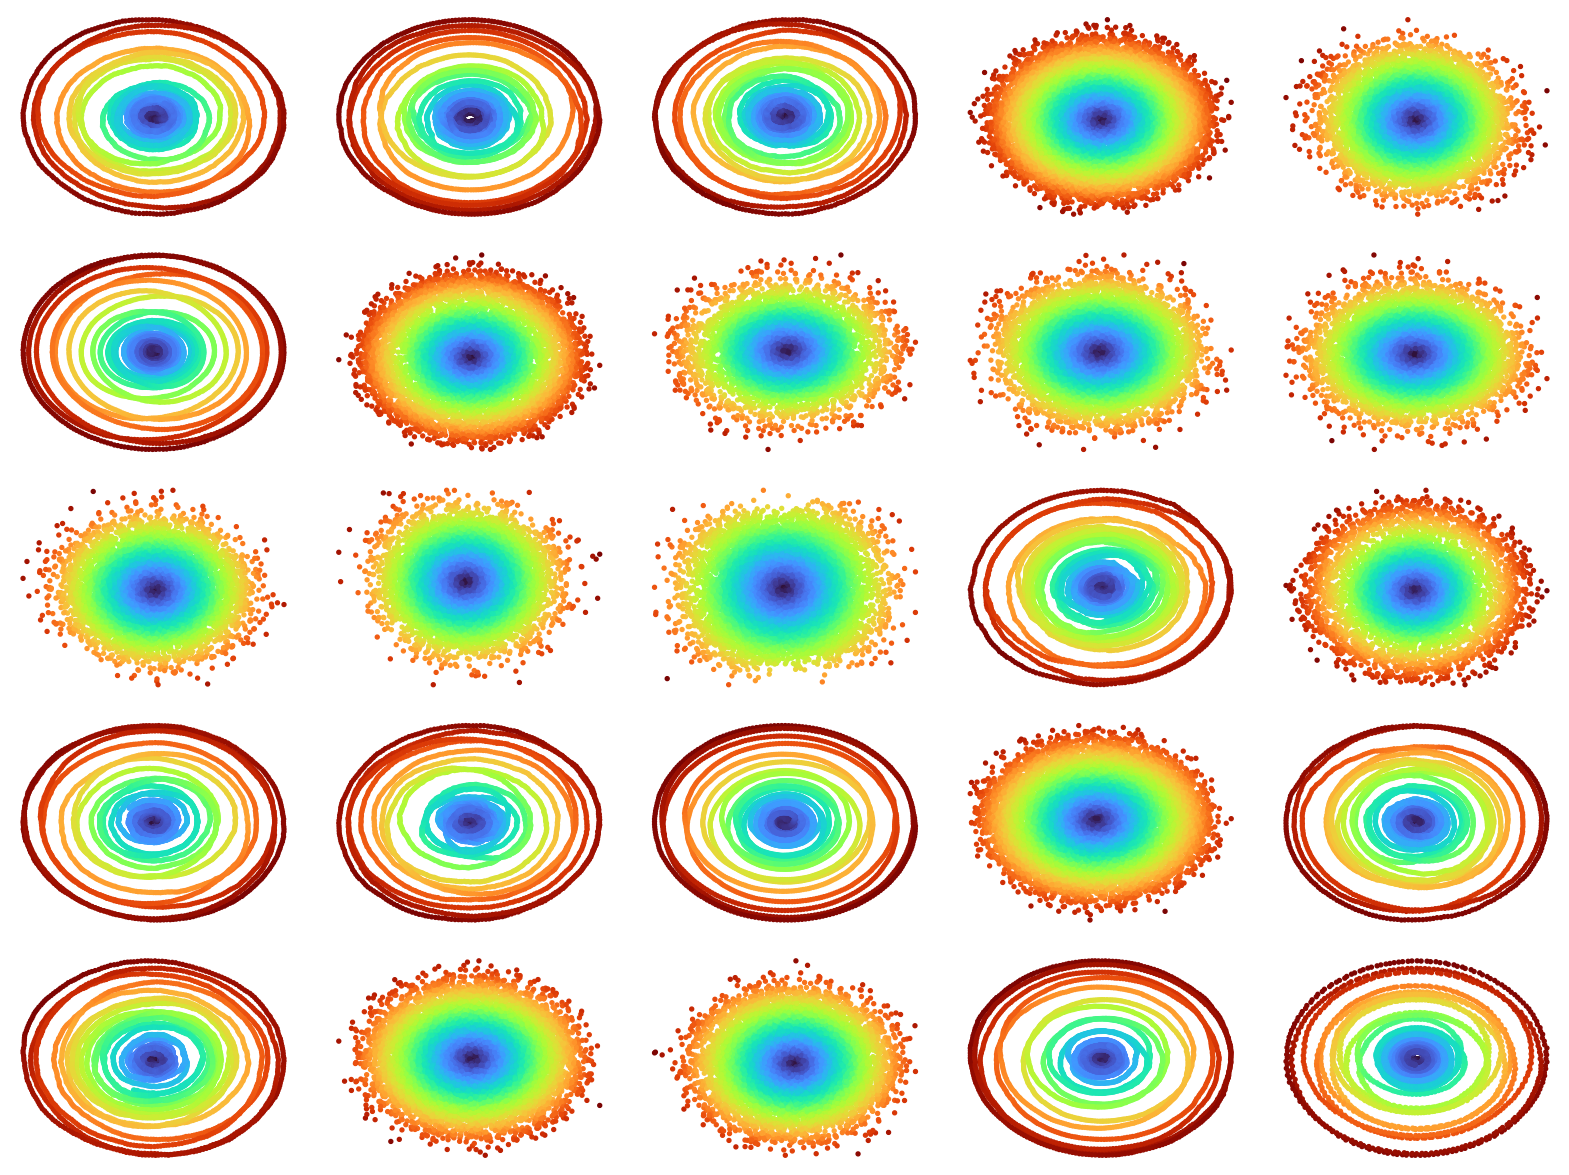
Observing Wear
Published at EuroVis
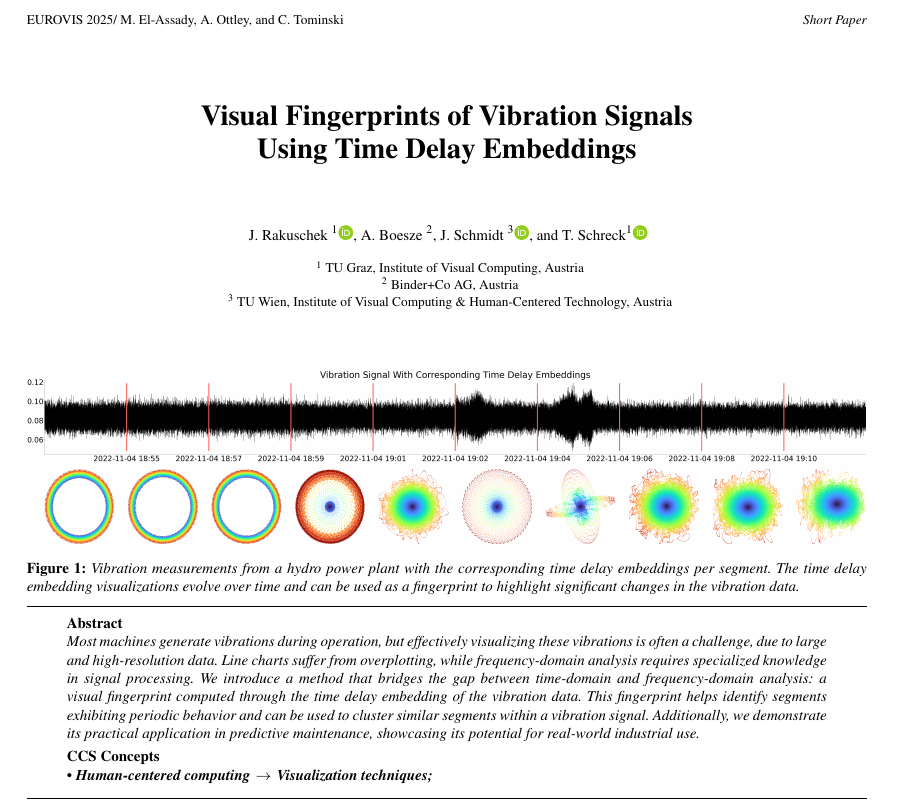

Analyzing Large Vibration Signals
Visualizing Periodic
Time Series
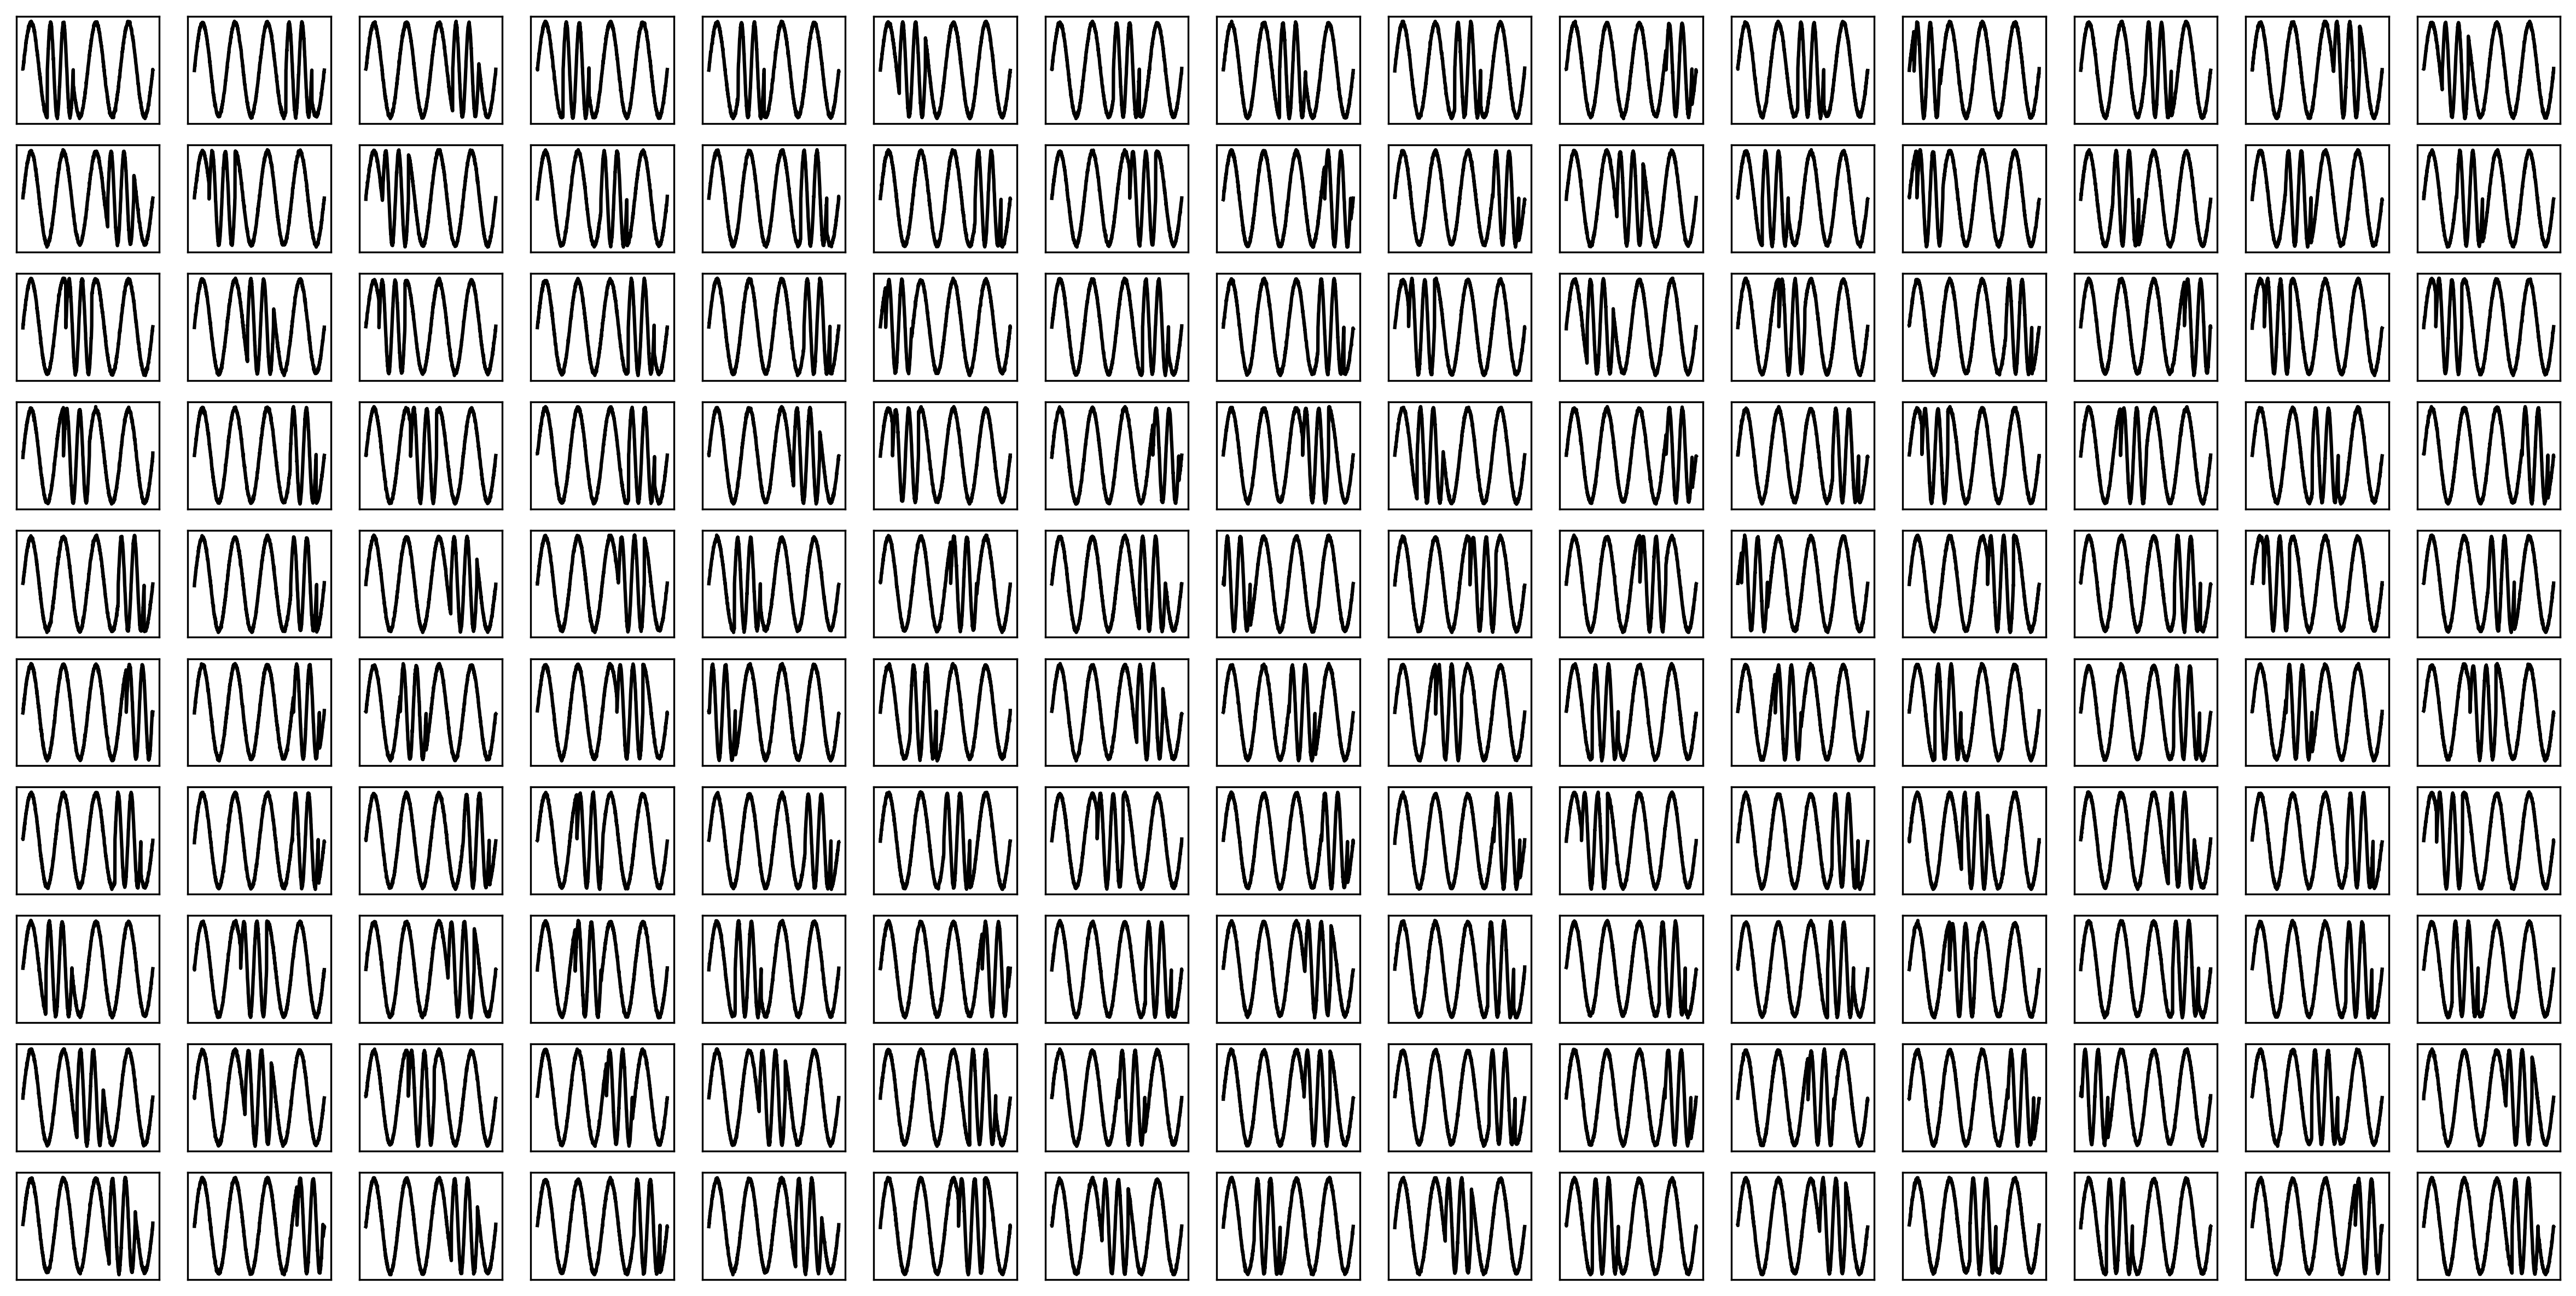
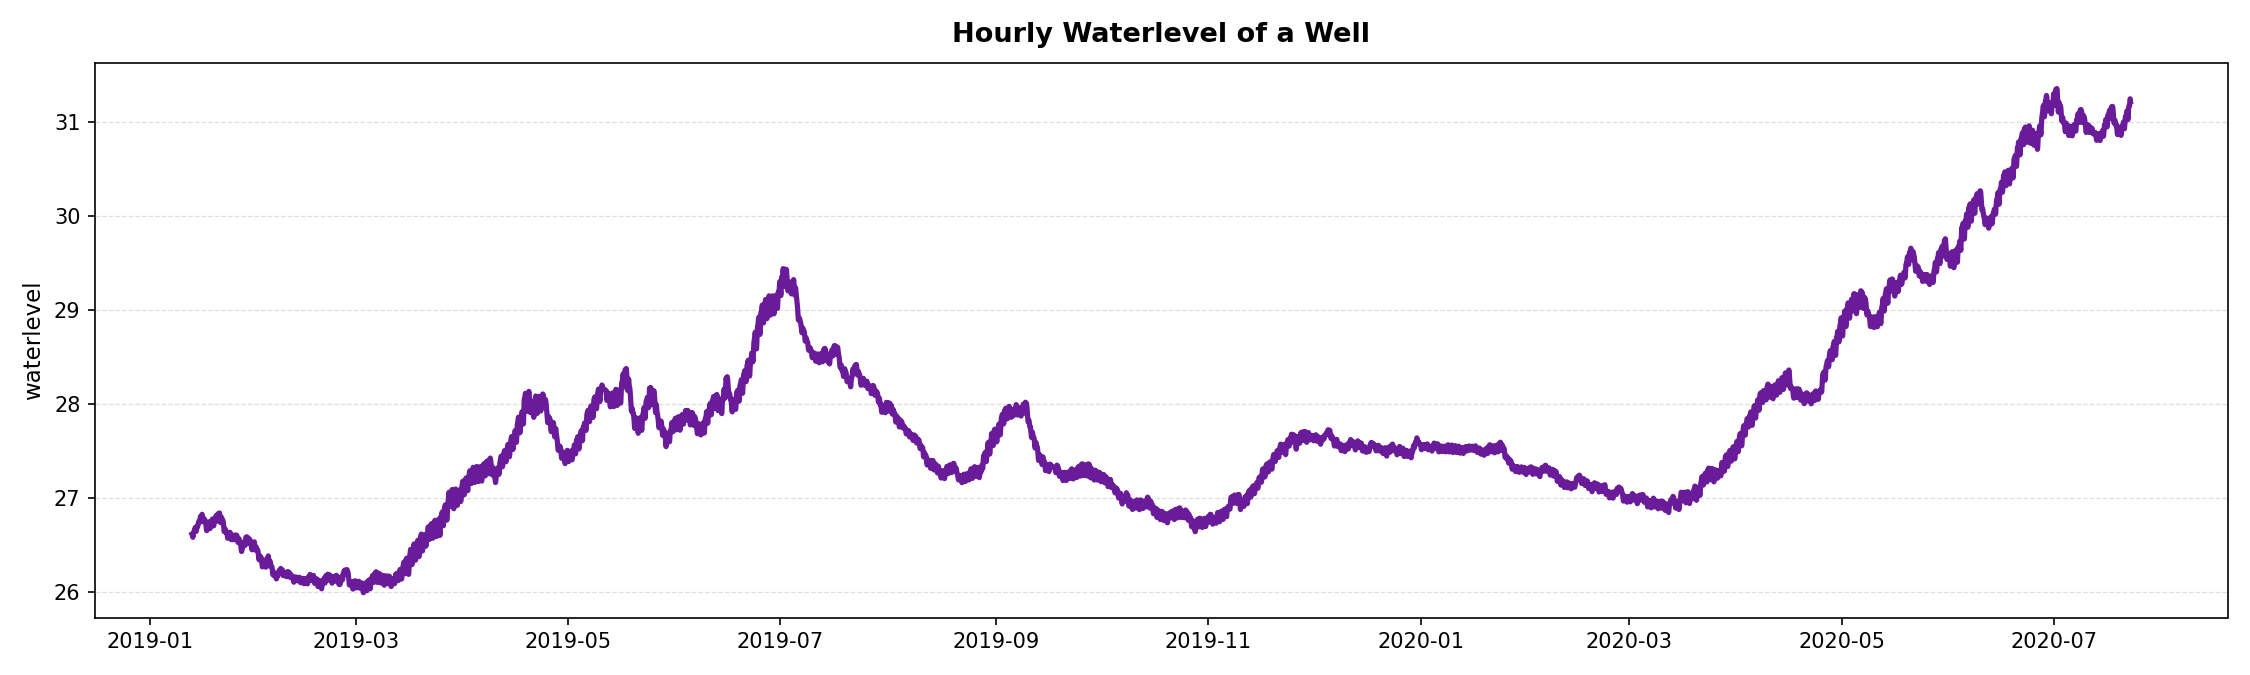
Periodic Time Series
Segment by Year
We want to compare each springtime
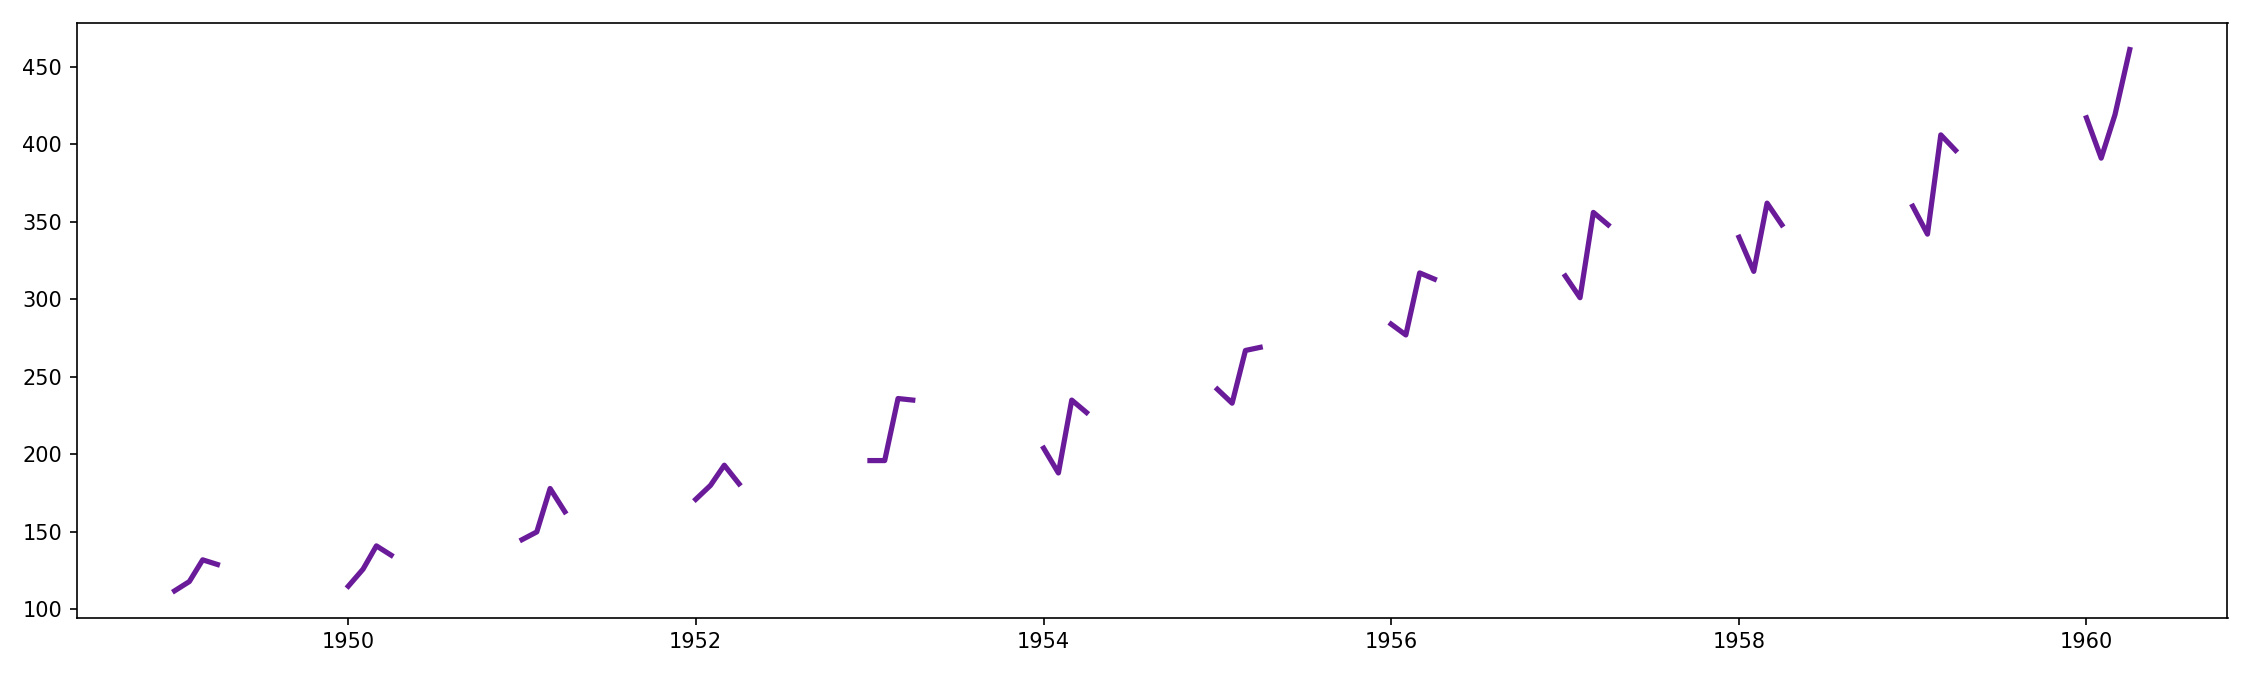
Result: Subsequences
Comparison via Superposition
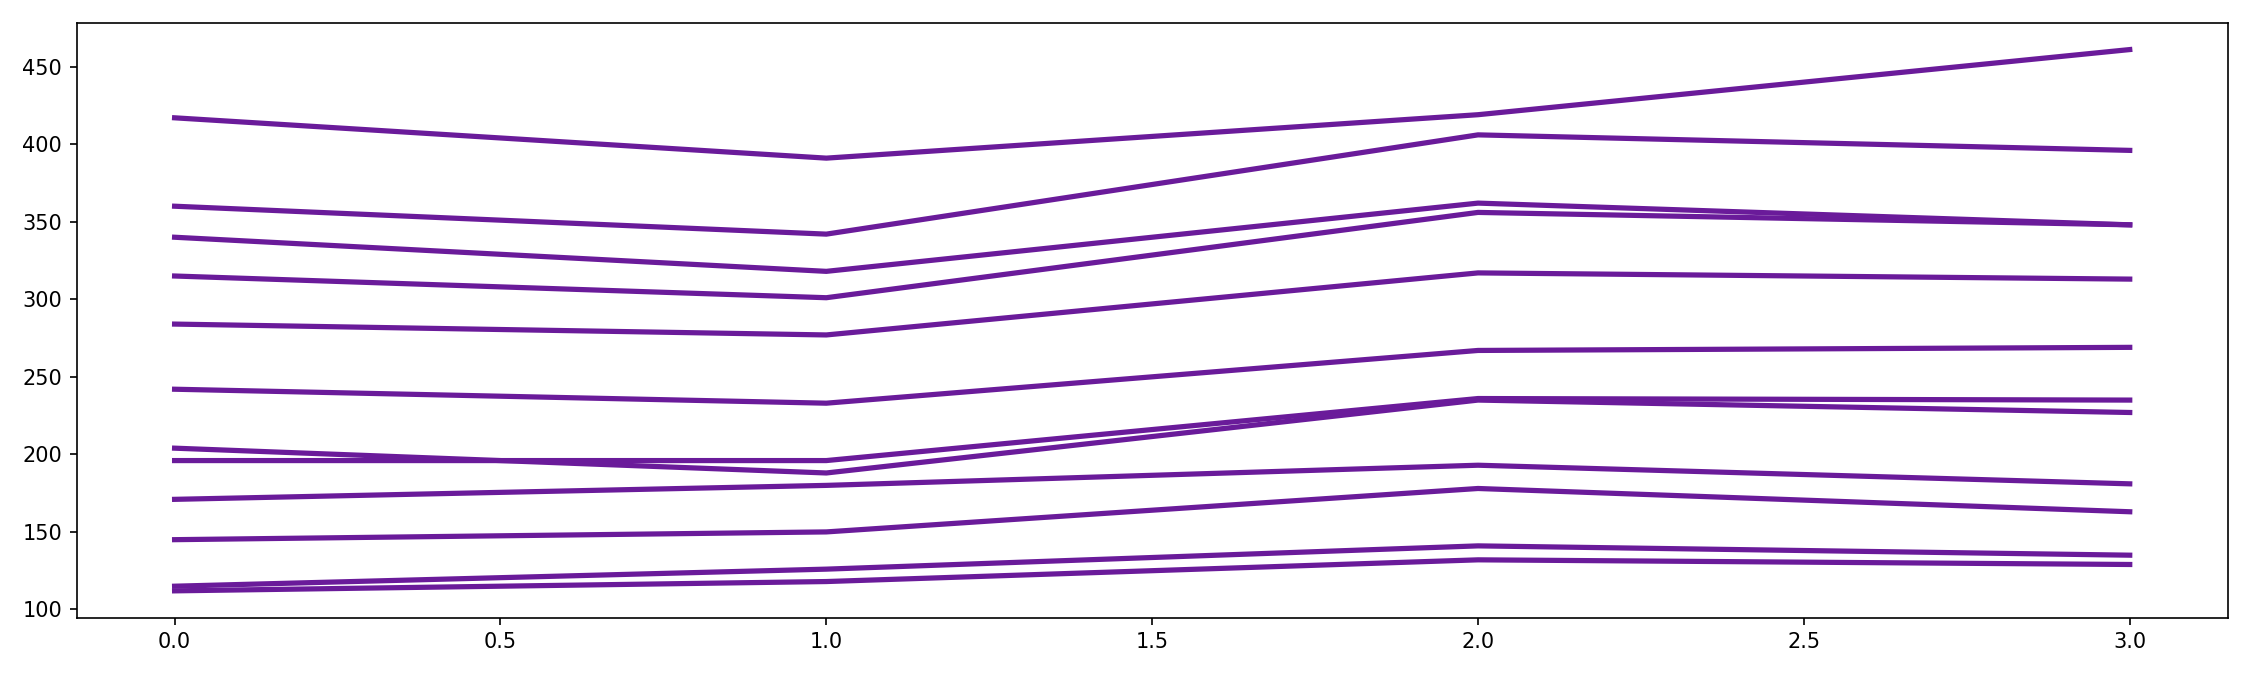
Can we do better?
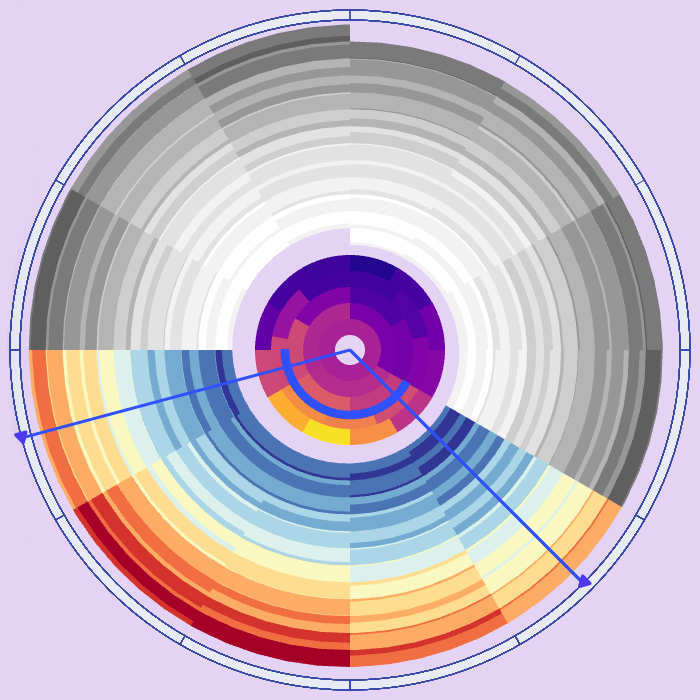
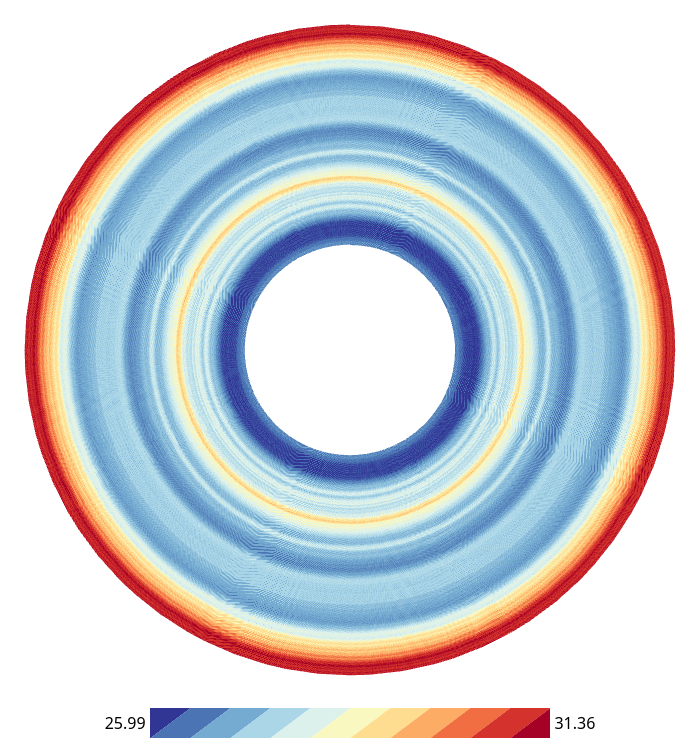
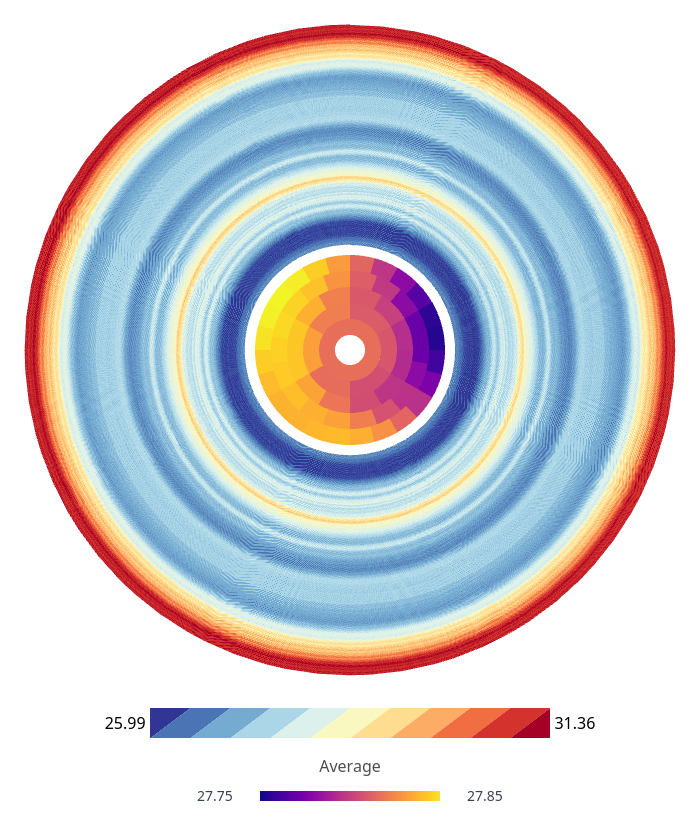
The Time Series Spiral
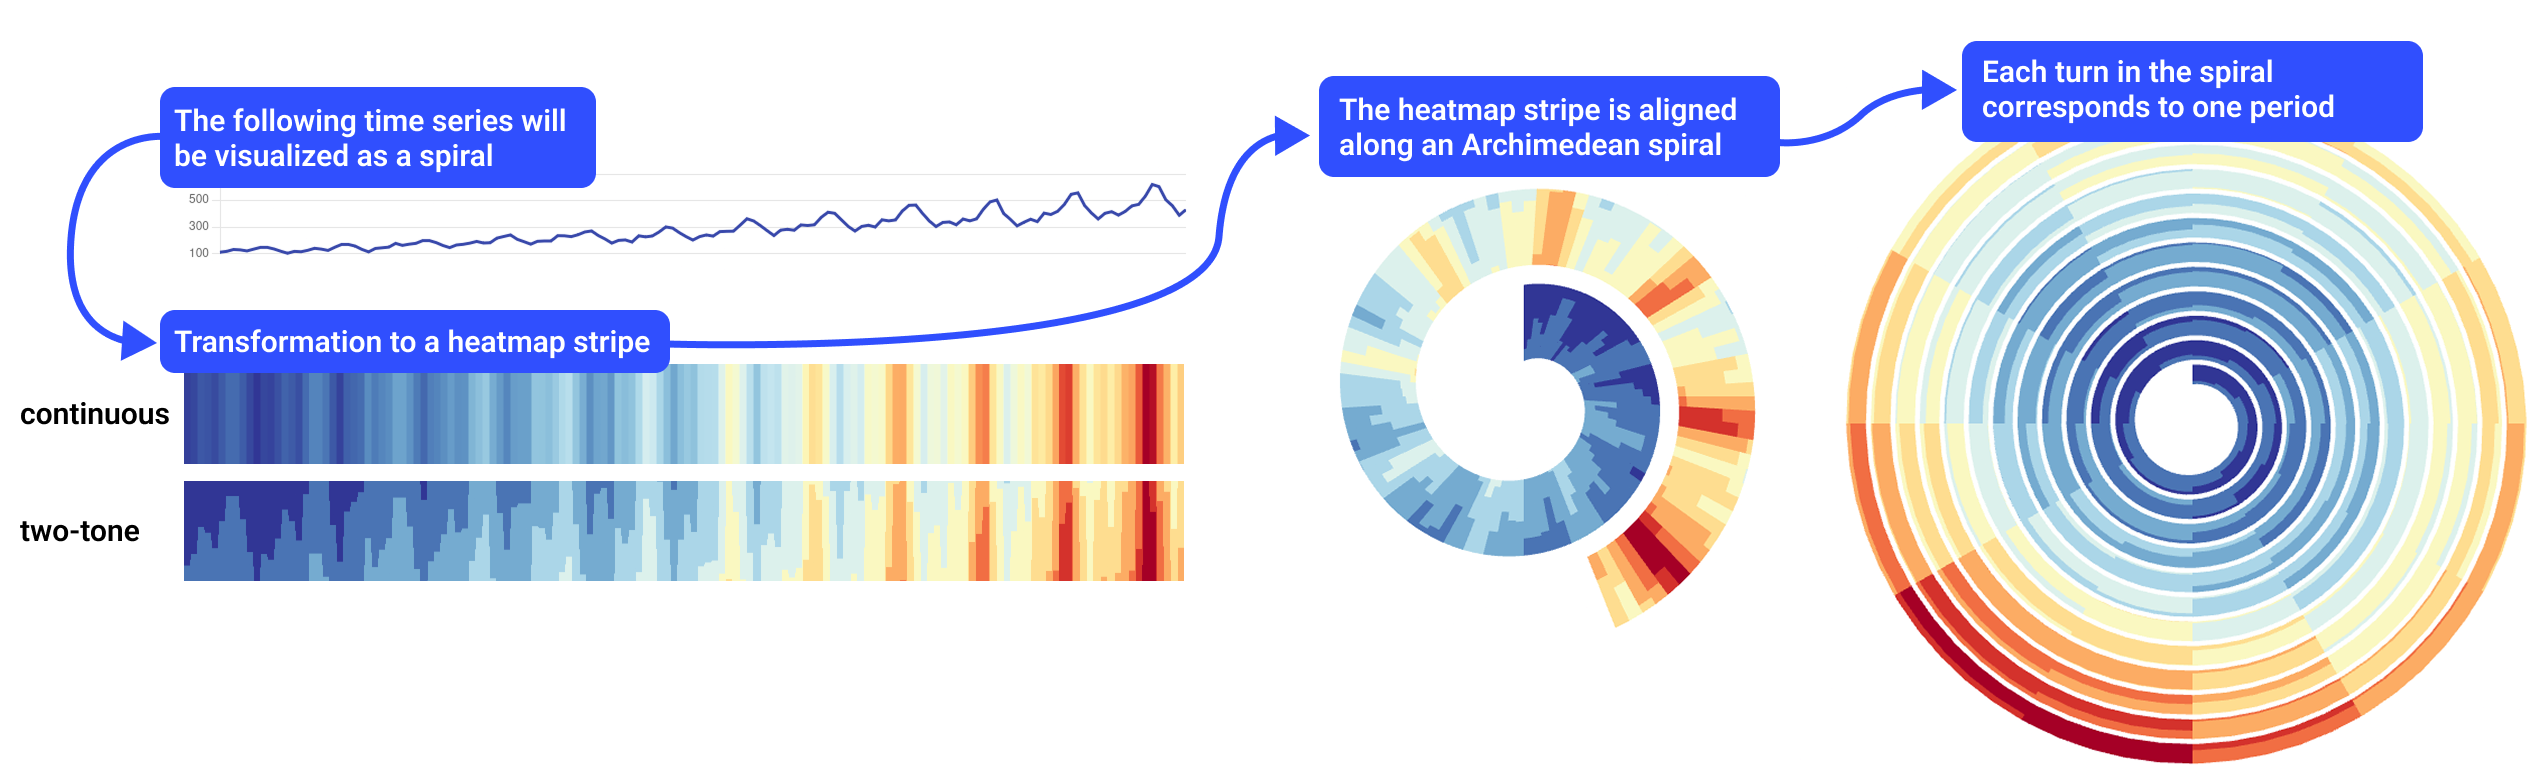
Complex Time Series are challenging!
No differences in sectors visible.
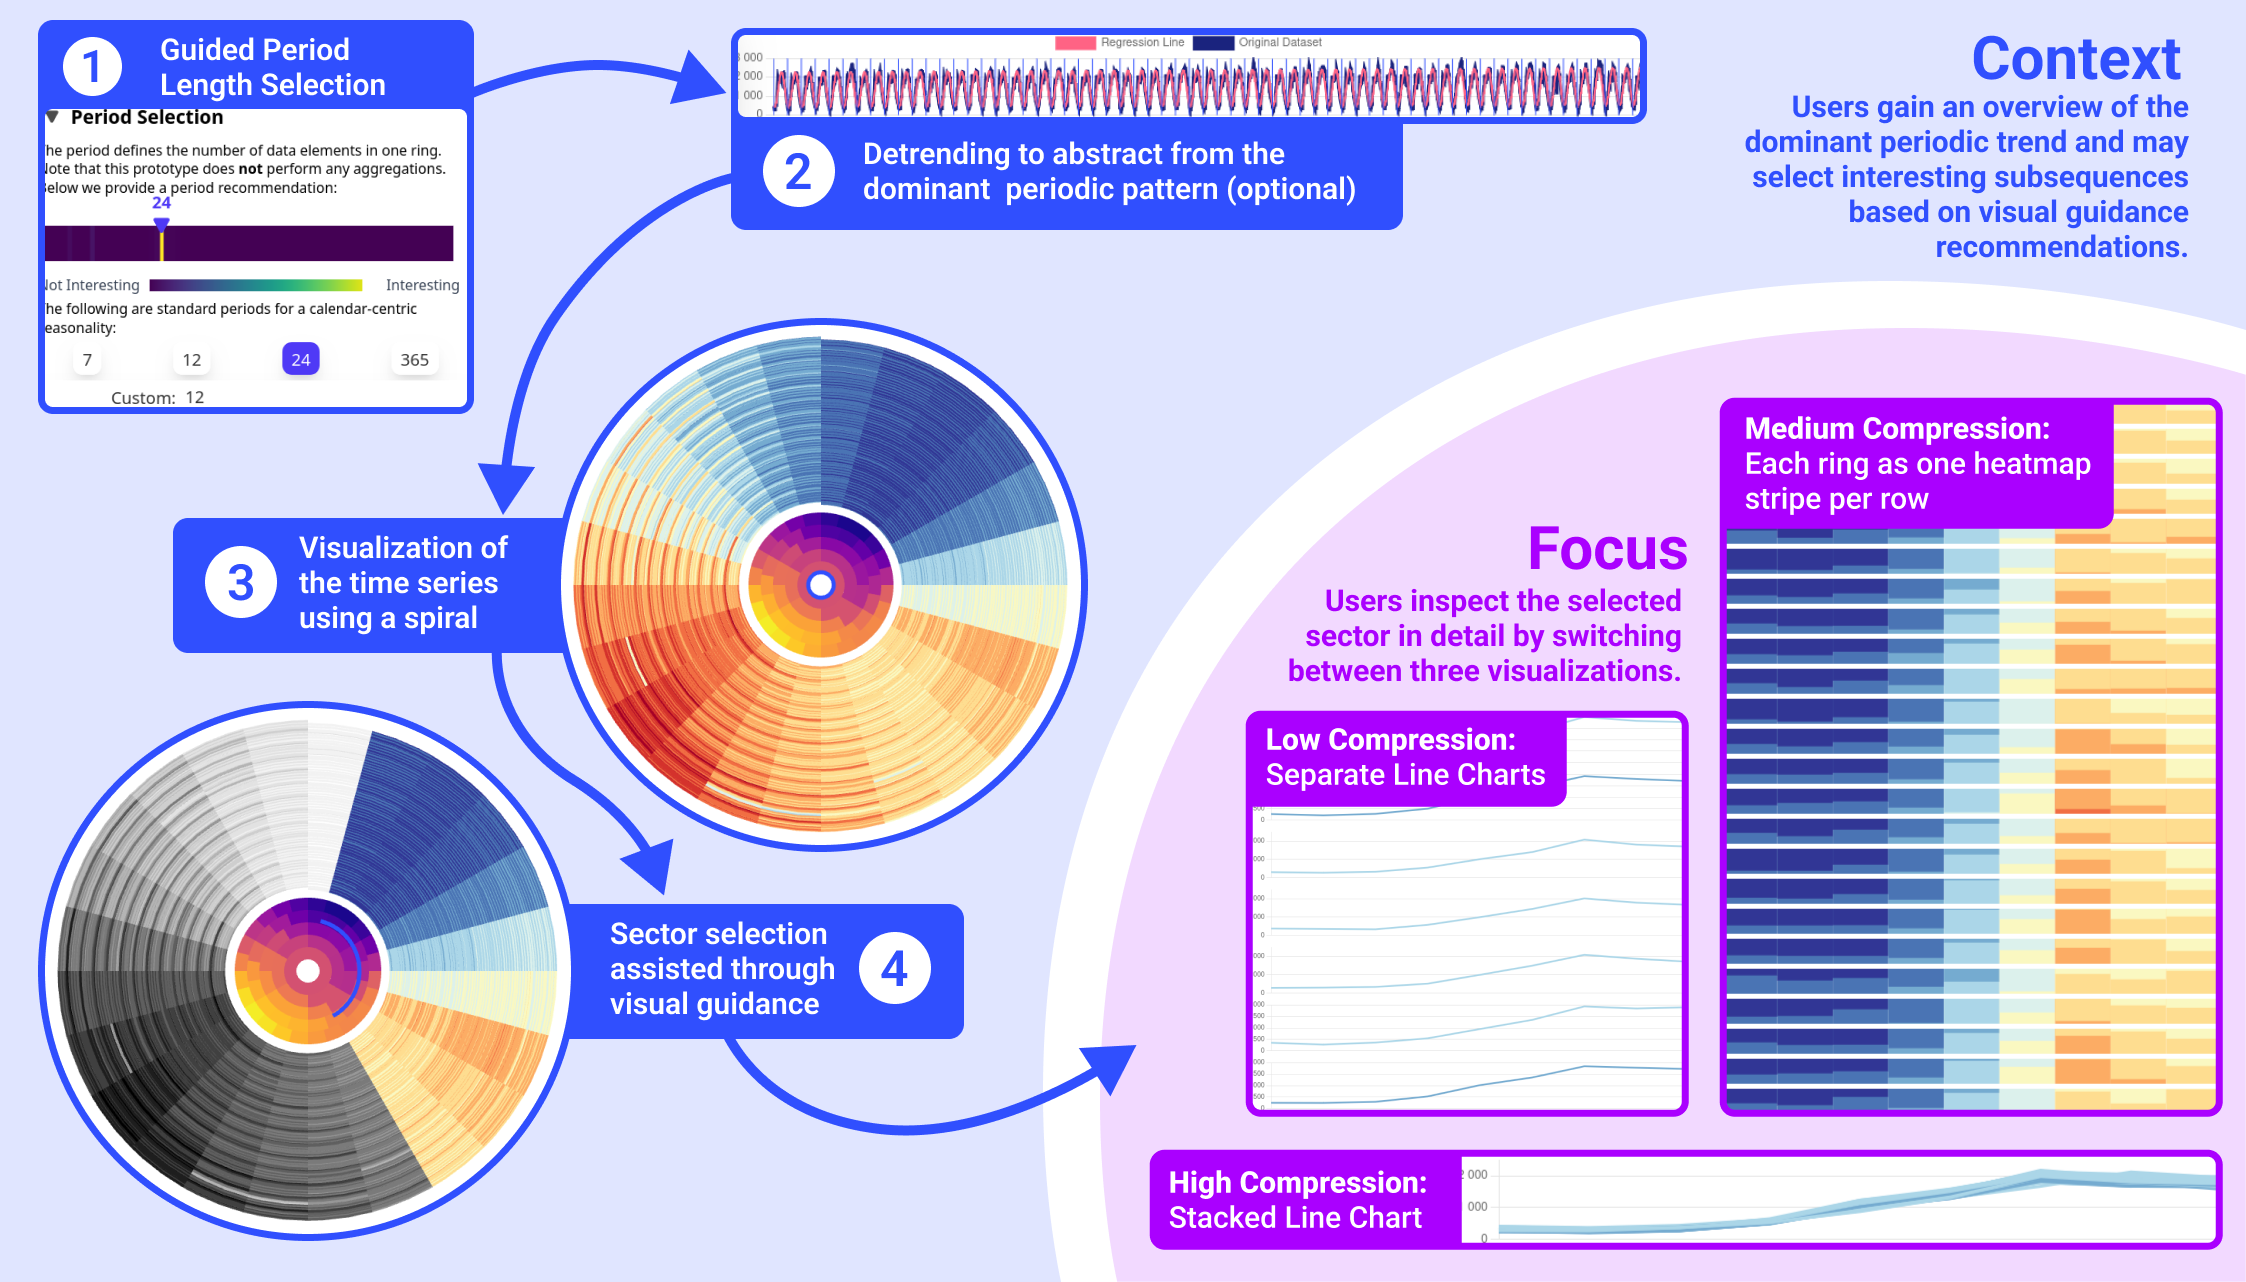
Visual Guidance can help
We need to navigate through a foggy data swamp.
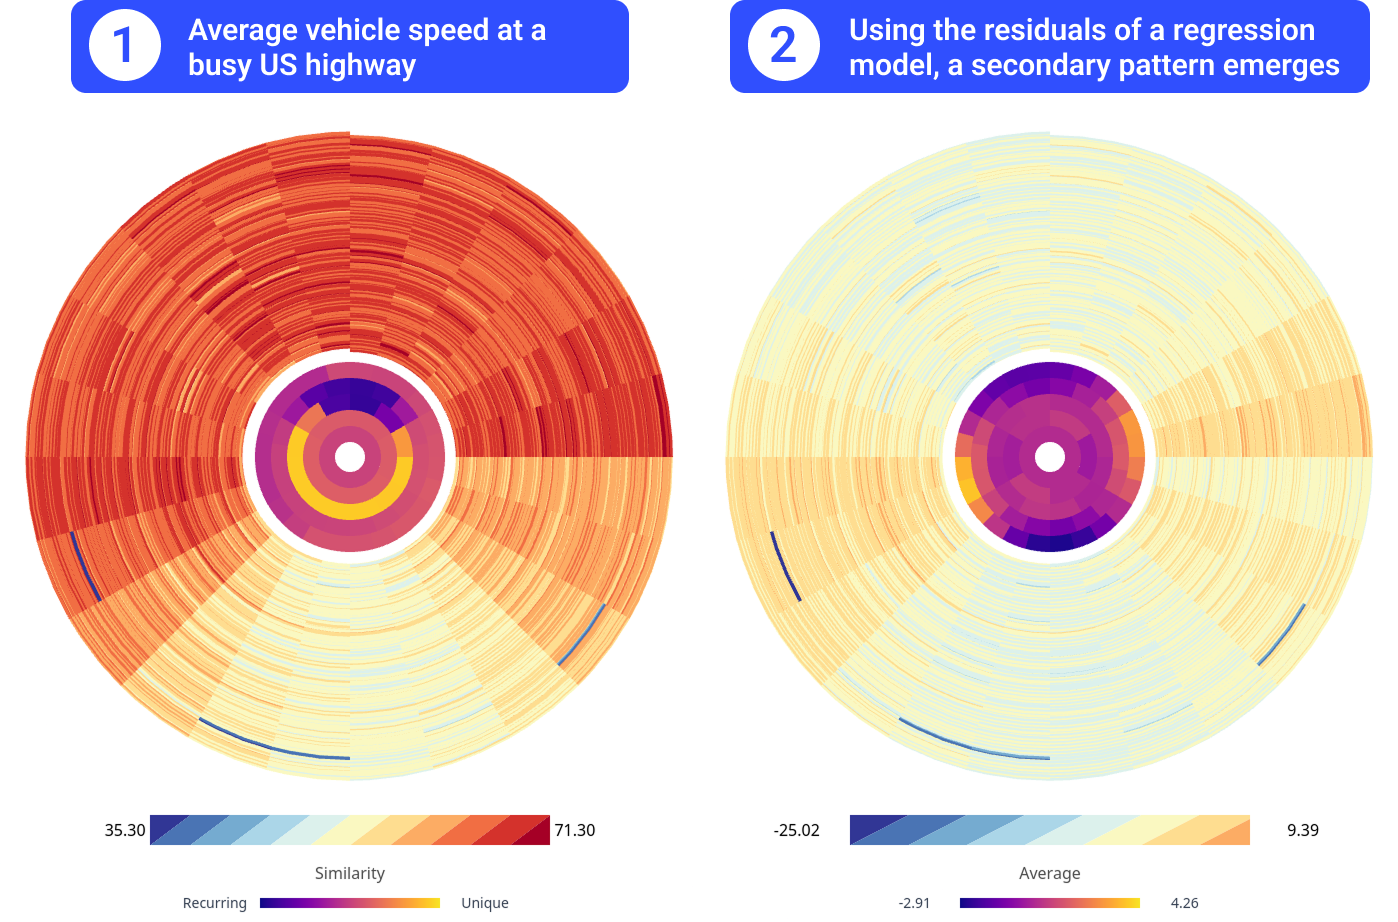
Average Guidance
Our Prototype
Another Example: Traffic
Anomaly Detection
Anomalies in time series (Selection)
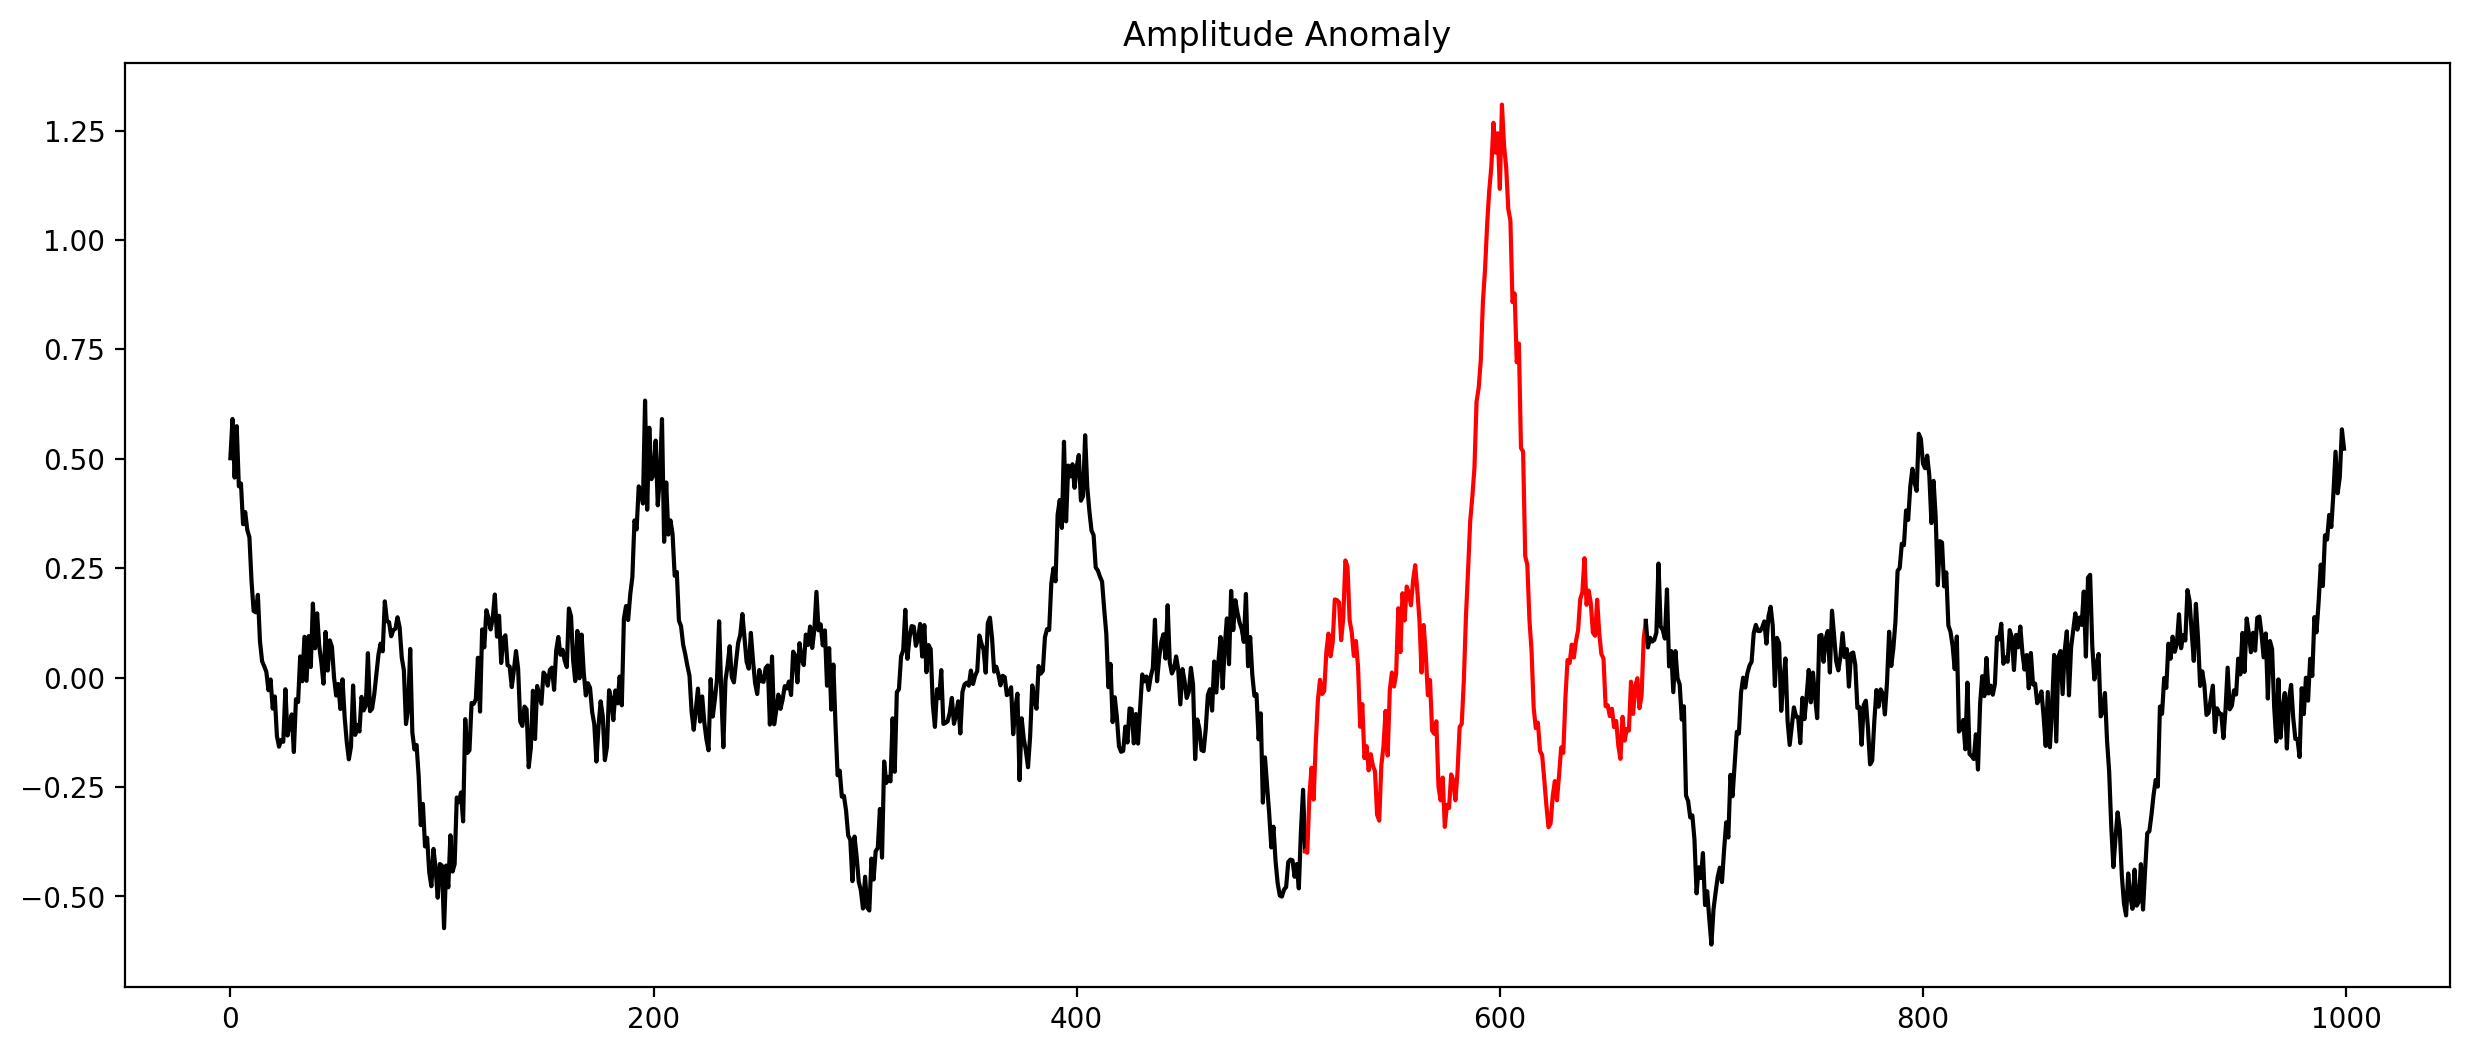
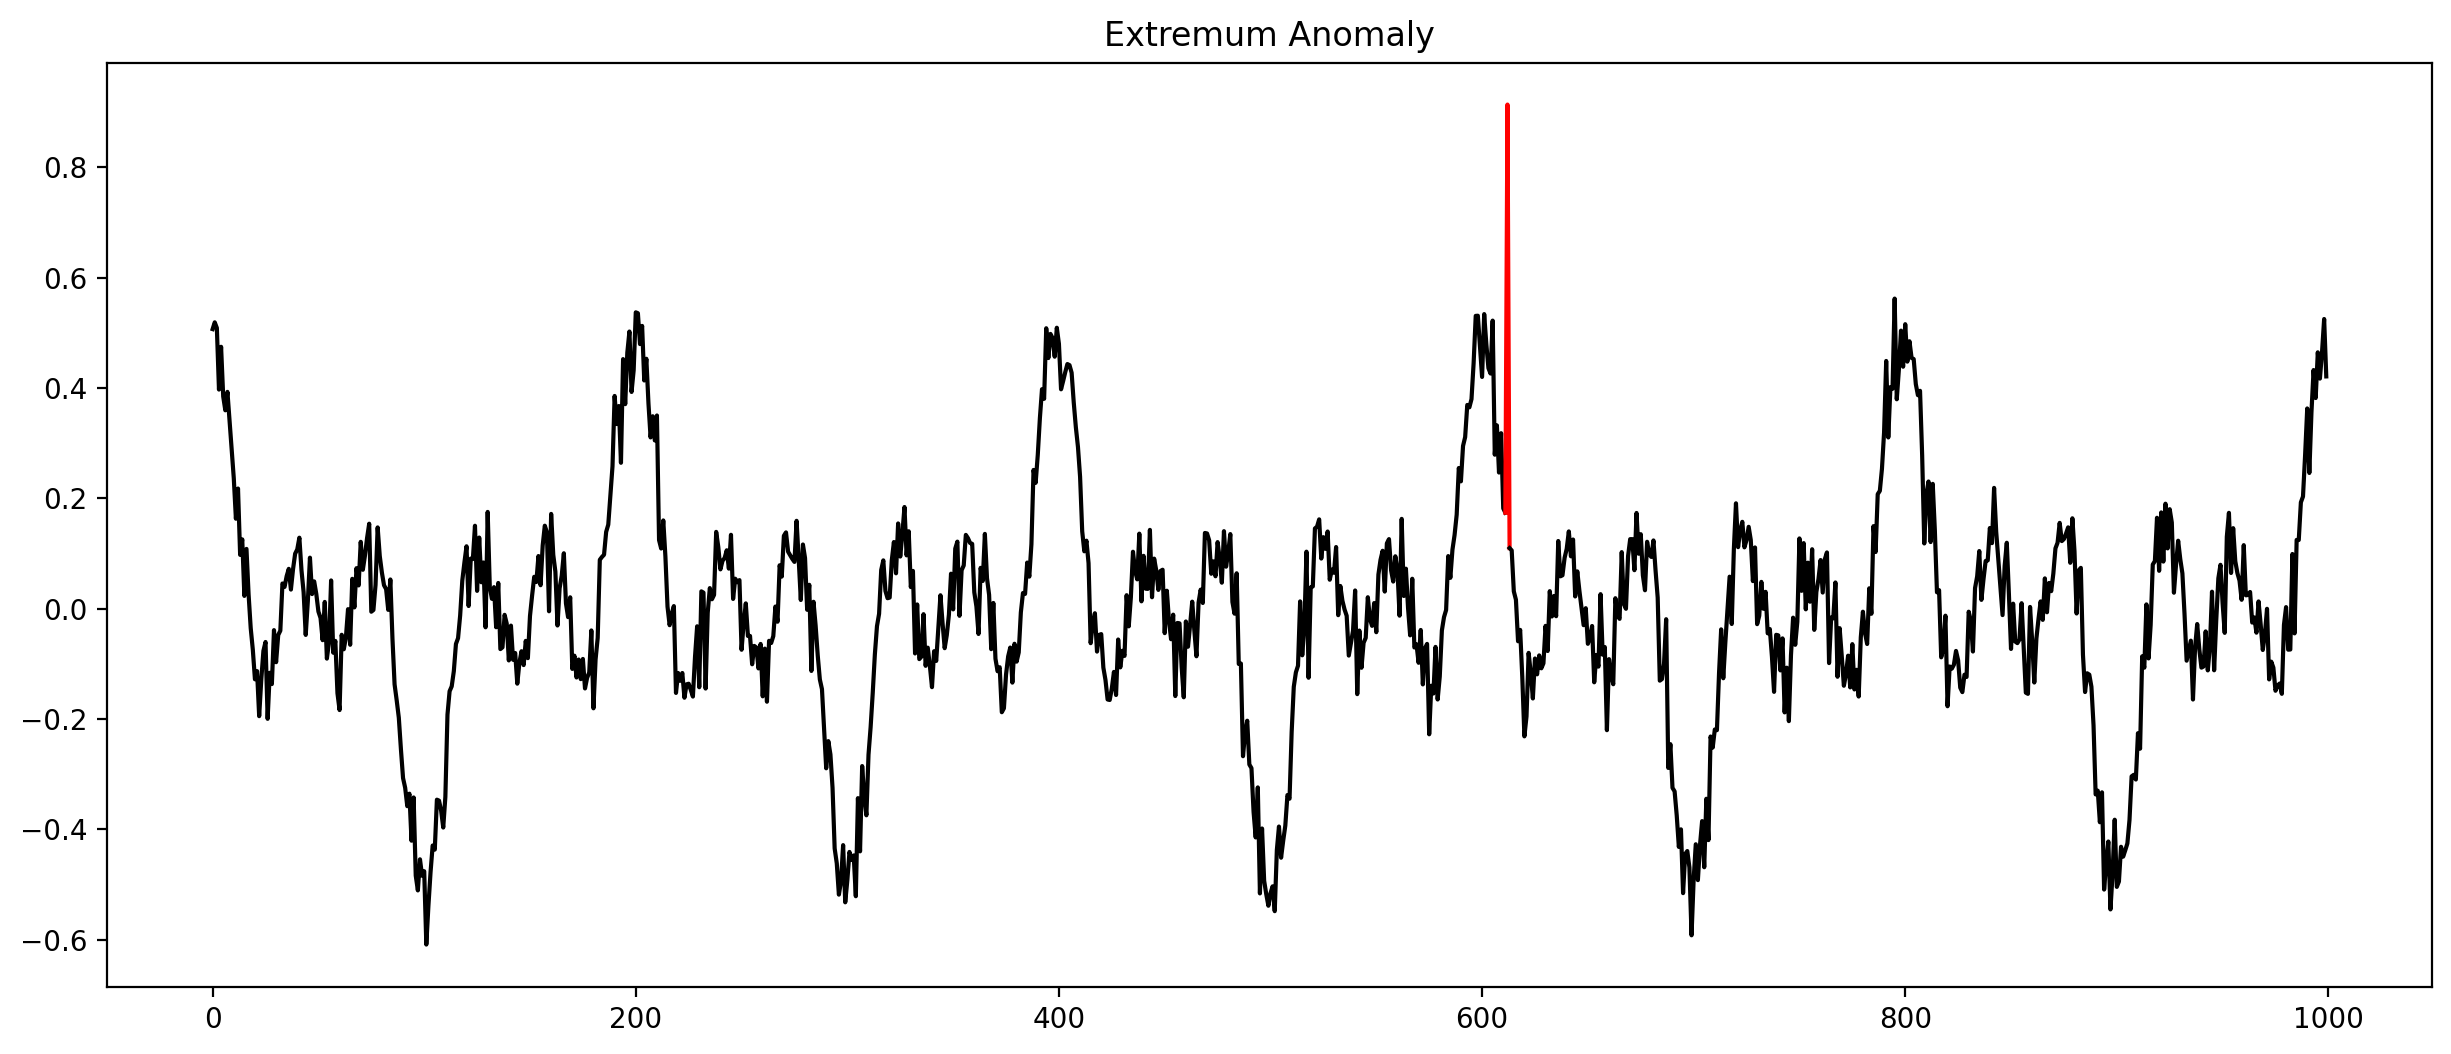
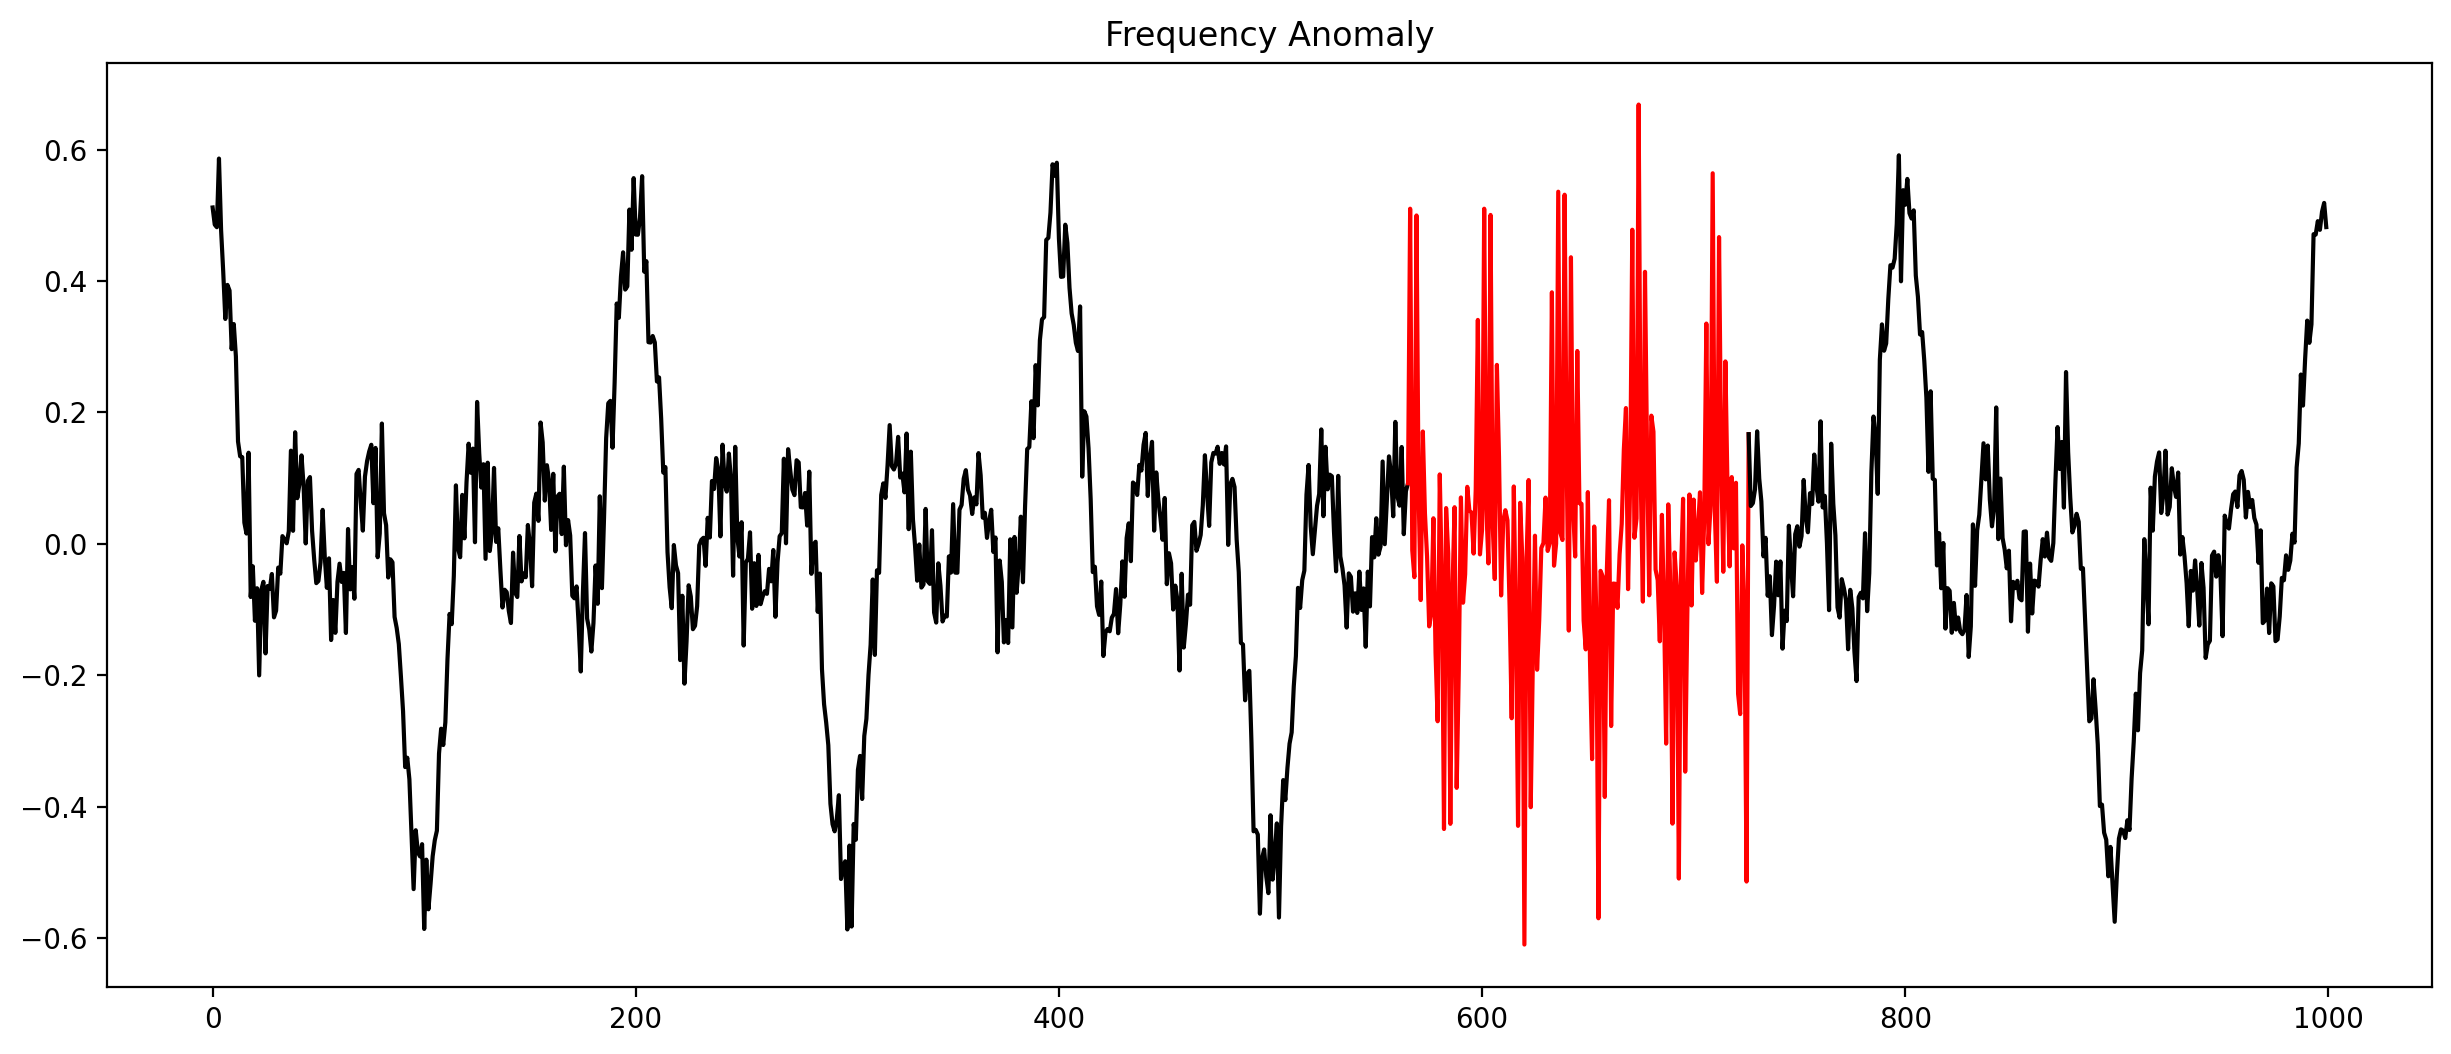
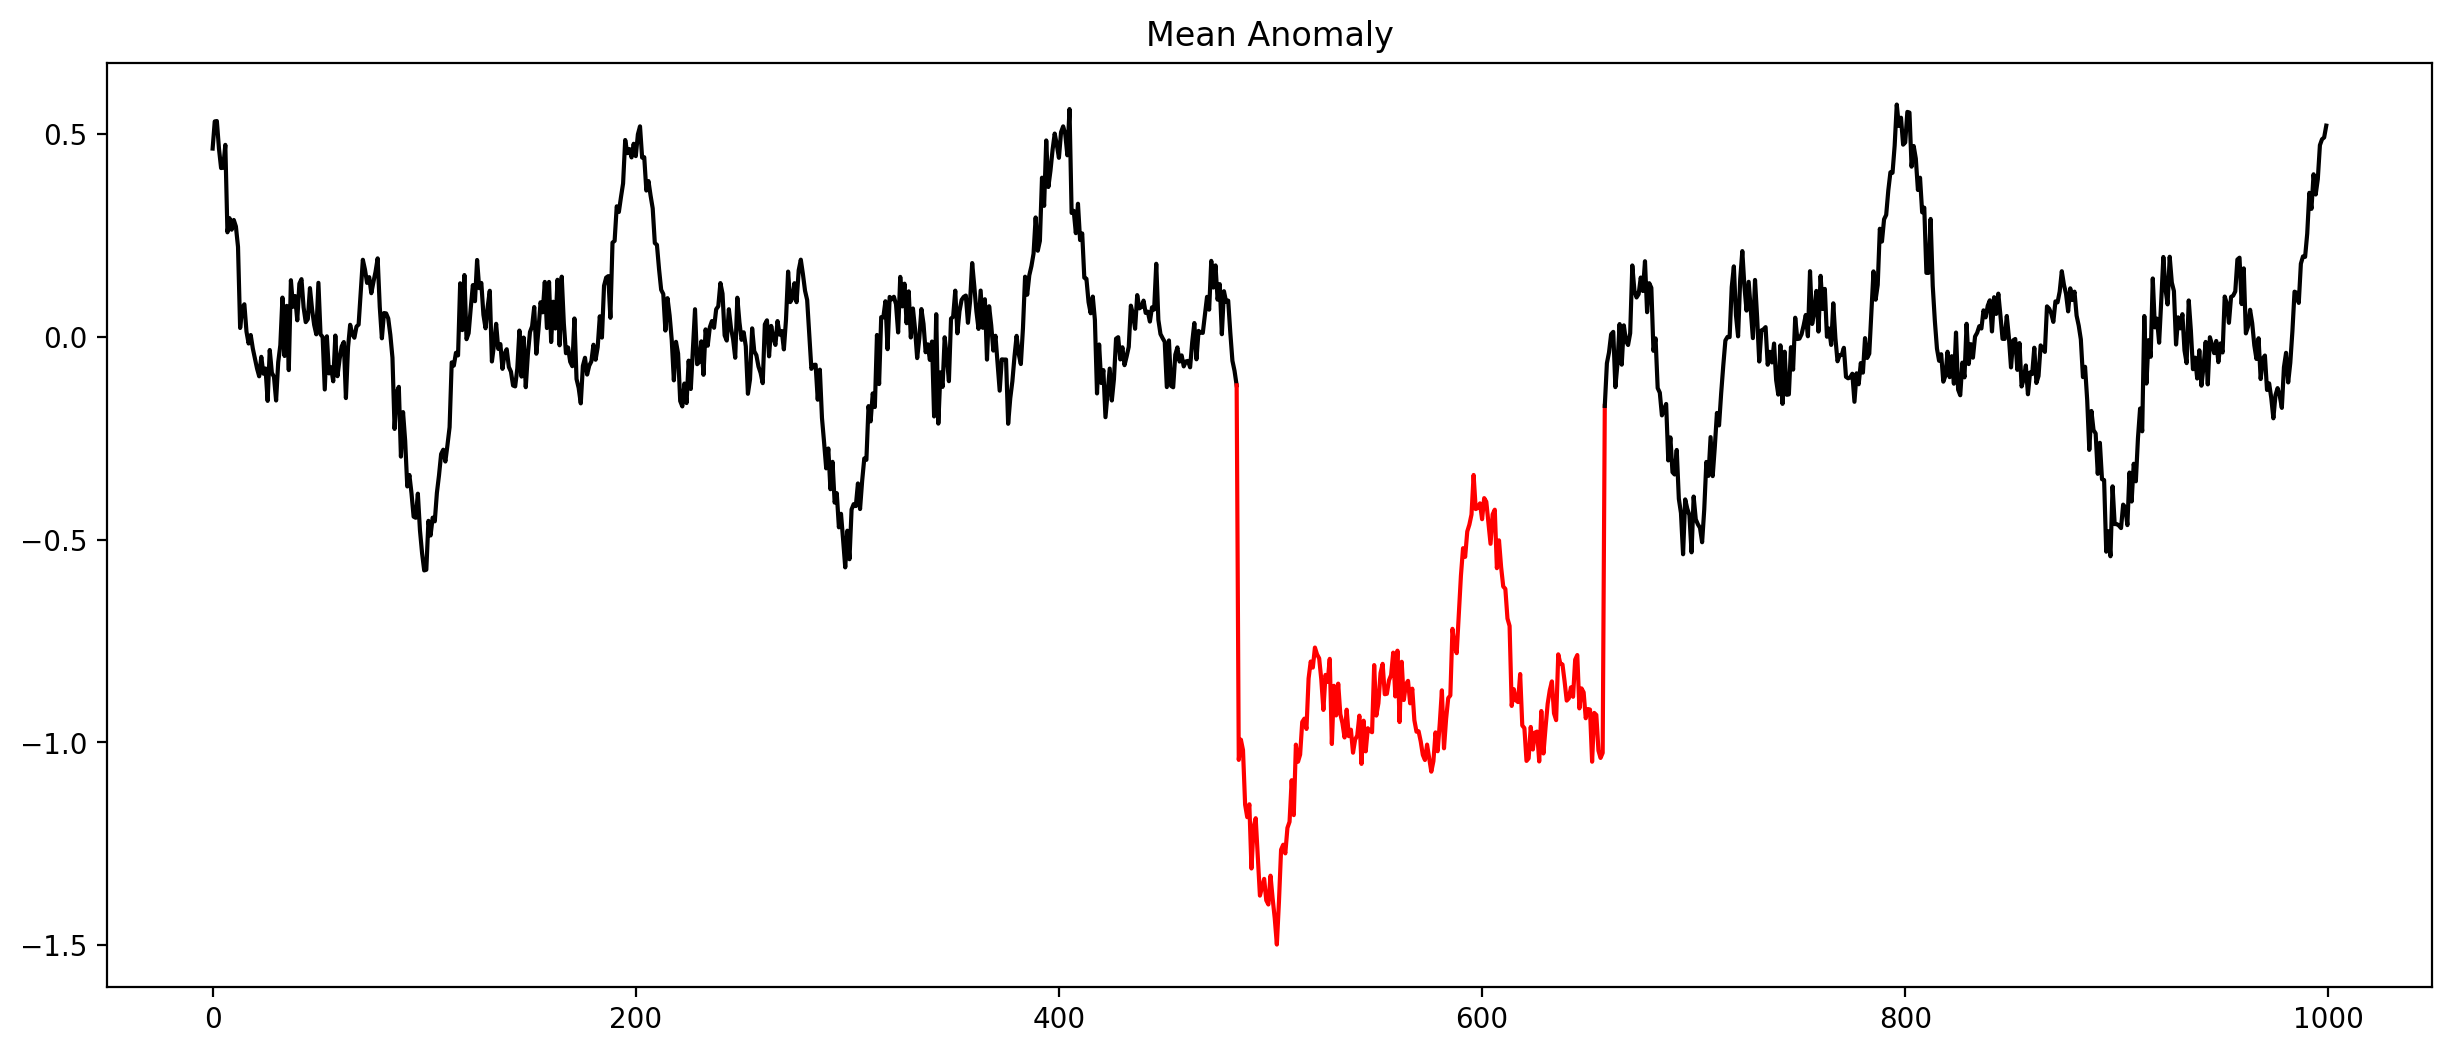
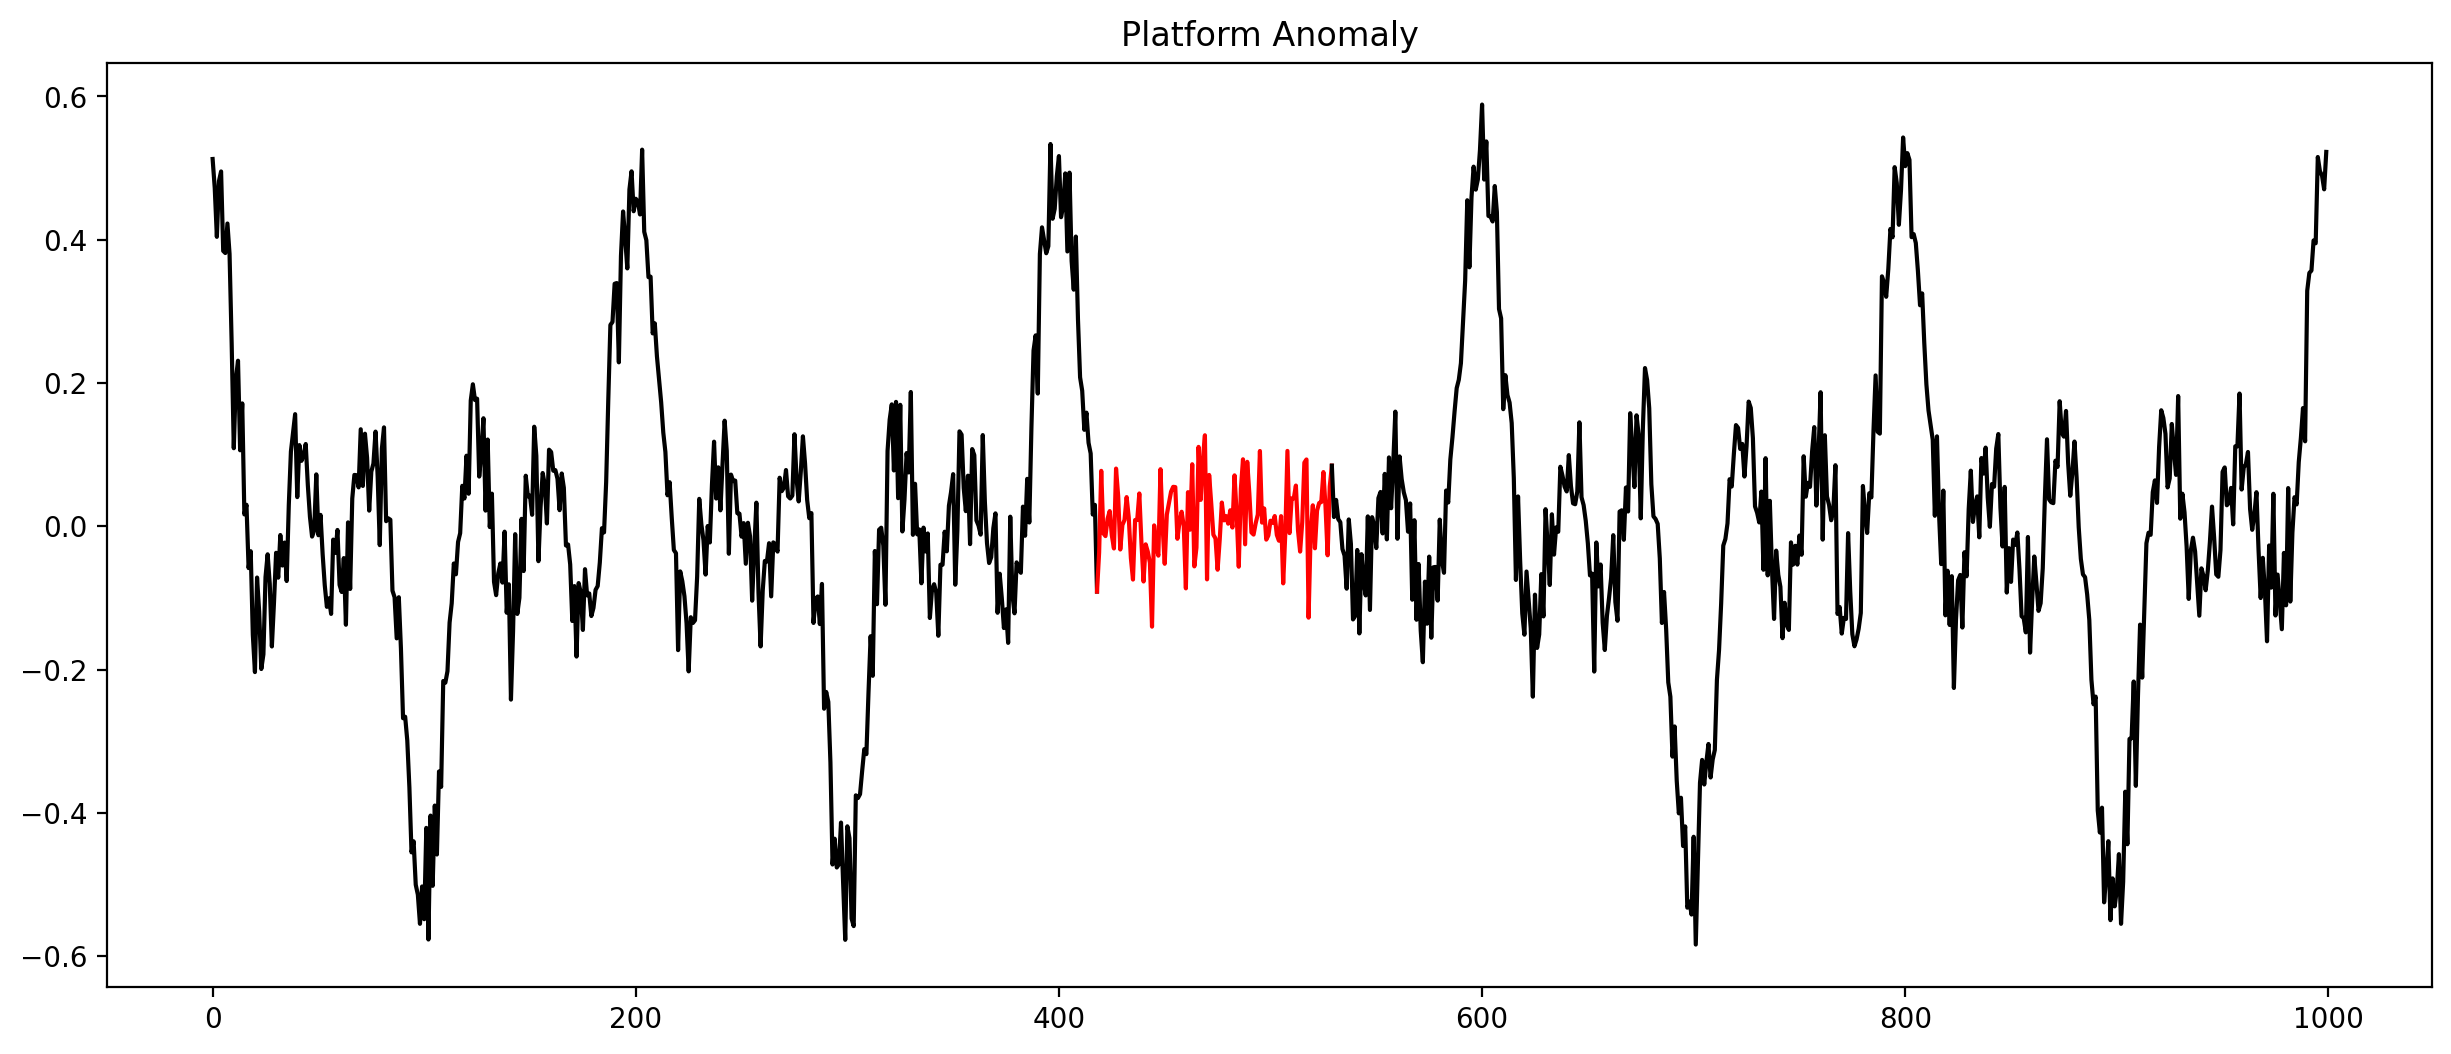
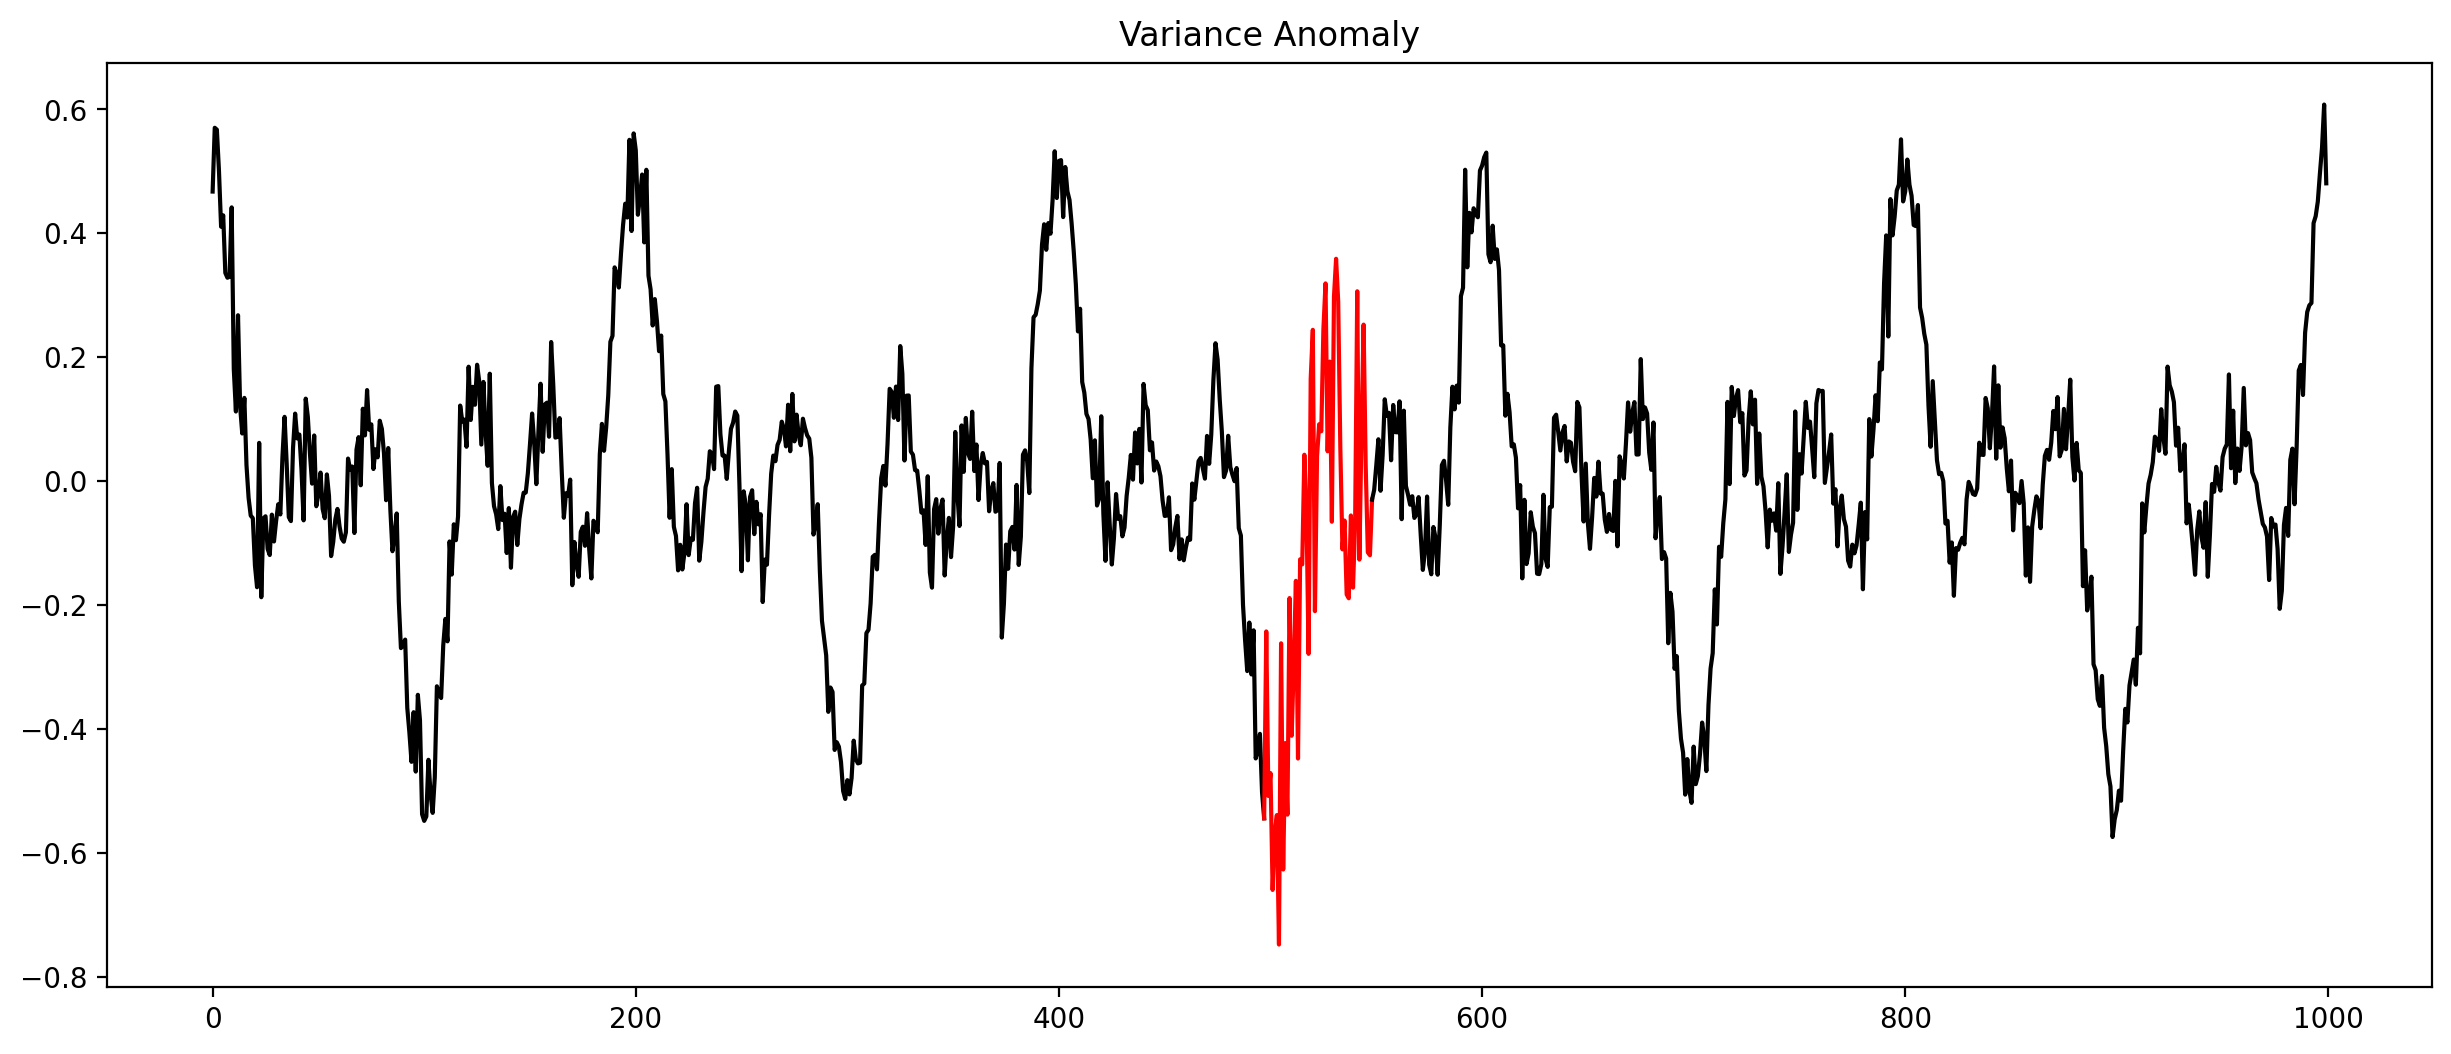
Anomaly = Unexpected Pattern
Check every time series by hand?
Let algorithms do the work!
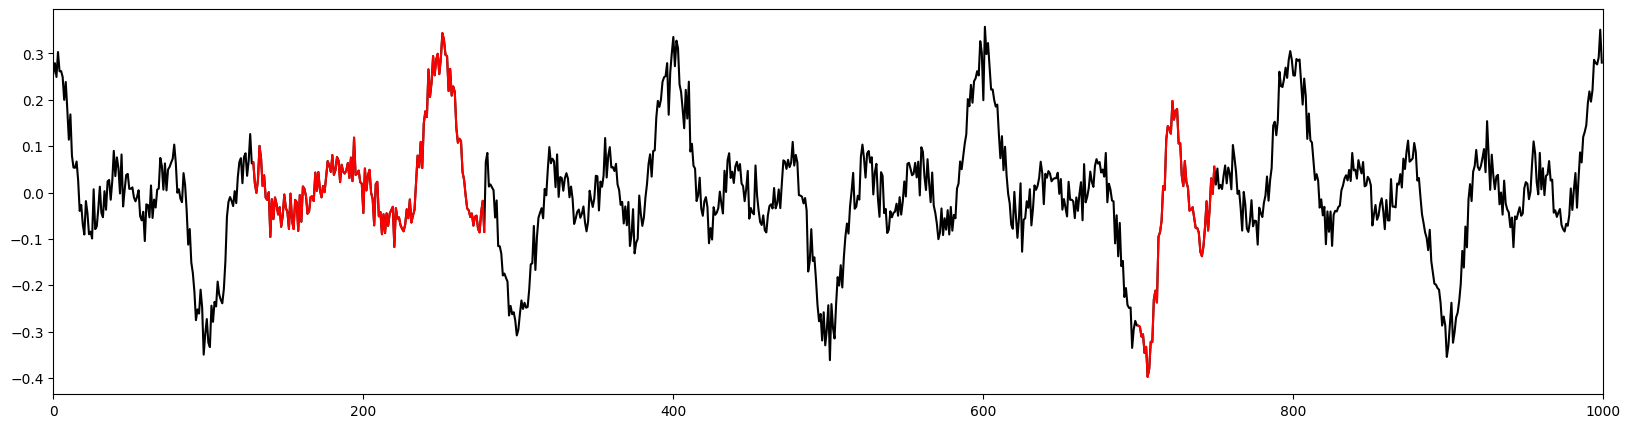
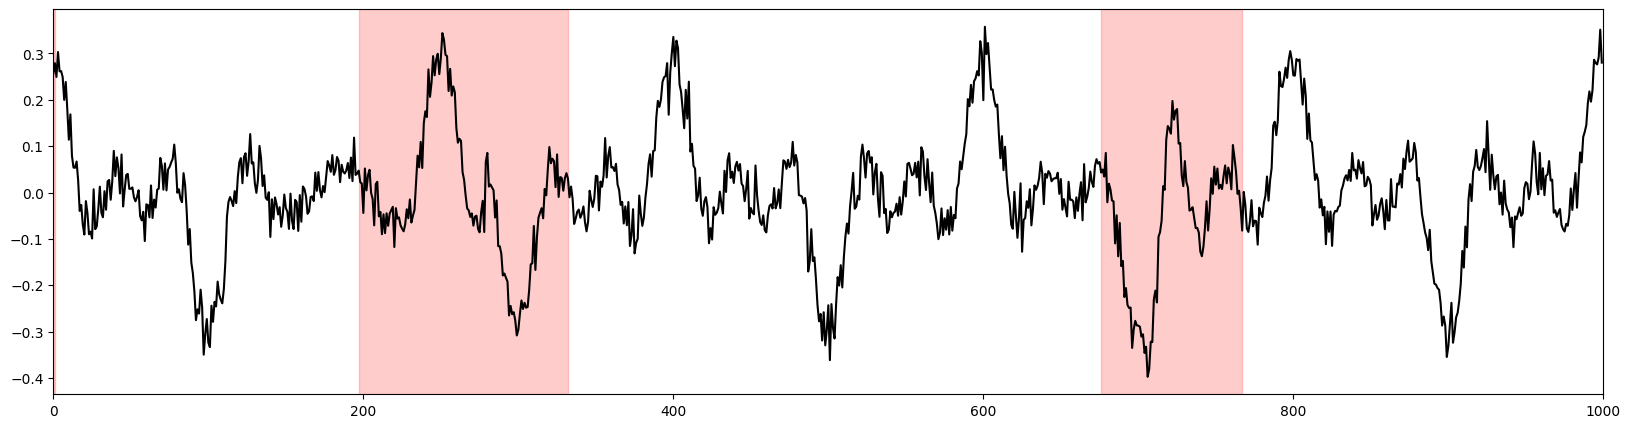
We would like to find these anomalies:
Apply unsupervised algorithms = no training required
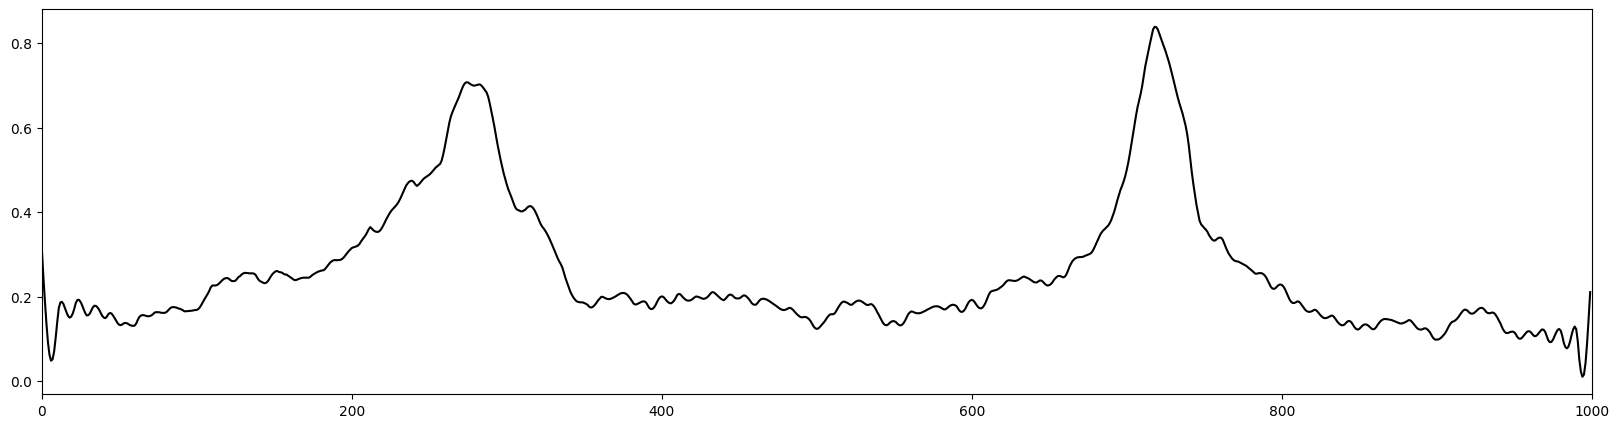
Unsupervised algorithms produce a scoring
Input Time Series
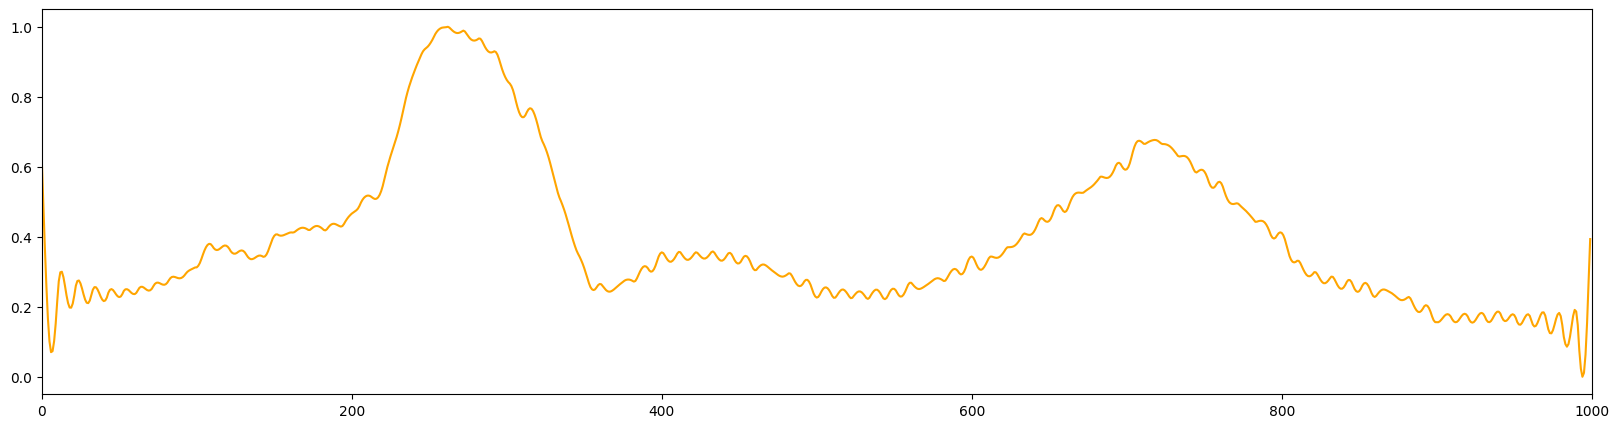
K-Means
Better for first anomaly
Local Outlier Factor
Better for second anomaly
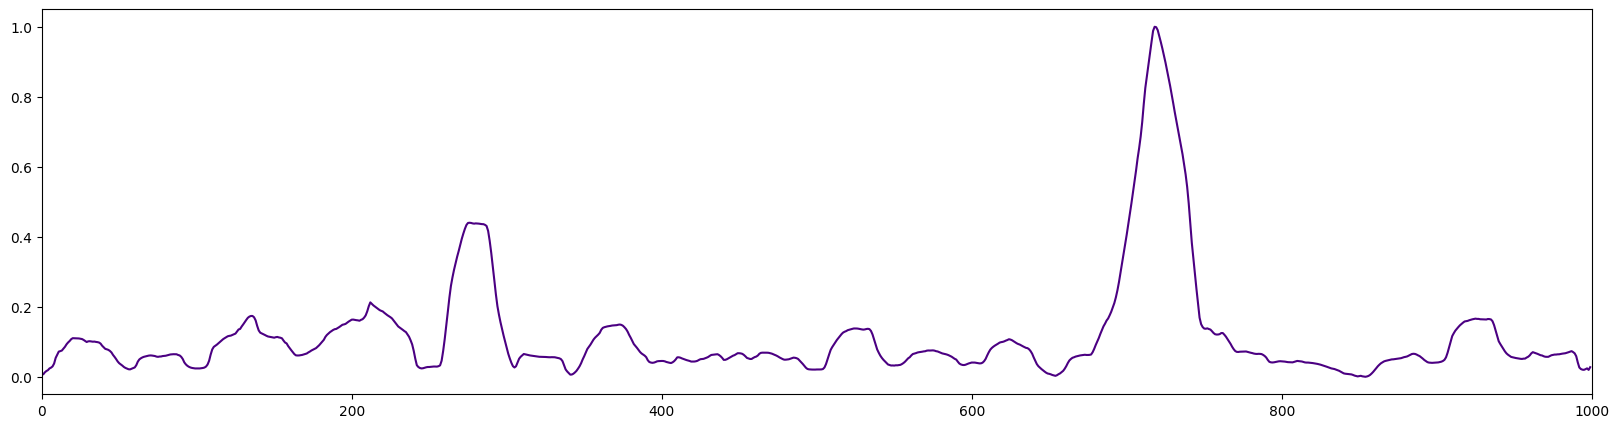
Ensemble to combine strengths
Input Time Series
Ensemble
Average of LOF and K-Means
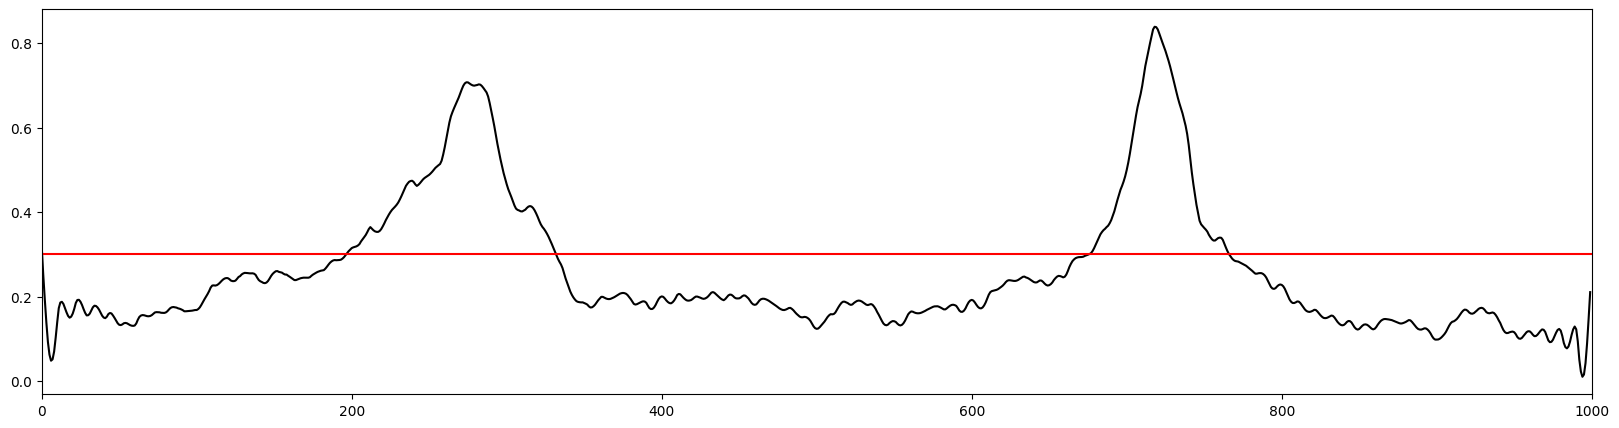
Threshold
Everything above threshold = anomaly
The Result are Interval Annotations for Anomalies
Not perfect, but close enough
Coming back to this:
We now ask:
- Which anomalies commonly arise? Can they be categorized?
- Which strengths and weaknesses do the algorithms exhibit?
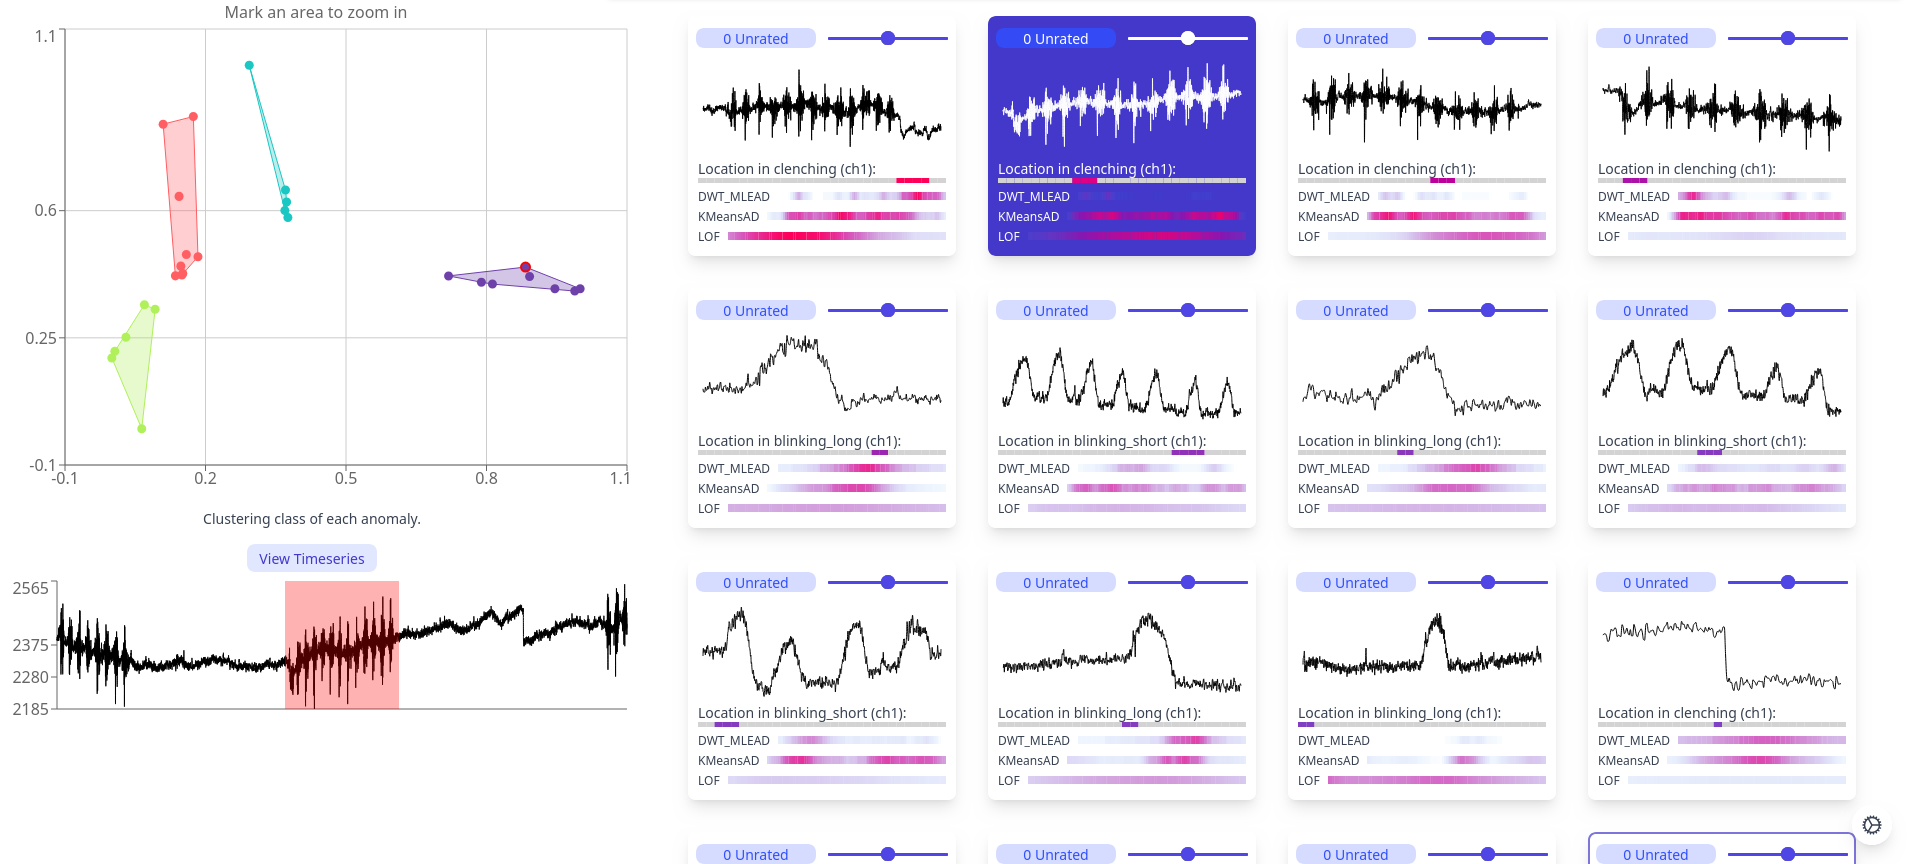
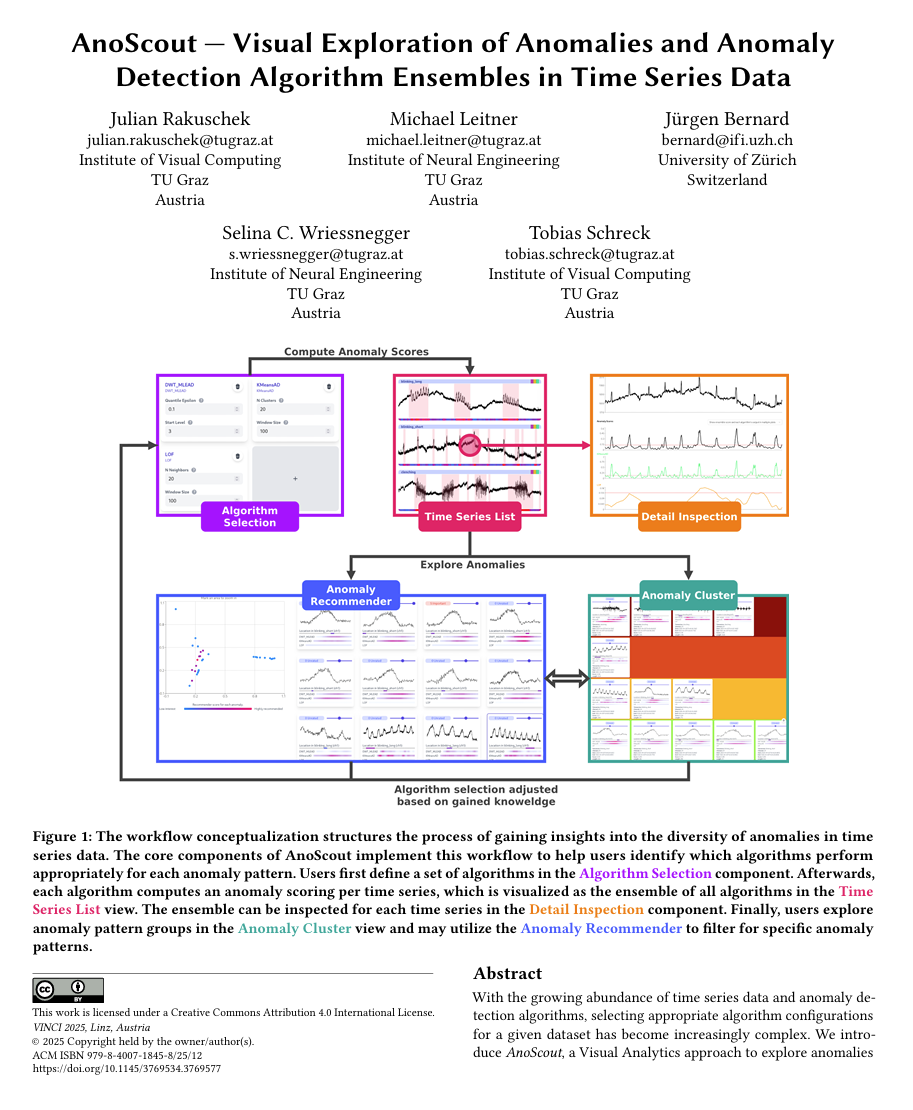
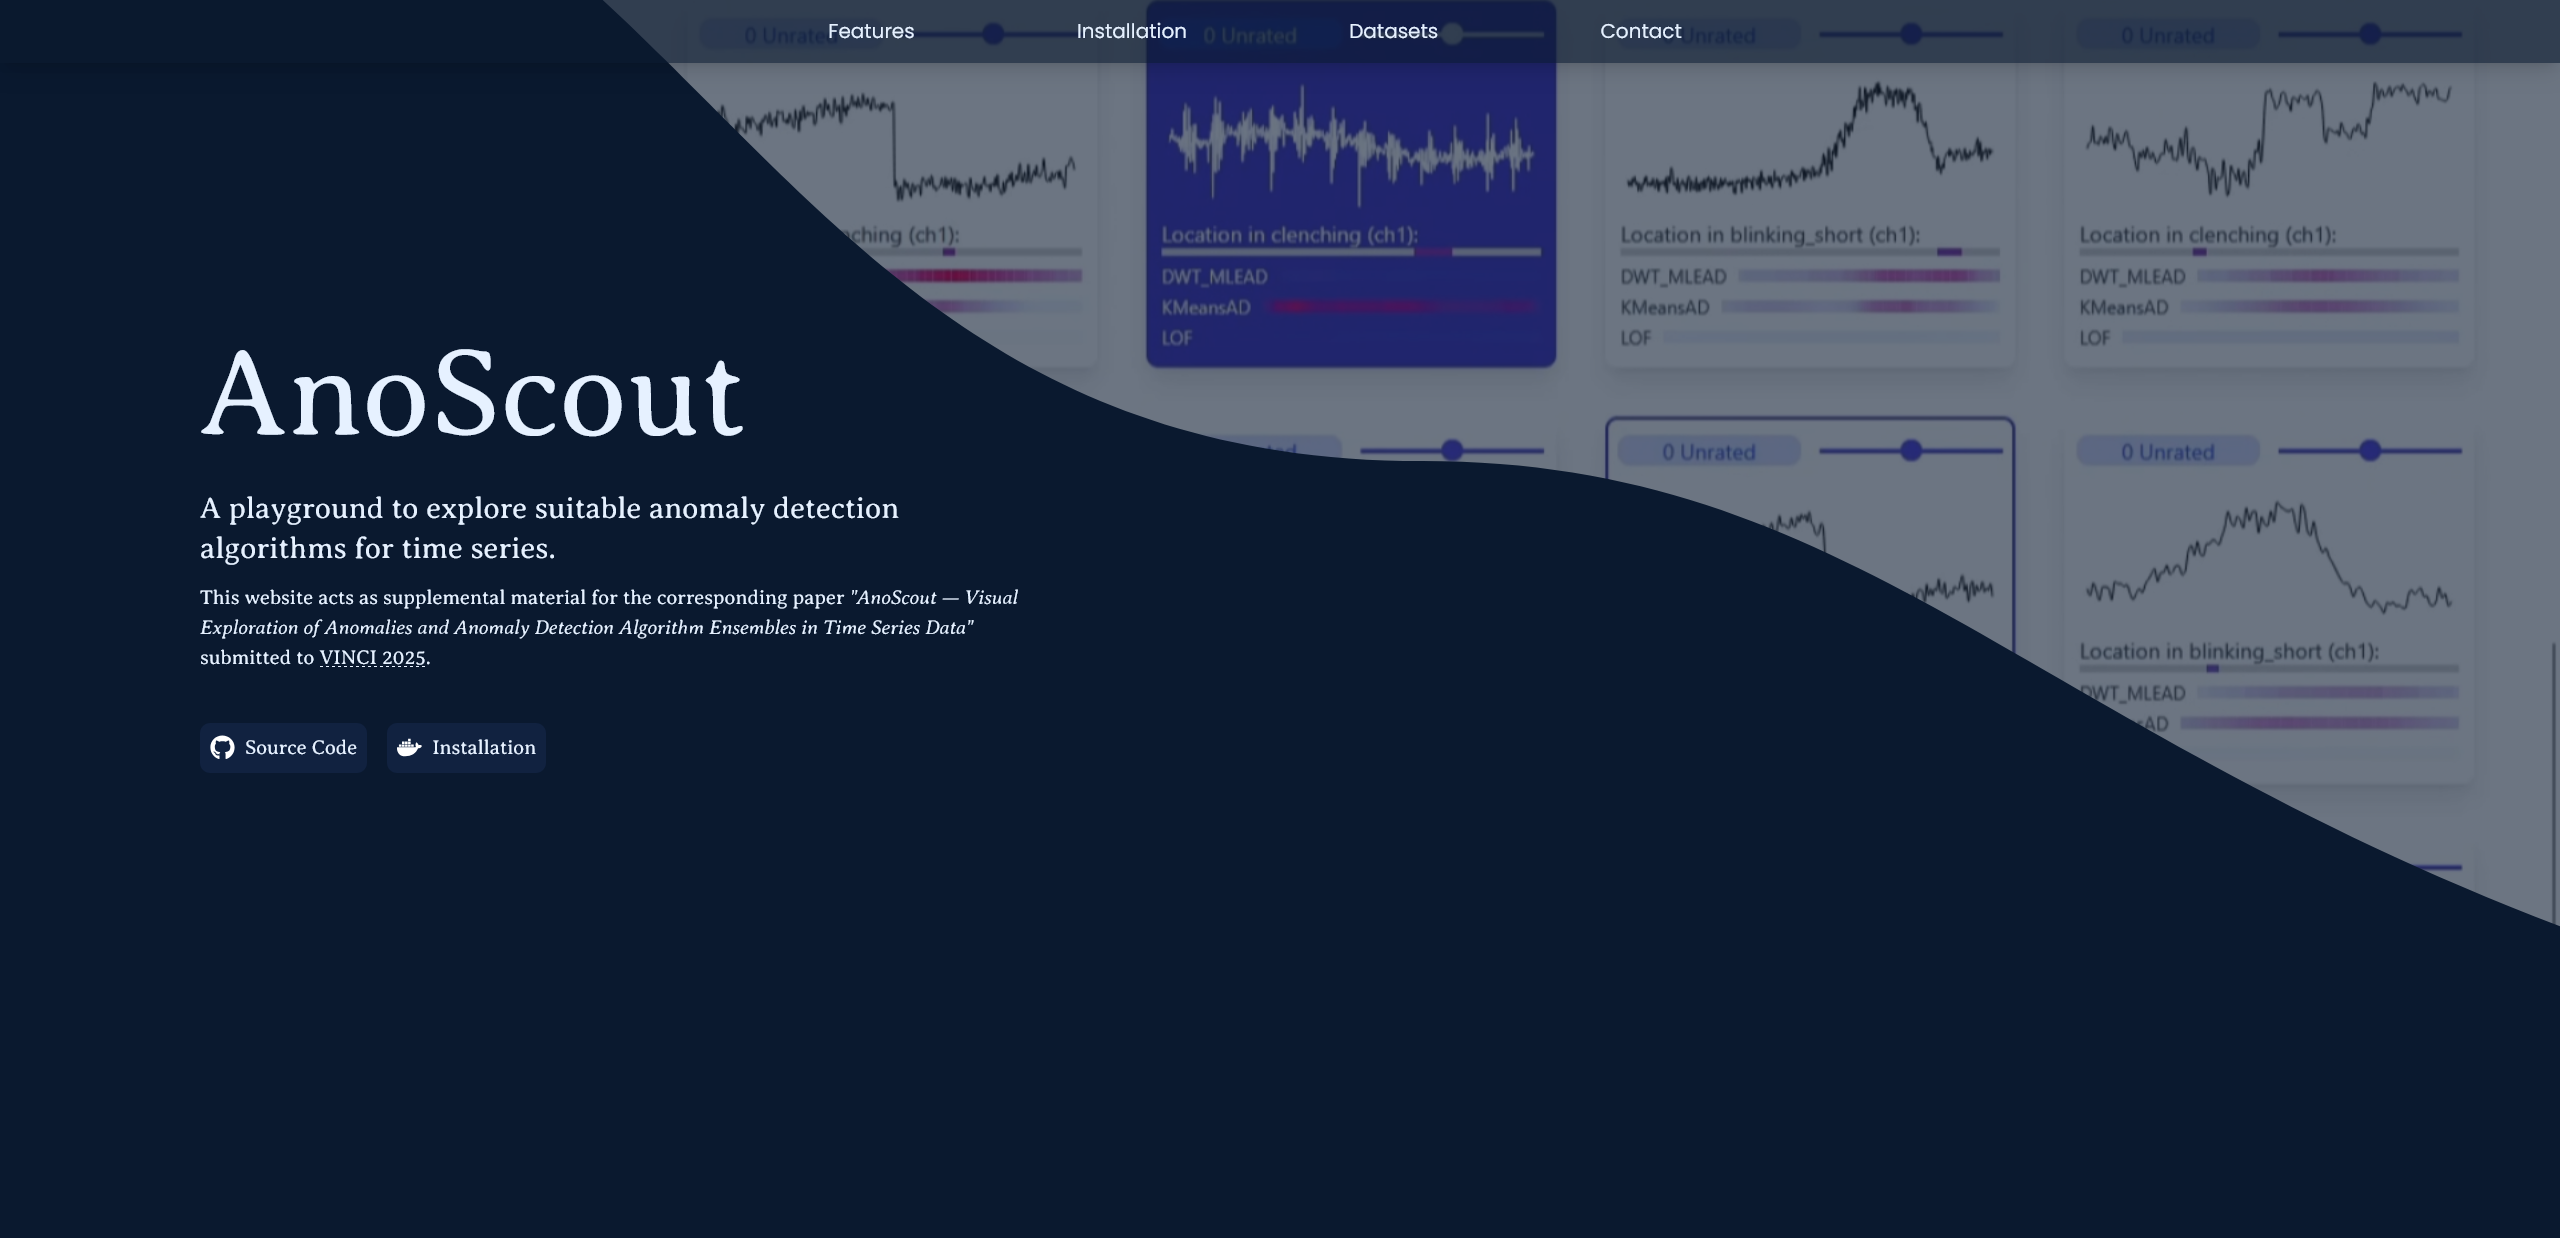
Introducing AnoScout
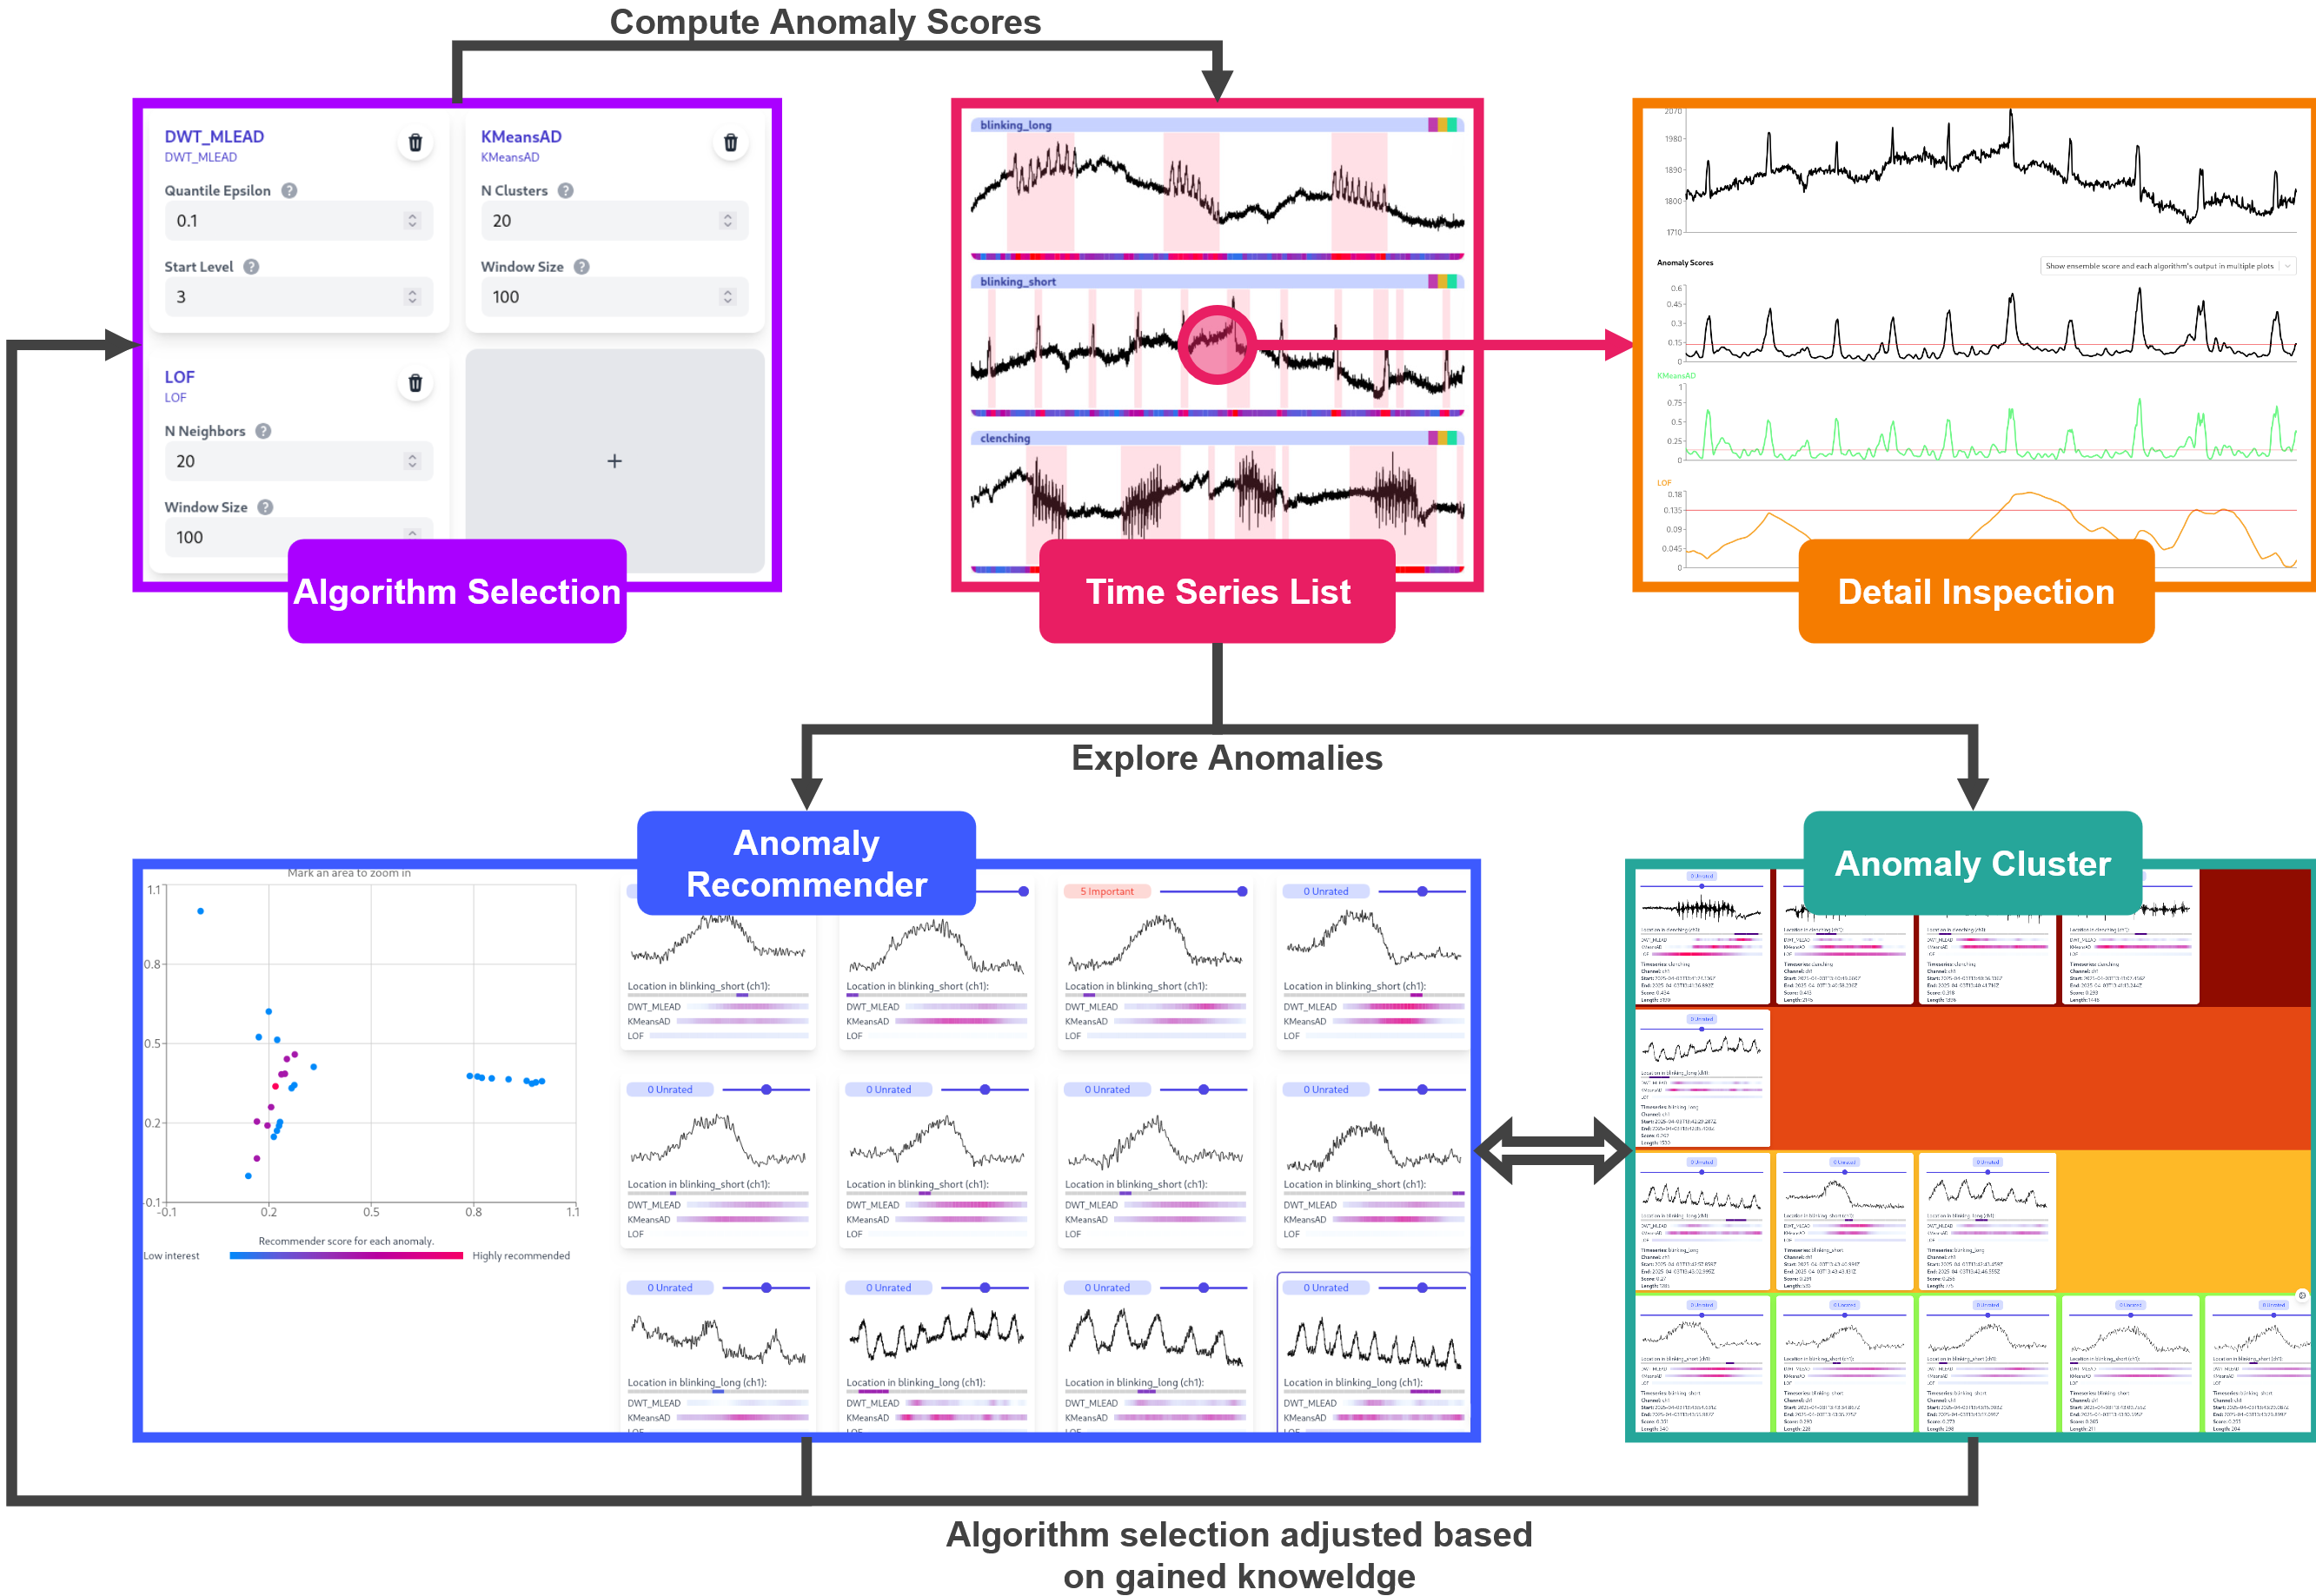
AnoScout = Playground to test anomaly detection algorithms
Our contribution: A workflow to explore anomalies
Extract Anomalies
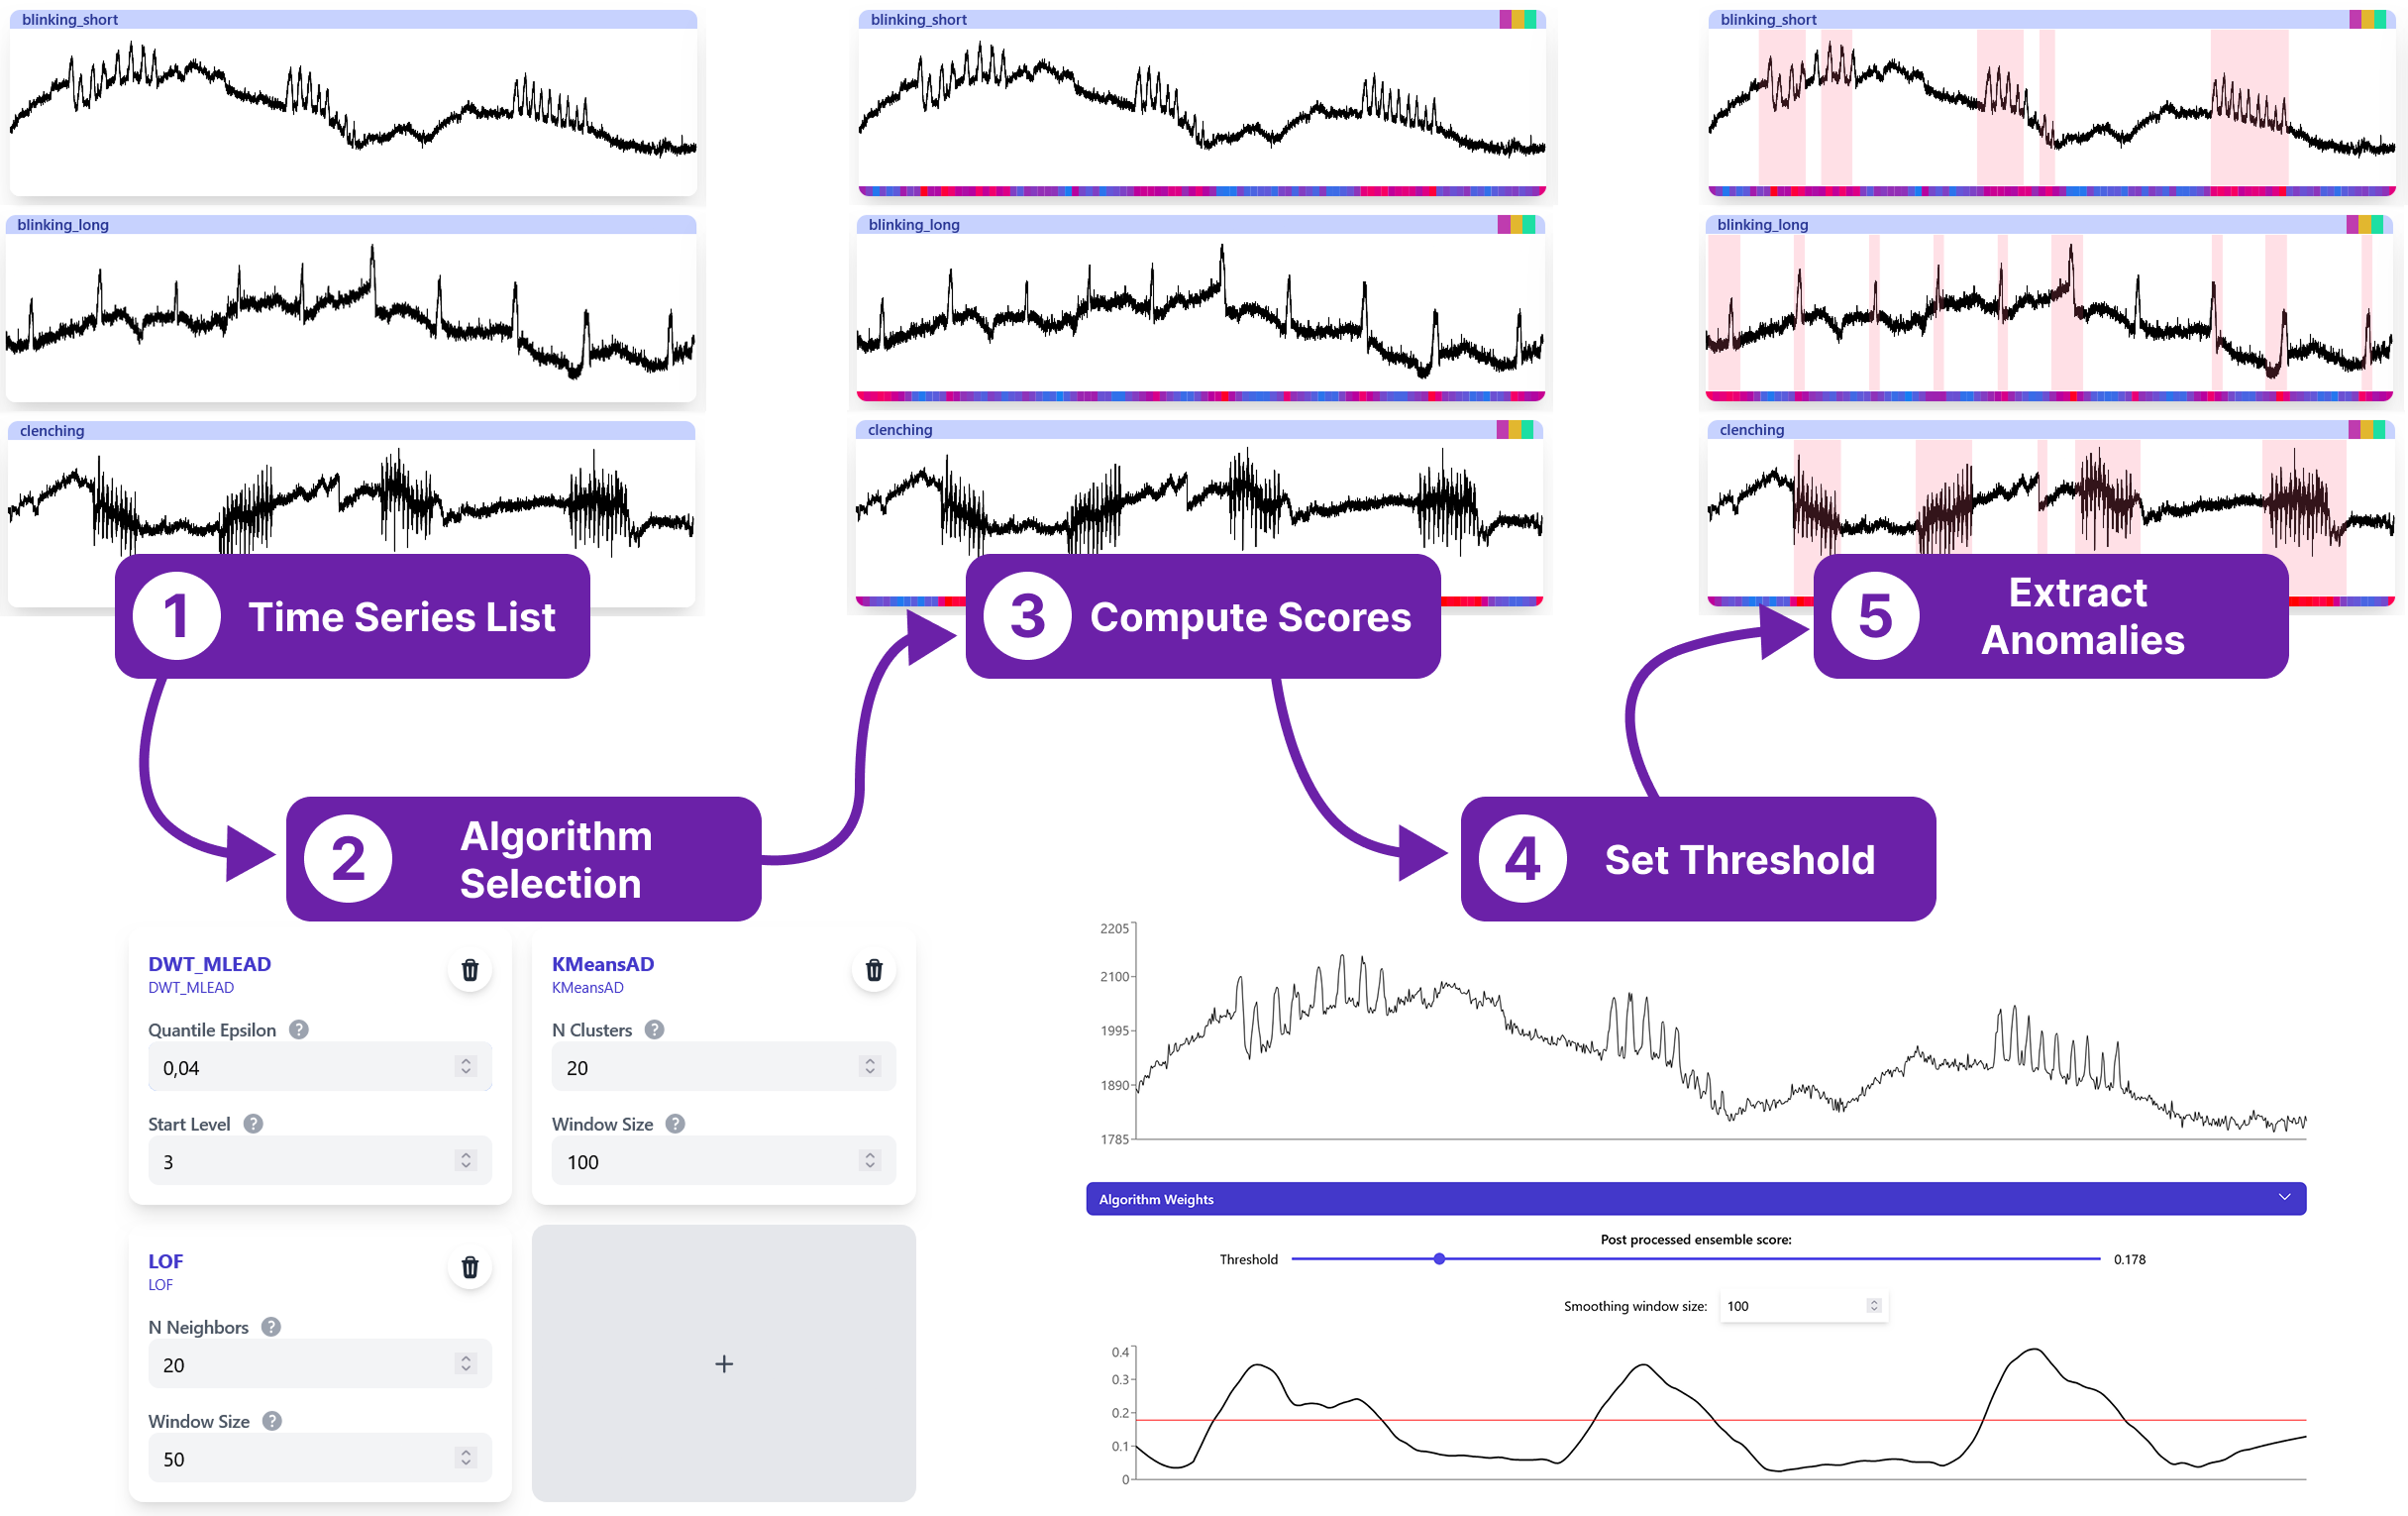
Each anomaly is represented through a card
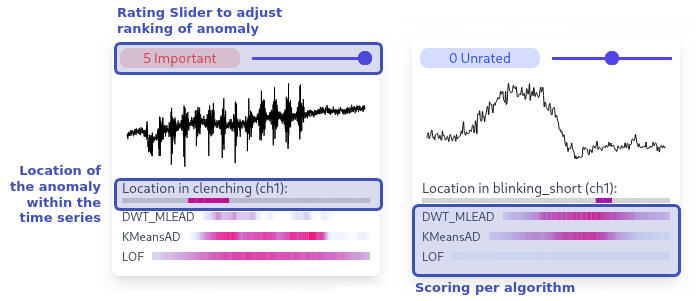
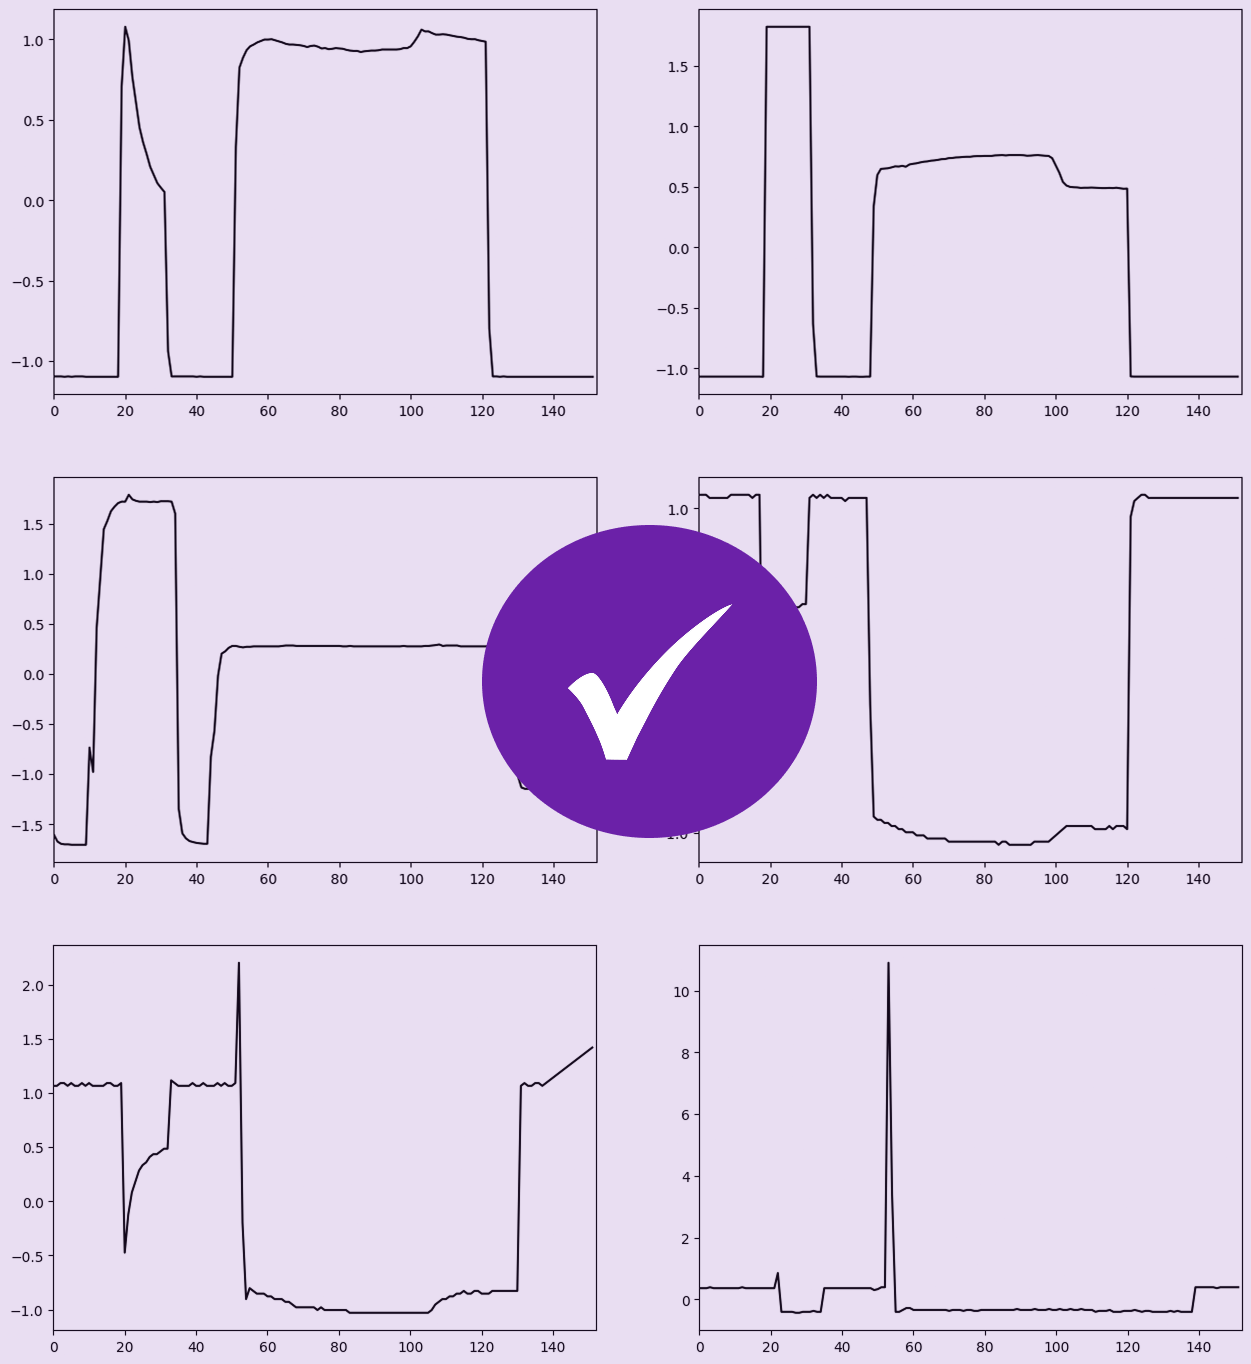
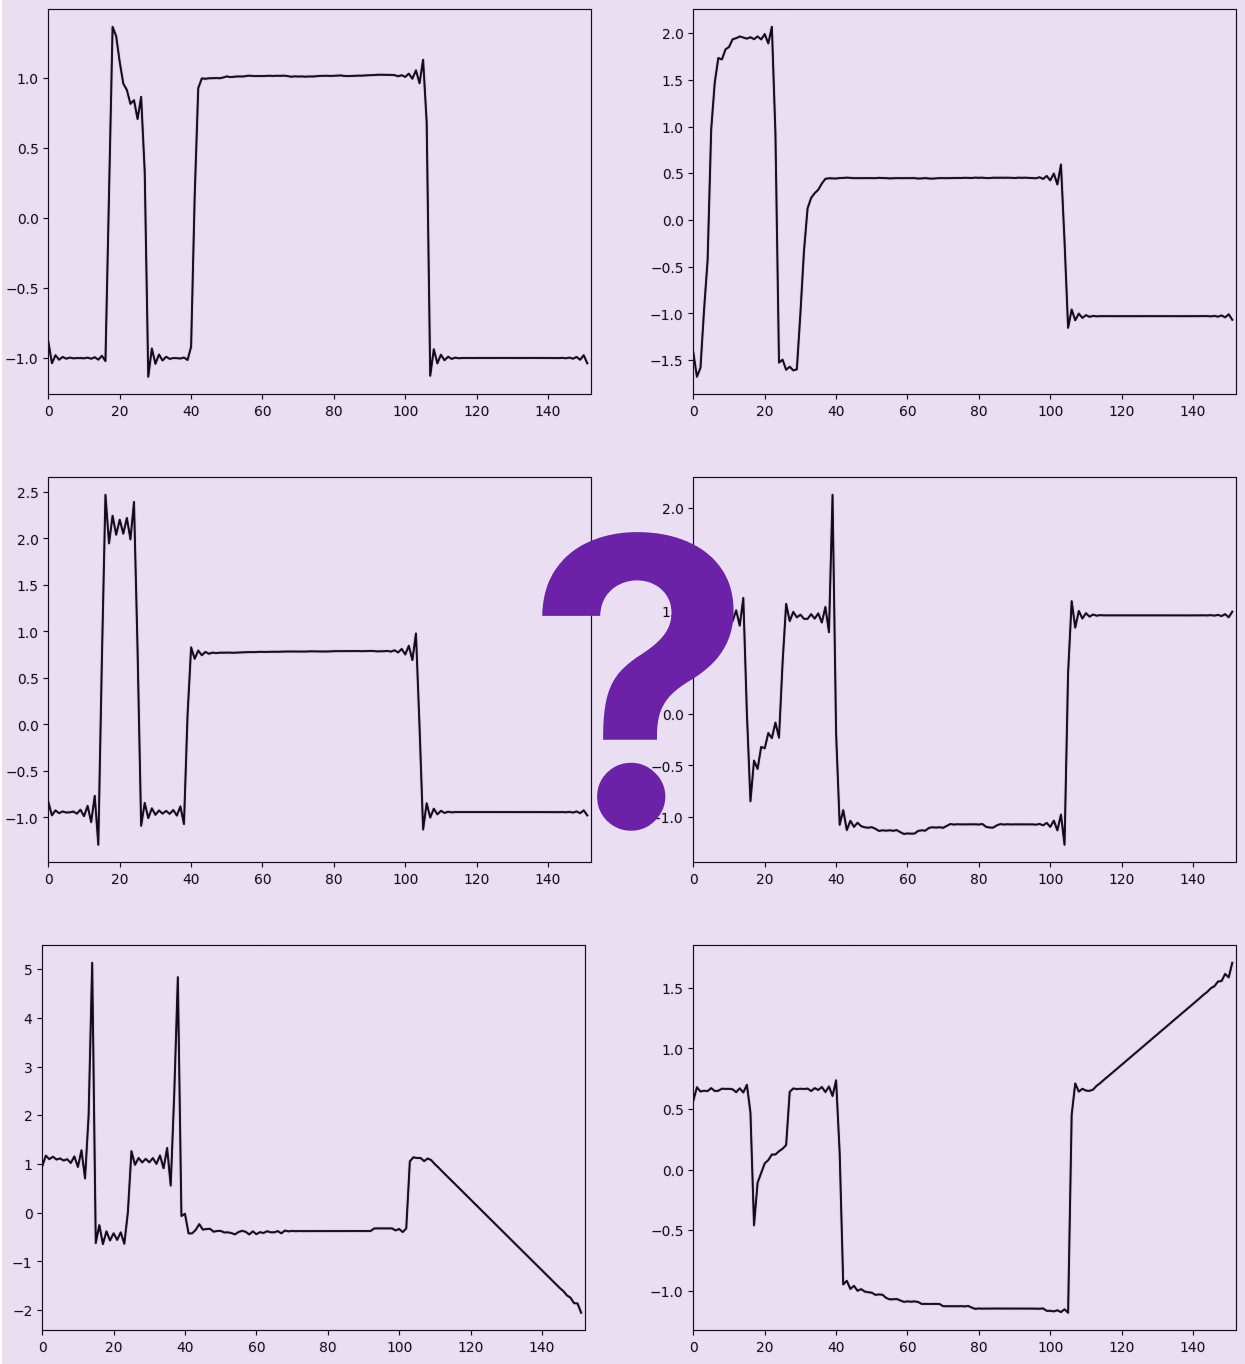
Explore Anomalies
Projection Based
Step 3: Rank Anomalies
This was all unsupervised.
What if I already know the expected behavior?
Scenario: Manufacturing
How can we configure a classifier for that?
AnoScout supports configuring a classifier
Explore Anomalies
Cluster Based
Summary
Future Work
- Algorithm Parameter Guidance
- Multivariate Time Series
- Progressive Exploring for Large Datasets
Published at VINCI 2025
Coming Soon ...
Open Source with Docker Setup

Danke!
Julian Rakuschek
julian.rakuschek@tugraz.at
Slides: